
the discovery of x-rays more than a century ago. However, most of the
important advances have occurred in the last 30 years. It is now hard
to imagine the practice of clinical medicine or research without
imaging studies. This intertwined relationship between clinical
practice and imaging is very evident in orthopaedics.
imaging studies performed, and it is almost always the first imaging
examination that is requested before embarking
on
more complex studies. The other imaging modalities include fluoroscopy,
magnetic resonance imaging (MRI), multidetector row computed tomography
(MDCT), ultrasonography, and nuclear medicine. Radiography,
fluoroscopy, and MDCT utilize x-rays generated in vacuum tubes. Nuclear
medicine utilizes a form of x-rays generated by the decay of
radioactive nuclei called γ rays. MRI utilizes radio waves, whereas
ultrasonography utilizes sound waves. Under proper and predetermined
conditions, x-rays, radio waves, and sound waves can penetrate the
human body and can carry useful information that can be captured by
appropriate detectors and be displayed either on film or on TV monitors
for viewing by physicians. Within the diagnostic range, radio waves and
sound waves have not been shown to produce harmful effects on humans;
however, this is not the case with x-rays, especially when they are
used on infants and young children (1).
Because x-rays are so central to our ability to perform diagnostic
work, it is essential that every physician who performs or requests
imaging studies becomes familiar with the nature of this form of
electromagnetic energy, understands its interaction with living tissue,
and learns how to use it safely.
won the Nobel Prize for Physics in 1901 for this discovery. X-rays and
visible light both belong to the electromagnetic spectrum, which has a
wide range of wavelengths and frequencies. Less energetic
electromagnetic waves have longer wavelengths and lower frequencies and
carry radiant heat from its source. More energetic electromagnetic
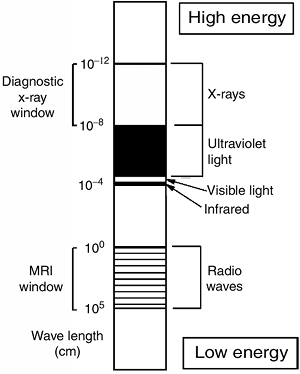
waves have shorter wavelengths and higher frequencies (Fig. 3.1).
As the wavelength decreases, the energy of the waves increases until
the waves become capable of ejecting electrons from the shells of atoms
they come in contact with; this action is described by the term ionizing radiation (2).
By this process, electromagnetic radiation imparts energy to the
tissues it interacts with. The energy dose to the tissue is defined in
terms of the energy absorbed. In the past, the unit used for measuring
dose was the rad (radiation absorbed dose), but now the gray (Gy) is the unit of choice; 1 Gy = 100 rad.
the properties of a wave as well as those of particulate radiation or
of bundles of energy called photons. These
concepts of wave and particle have been postulated to explain a variety
of physical characteristics of electromagnetic radiation. In contrast
to sound waves, electromagnetic radiation can travel in vacuum and does
not require a medium to transport or conduct it. The speed of
electromagnetic radiation in vacuum is fixed and is equal to 3 × 10⁸ m per second.
 |
|
Figure 3.1
Diagram of the electromagnetic spectrum. Radio waves have low energy and long wavelength; x-rays have much more energy and shorter wavelength. |
energetic stream of electrons strikes a metal target, or anode. The
negatively charged electrons are decelerated by the positively charged
nuclei of the target or anode, which cause the electrons to change
their path and lose their kinetic energy in the form of x-rays of
different wavelengths. In order to maximize the process of x-ray
production, it is desirable to select a target material with a high
atomic number; the nuclei of the material will have a large positive
charge, capable of attracting and decelerating electrons. The electrons
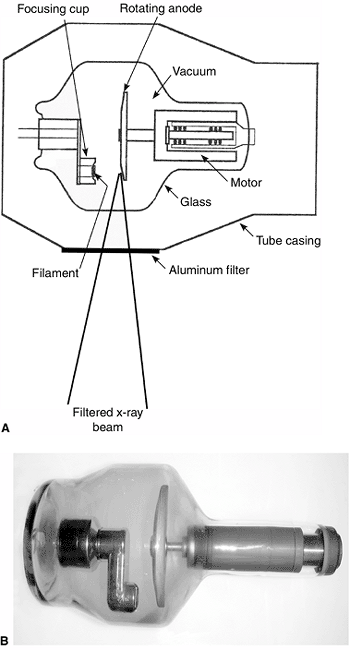
originate at the negative terminal of the tube, which is called the cathode or filament (Fig. 3.2)(3).
X-ray tubes are typically equipped with two filaments, one large and
one small, which liberate electrons when heated. The large filament is
used for large exposures such as thick body parts and large or
overweight patients. The area on the target that is bombarded by
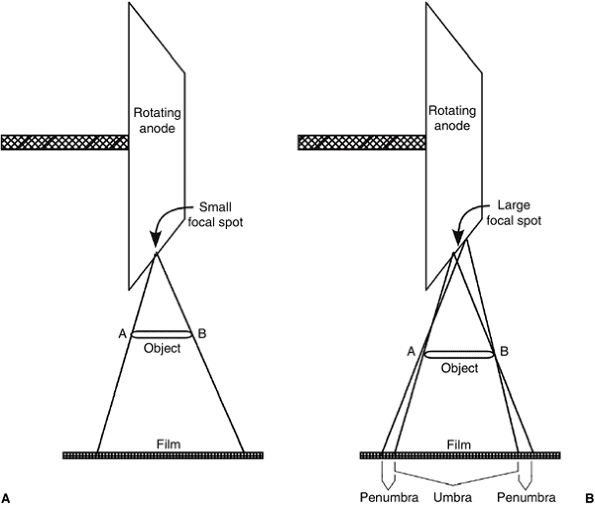
electrons is referred to as the focal spot, which, in orthopaedics, should ideally be as small as possible (0.3 to 0.6 mm) in order to produce sharper images (Fig. 3.3).
The energy spectrum of the emitted x-rays is determined by the electric
potential (voltage) between the cathode and the anode.
not an efficient one. For electrons in the diagnostic range
(approximately 50 to 150 kV), only 1% of the kinetic energy in the
electron stream is converted to x-rays; the rest dissipates as heat.
The ability of the x-ray tube to achieve high x-ray output is limited
by the enormous amount of heat generated at the target or anode. To
overcome this problem, the rotating anode was developed so that
electrons do not
strike
the same location on the anode. This allows the x-ray tube to withstand
larger accumulations of heat that are generated during large exposures.
Both the filament and the target are made of tungsten, which has a high
melting point of 3370°C as well as a high atomic number, thereby making
it an ideal target material (3).
 |
|
Figure 3.2 A: The components of the x-ray tube. B:
Photograph of an x-ray tube. The glass casing maintains absolute vacuum within the tube. All the components of the tube are designed to withstand high temperatures, especially the anode. |
The quantity of x-rays in each exposure is proportional to the number
of electrons flowing from the filament (cathode) to the target (anode);
this is measured in milliamperes. The milliampere setting can be
adjusted on the control panel by the technologist. The quality, or
penetrating capability, of the x-ray beam is determined by the kinetic
energy of the electrons striking the target or the kilovoltage setting
between the cathode and the anode. Electrons with high kinetic energy
produce a preponderance of energetic x-rays. Such x-rays have shorter
wavelengths, higher frequencies, and more penetrating power (2).
beam that emerges from the x-ray tube consists of different wavelengths
and frequencies (polychromatic beam). The interaction of x-rays with
living tissue is dependent on the energy of the x-rays emitted (4).
Very low energy x-rays are not diagnostically useful and are actually
harmful to the patient because they are totally absorbed by the first
few centimeters of tissue and therefore fail to reach the film or
detector. To rectify this problem, x-ray tube casings are designed with
filters to remove very low energy x-rays. Aluminum filters, 1 to 3 mm
thick, are the most commonly used general-purpose filters. Filtration
is useful for changing the composition of the polychromatic x-ray beam
by increasing the ratio of x-rays that are useful for imaging to x-rays
that only increase the patient’s radiation dose. This process is known
as beam hardening. By filtering out very
low energy radiation and by allowing high-energy x-rays to pass
through, a higher proportion of the beam is capable of penetrating the
patient, and carrying diagnostically useful information to the film or
detector (4).
because the patient absorbs less radiation; however, such x-rays
generate significant scattered radiation, resulting in foggy images and
diminished tissue contrast on radiographs. X-rays interacting with
tissues bounce off the atoms in the tissue and are deflected from their
straight path, giving rise to the scattered radiation. To control
scatter and to improve image quality, radiographic grids are used. The
grid is the most common method for controlling scatter in medical
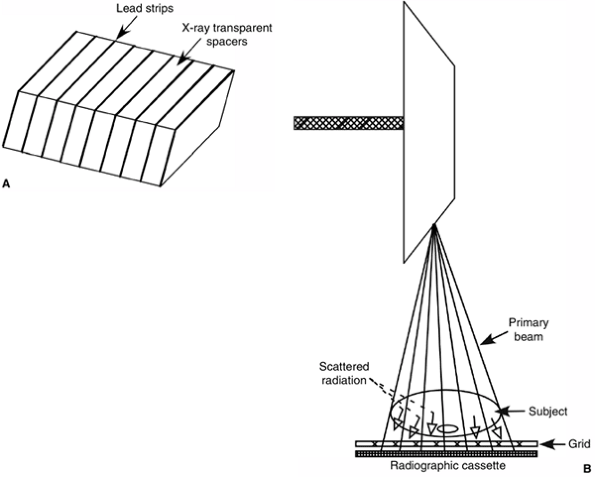
radiography. Grids consist of thin lead strips separated by
x-ray–transparent spacers (Fig. 3.4) (5).
The amount of scatter is directly proportional to the thickness of the
body part, and also to the field size, (i.e., the area exposed).
Thicker body parts produce more scatter than thinner parts. Larger
field sizes also result in scatter and poorer tissue contrast on
images. Thin body parts such as hands, feet, and cervical spine produce
little scattered radiation and can be radiographed without a grid.
Limiting the field size to the area of interest achieves two important
objectives: it reduces scatter and it limits the radiation to the body
part of clinical interest (Fig. 3.5).
receptor. X-rays traveling in a straight line carry useful information
and, for the most part, pass through the transparent spacers in the
grid and reach the film or detector. Scattered or deflected rays are
absorbed by the lead strips and are therefore prevented from reaching
the detector, where they degrade image quality (Fig. 3.4) (5).
 |
|
Figure 3.3 The effect of the focal spot size on image sharpness. A: A small focal spot produces sharp images. B: A large focal spot produces unsharp images with significant penumbra.
|
human anatomy in real time, especially during surgical or diagnostic
intervention. Modern fluoroscopy systems include an image intensifier
and a television system for image viewing, but, apart from that,
fluoroscopy and radiography share the same imaging components. Because
physicians operate the fluoroscopic equipment, it is important that
they understand the physical principles that govern the safe and
efficient use of fluoroscopic imaging (6). A
major difference between fluoroscopy and radiography is that
fluoroscopy is associated with a low rate of radiation exposure.
However, the total radiation exposure from a radiographic examination
is much lower than that from the typical fluoroscopic examination
because the exposure time in a typical radiographic examination lasts
only for milliseconds, whereas the fluoroscopic exposure time can last
for several minutes. Fluoroscopic equipment is available in many
different configurations for use in a wide variety of clinical
applications. Mobile C-arm units are ideal for orthopaedic work. They
provide a compact design, image chain angulation, and image recording
devices. Mini C-arm systems are fairly inexpensive. They are designed
for imaging the extremities where only low exposures are needed (6).
can result in the production of high quality images and, therefore, in
the reduction in errors of interpretation. Photons from the x-ray
source interact with tissues and pass though the patient’s body to
reach the film or detector. Variations in tissue composition give rise
to differences in attenuation and spatial variations in the x-ray beam
exiting the patient’s body. For example, in air-containing organs such
as the lung, x-rays pass through with only minimal attenuation, whereas
most x-rays are absorbed or markedly attenuated as they pass through
cortical bone. Fat attenuates x-rays more than air does, whereas water
and soft tissues attenuate x-rays more than fat but less than bone.
These alterations in the x-ray beam exiting the patient produce
differences in responses on different parts of the film or
detector.
The diagnostic information in a radiograph or fluoroscopic image is
obtained from the quantity of x-ray beam that emerges after the
incident x-ray beam passes through the body (4).
The beam that emerges after passing through the body varies in
intensity because of attenuation within the body. The alterations in
energy in the x-ray beam exiting the patient’s body produce differences
in the light output as the x-rays hit the intensifying screen in the
radiographic cassette, where x-rays are converted into visible light.
As more x-rays pass through the patient and reach the intensifying
screen, more visible light is generated, and the radiographic film
sandwiched between two intensifying screens becomes darker.
Intensifying screens are used because the sensitivity of radiographic
film to x-rays is low compared with its sensitivity to visible light.
The efficiency of the intensifying screen in converting x-rays to
visible light is very important in reducing the radiation dose to the
patient. State-of-the-art radiography using film cassette combinations
relies almost exclusively on the use of rare earth screen systems,
which are very efficient in converting x-rays to visible light (5).
 |
|
Figure 3.4 A: Diagram demonstrating a cross section of a radiographic grid. B:
The mechanism by which a radiographic grid absorbs scattered radiation while allowing the primary beam to pass through and reach the radiographic cassette. |
 |
|
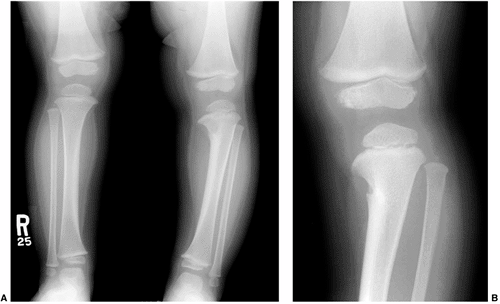
Figure 3.5
Improved resolution resulting from coning down the x-ray beam to the area of interest. The patient is a 4-year-old child who presented with bowing of the left lower extremity. A: AP view of both lower extremities demonstrates the bowing in the left lower extremity. An abnormality was noted in the proximal tibial metaphysis medially, but it was difficult to tell what the abnormality was. B: A coned-down view of the left knee shows fibrocartilaginous dysplasia of the proximal tibia. |
displayed, and stored on silver-halide–based film. In the last two
decades, filmless imaging technologies have started to take hold, and
it is conceivable that in the next 5 years all imaging will be
filmless. The advances that brought about this change include faster
and cheaper computers along with reasonably priced memory storage
devices. In addition, the modern digital equipment manufactured by
different companies can communicate information easily using a standard
digital protocol called Digital Imaging and Communication in Medicine (DICOM)
standards. There are several factors that may motivate radiologists and
hospitals to switch to digital radiography, but the main factor is the
ability to acquire high quality images and to store and distribute them
efficiently using the picture archiving and communications system (PACS).
What is also important in a busy orthopaedic practice is the ability of
digital radiography to accelerate patient throughput (7).
 |
|
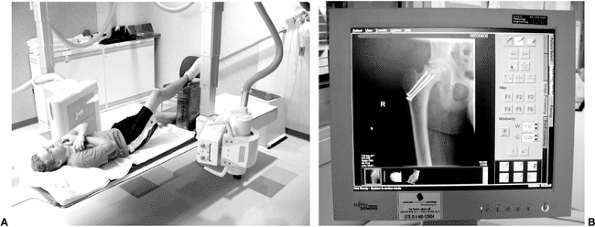
Figure 3.6 Direct digital radiography equipment. A: The film–screen combination is substituted with a flat panel detector. B: The image appears on a TV monitor a few seconds after the exposure.
|
Most computerized radiographic installations closely resemble
screen-film radiography using a cassette-based detector. Image quality
and spatial resolution in this system have continually improved over
the past few years, and, currently, its resolution is comparable to
that of the conventional screen-film system. The advantages of computed
radiography include (a) constant image quality, whereby over- or
underexposed images can be corrected without having to repeat the
exposure and (b) good tissue contrast even for regions with
considerably different densities (7).
have been introduced recently. This modality will very likely be the
trend for the future for acquiring high quality images and distributing
them throughout medical centers rapidly and efficiently. Some studies
have reported an approximate 50% reduction in the radiation dose
required for skeletal imaging. There is also a large ergonomic
advantage over the screen/film and computed radiography systems because
there is no need for cassette handling (Fig. 3.6). The readout mechanism is integrated with the detector and the
images are seen on the screen a few seconds after the exposure.
Radiography rooms equipped with flat-panel radiography detector systems
are very efficient, allowing high patient throughput (7,8).
technology will not be fully realized unless there is improved
efficiency in image management and reading. Ideally, digital images
should be viewed on modern flat-panel monitors using liquid crystal
display (LCD) screens with three million pixels (2000 × 1500).
(CT) witnessed a significant evolutionary advance in technology. The
newer MDCT machines have rows of detectors aligned along the
longitudinal axis of the patient (z axis) as well as along the transverse or axial plane (x–y axis) (9).
The advantages of this technology include unprecedented speed,
increased coverage, isotropic imaging, ability to image structures that
have metal hardware, and ease of interpretation. The high speed has
reduced the scanning time to a few seconds. This results in better
temporal resolution and therefore less motion blur, less need for
sedation in children (Fig. 3.7), and considerable time saving in emergency situations (10).
the ability to obtain two-dimensional (2D) reformatted images in any
arbitrary plane, and high quality three-dimensional (3D) images (Fig. 3.8).
This includes not only images in the standard sagittal and coronal
planes but also curved planar reformations, which allow straightening
of curved structures such as a scoliotic spine (Fig. 3.9) (11,12). 3D surface and volume rendering are used to display anatomic relations, which are sometimes essential for surgical planning (Figs. 3-9 and 3-10).
 |
|
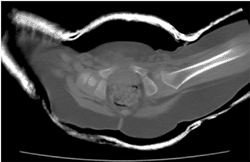
Figure 3.7
Multidetector row computed tomography (MDCT) was used to follow up a patient with left developmental dysplasia of the hip (DDH). The ossification center in the left femoral head is smaller than in the right; however, it is well reduced and well centered within the left acetabulum. |
for radiation safety considerations because they are the most
susceptible to radiation effects. Radiation risk is severalfold higher
in infants and children than in adults, and therefore imaging protocol
adjustments, or even other imaging modalities that do not include
ionizing radiation, should be considered whenever possible (1).
-
Limit exposures to those parts of the body that are absolutely essential for the diagnosis. This is known as the ALARA principle (as low as reasonably achievable).
-
Eliminate repeated exposures resulting from technical errors.
-
Limit precise collimation to the region of interest.
-
Limit fluoroscopy to short bursts as
needed. Time all fluoroscopy procedures, and record fluoroscopy time,
and kilovoltage and milliampere-seconds used. -
During fluoroscopy, use last image hold and electronic collimation features.
-
Adjust CT imaging parameters to the size
of the patient when infants and children are imaged. CT, especially
MDCT, is the single largest source of diagnostic radiation.
infants and children. The high ratio of cartilage to bone in a child’s
skeleton makes ultrasonography a more suitable assessment tool than
radiography or CT. With the increasing awareness of the deleterious
effects of radiation on the growing child, ultrasonography has become a
valuable tool. Other advantages of ultrasonography include the ability
to perform real-time imaging and the lack of need
for sedation, as well as portable imaging, multiplanar capability, and relatively low cost.
 |
|
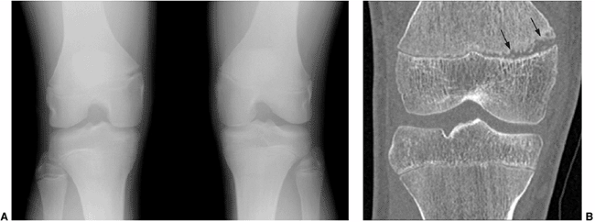
Figure 3.8
Multidetector row computed tomography (MDCT) used for studying a stress epiphyseal fracture in a 14-year-old boy who is an athlete. Patient presented with pain on medial aspect of the right knee. A: Anteroposterior view of both knees shows widening of the epiphyseal plate in the distal right femur. B: Coronal reformatted CT image illustrating the extent of the abnormality (arrows) that involves only the medial half of epiphyseal plate. |
Diagnostic sonography typically operates at frequencies between 1 and
20 MHz. The average velocity of sound in soft tissues is 1540 m per
sec, being higher in tissues with higher density, such as bone, and
lower in tissues of lower density, such as fat. As the sound waves
travel through tissues, they become attenuated because of reflection,
refraction, absorption, and scattering. The reflected component gives
the echo, which forms the image. The brightness of the image is
directly proportional to the echo strength and produces what is called
the gray-scale image. The amount of
reflection that occurs at the interface between two tissues is directly
proportional to the difference in their acoustic impedance (acoustic
impedance = tissue density × speed of sound in that tissue). An
interface that reflects most of the sound beam, such as bone, is termed
highly echogenic and appears bright on the
display screen. In contrast, sound-transmitting structures, such as
cysts, do not reflect the sound waves and appear dark or anechoic.
Skeletal muscle is hypoechoic compared to adjacent fat and bone. The
perimysial septae, which separate the primary fascicles of the muscle,
appear as parallel echogenic lines against the hypoechoic background of
the muscle on longitudinal scans. Normal tendons are echogenic and
exhibit a fibrillar echotexture, corresponding to the interfaces
between the densely packed collagen bundles and the surrounding septa.
The display of the fibrillar echotexture requires that the ultrasound
beam be perpendicular to the axis of the tendon (14).
If the ultrasound beam is oblique to the tendon, false hypoechogenicity
is produced, which may mimic a tear. Nonossified cartilaginous
epiphyses appear hypoechoic relative to the adjacent soft tissues, and
usually contain fine-speckled echoes. Ossification centers within
cartilage appear hyperechoic. Articular cartilage appears as a smooth,
anechoic, 1 to 2 mm thick layer.
sound waves hit a moving particle, the reflected sound undergoes a
frequency change (Doppler shift), which is directly proportional to the
velocity of the moving object. In color Doppler imaging, the frequency
change or velocity is depicted in different shades (higher frequencies
being assigned lighter colors), whereas the direction, according to
convention, is denoted in red for flow toward the transducer and in
blue for flow away from the transducer. Power Doppler sonography is
more sensitive to slow flow but lacks directional information.
Particularly in the first 6 months of life, when the femoral head and
acetabulum are composed mainly of cartilage, sonography offers many
advantages over other imaging techniques. Ultrasonographic evaluation
of
the
hip in infants is performed with a linear-array transducer. In small
children, up to 3 months of age, a 7.5-MHz transducer is used. In older
children, a lower-frequency transducer (i.e., 5 MHz) is used, so as to
achieve adequate penetration.
 |
|
Figure 3.9
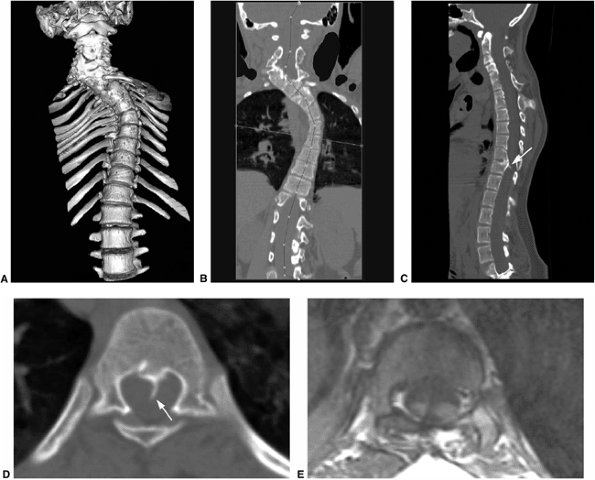
Multidetector row computed tomography (MDCT) used for the evaluation of a 12-year-old patient with congenital scoliosis and diastematomyelia. A: 3D image demonstrating severe cervical and thoracic scoliosis caused by congenital segmentation anomalies. B: Coronal reformatted image used in planning the curved planar reformation in order to straighten the spine. C: Curved planar reformation in the sagittal plane shows the segmentation anomalies in the cervical and thoracic spine. At the level of T12 a spike of bone (arrow) is seen arising from the posterior body of T12; this represents diastematomyelia. D: Axial section through T12 shows the bony spike (arrow) to better advantage. E: T1-magnetic resonance image (MRI) through T12 demonstrates the bony spike splitting the spinal cord into two. |
detect cases that are missed clinically, the drawbacks of universal
screening include cost, the potential for overtreatment, and
complications such as avascular necrosis of the femoral head. In the
United States, sonography is recommended for neonates in whom the
physical examination of the hip is abnormal or equivocal and for
infants with risk factors for DDH. These risk factors include a
positive family history, oligohydramnios, breech birth position, and
conditions that can be caused by uterine crowding such as clubfoot and
torticollis (16). Screening sonography for DDH
is optimally performed when the infant is 4 to 6 weeks old. This
approach reduces the rate of false-positive cases, which may be seen in
the neonatal period.
the hip: the static Graf method, which emphasizes morphology, and the
dynamic Harcke technique, which emphasizes stability of the femoral
head (17,18). In the
static method, coronal plane imaging is performed with the infant in
the supine or decubitus position, and the hip is assessed qualitatively
and quantitatively (Fig. 3.11 A,B). The α angle represents the bony roof, and the β angle
represents the cartilaginous roof of the acetabulum. Dynamic assessment
of the hip subjects the hip to stress maneuvers to determine its
stability. With the infant relaxed, the examiner can assess for
ligamentous laxity and dislocatability by performing adduction with
gentle stress or, for positioning and relocatability, by performing
abduction (Fig. 3.12 A,B).
Ultrasonography can detect the ossific nucleus in the central portion
of the femoral head several weeks before it is visible
radiographically. Once a child with hip dysplasia has been placed in a
harness, sonography can
be
used to assess the relation of the femoral head to the acetabulum.
Color Doppler imaging can determine the adequacy of blood supply to the
femoral head and can identify patients at risk for avascular necrosis (19).
 |
|
Figure 3.10
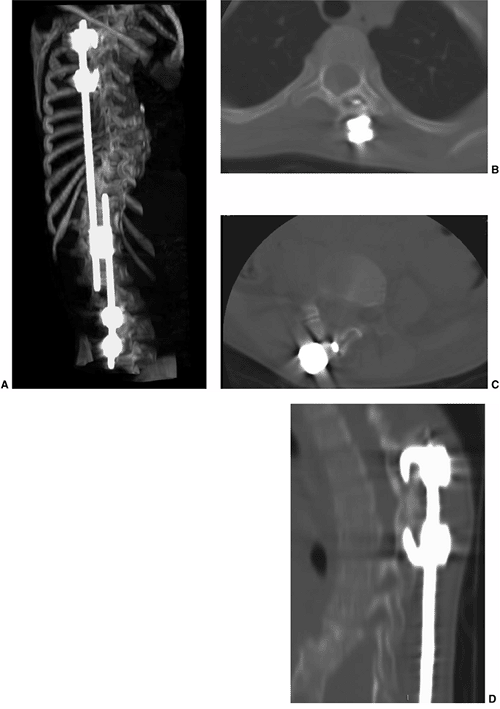
Multidetector row computed tomography (MDCT) for imaging complications caused by hardware in a 9-year-old child with juvenile scoliosis treated with expandable rods and sublaminar hooks. A: 3D image showing the hardware in place. B: Axial section through the thoracic spine demonstrates one of the hooks cutting through the bone in the lamina on the left. C: Axial section through a lumbar vertebra also demonstrates a hook cutting through the bone of the lamina. D: A sagittal reformatted image through the proximal hooks confirms the findings seen on the axial section. |
 |
|
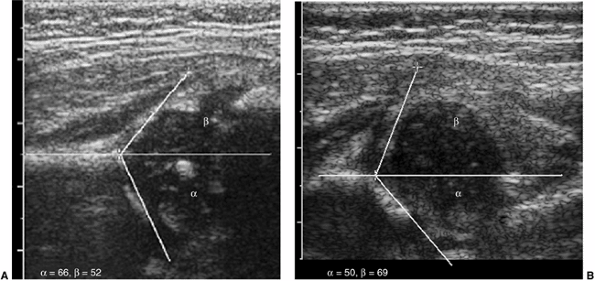
Figure 3.11 Static hip ultrasound. A: Coronal view of a normal hip shows good covering of the femoral head, with normal α and β angles. B:
Coronal view of a dysplastic acetabulum. The femoral head is uncovered laterally by the shallow acetabulum. The α angle is abnormal (50 degrees), and the labrum is lifted laterally, with an abnormal β angle. |
nonossified structures in congenital limb abnormalities. Proximal focal
femoral deficiency (PFFD) is characterized by a variable degree of
deficiency in the proximal femur. Because of its ability to identify
the cartilaginous femoral head and the unossified portion of the femur,
ultrasonography can be used for determining the severity of PFFD. It is
particularly useful for differentiating between type A and type B PFFD,
by demonstrating the presence or absence of a cartilaginous connection
between the femoral head and femoral shaft.
 |
|
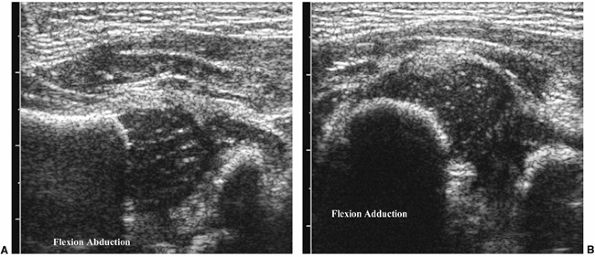
Figure 3.12 Dynamic hip ultrasound. A: In abduction, the femoral head is normally positioned with respect to the acetabulum. B:
In adduction, the femoral head is situated along the posterolateral aspect of the ischium, at the posterior margin of the acetabulum, consistent with hip dysplasia. |
 |
|
Figure 3.13
Normal conus by ultrasonography. Sagittal view of the spine demonstrates the spindle-shaped conus, ending normally in the center of the thecal sac (arrow). The cauda equina has a normal appearance. No thickening of the filum or lipoma is noted. |
ruling out the presence of a tethered cord in a child born with a
sacral dimple or hairy patch, thereby avoiding an MRI that requires
sedation. In the first 6 months of life, the cartilaginous elements of
the posterior spinous processes permit sound waves to reach the spinal
canal, thereby enabling visualization of the cord. In the newborn, the
conus ends at the L2-3 level. Using ultrasonography, the position of
the conus, its appearance, and the surrounding nerve roots in the
thecal sac can be evaluated (Fig. 3.13).
Sonographic features of a tethered cord include low-lying conus,
dorsally displaced nerve roots (which may be adherent to a posterior
wall of the thecal sac), echogenic fat tissue in the thecal sac
distally, and lack of normal motion. A normal ultrasonography precludes
the need for further evaluation with MRI.
musculoskeletal (MSK) imaging is the evaluation of a painful hip.
Ultrasonography is a safe, noninvasive, and sensitive technique for the
detection of a joint effusion. Evaluation for hip effusion is performed
in the parasagittal plane because the fluid accumulates anterior to the
femoral neck (Fig. 3.14 A,B). The asymptomatic, contralateral side offers an excellent comparison. As little as 1 mL of fluid can be detected (20,21);
however, the appearance of fluid in the sonograph is nonspecific and
cannot always characterize the etiology of the effusion (22).
Although the detection of increased blood flow on Doppler evaluation
suggests septic arthritis, a normal Doppler result does not exclude the
possibility of infection. Once the presence of fluid is detected,
sonography can be used to guide percutaneous aspiration, in order to
distinguish between toxic synovitis and a septic joint.
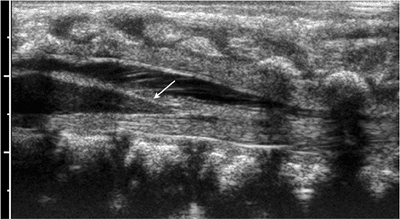
osteomyelitis in children. The sonograph may show elevation of the
periosteum with pus, which appears as a hypoechoic layer of fluid
contiguous with bone. Color Doppler can show increased blood flow in
and around the infected periosteum in cases of acute osteomyelitis (23).
Soft-tissue abscesses appear as hypoechoic or anechoic lesions and are
indistinguishable from a hematoma, sonographically. Ultrasonography can
be used for real-time guidance to aspirate fluid collections and
isolate the causative organism.
evaluation of a possible foreign body (FB), especially when the FB is
small and radiolucent, like a wood splinter. Wood produces posterior
acoustic shadowing, whereas metal and glass demonstrate posterior
reverberation artifacts. Sensitivity above 95% has been reported for
detection of foreign bodies by ultrasonography (24).
idiopathic arthritis (JIA), ultrasonography can be used for monitoring
the inflammatory process by quantifying synovial thickening,
suprapatellar effusion, and cartilage thickness (25,26).
delineating the extent of soft-tissue masses, ultrasonography is a
simple, noninvasive modality that can be used to evaluate suspected
soft-tissue lesions and to differentiate between cystic and solid
masses (Fig. 3.15). Sonographic evaluation of a
soft-tissue mass is best performed with a high-resolution linear-array
transducer. When evaluating a mass, the use of an acoustic standoff pad
helps to improve visualization of superficial lesions. When soft-tissue
tumors have a nonspecific sonographic appearance, ultrasonography can
be used to localize the mass and to provide guidance for needle biopsy (Fig. 3.16).
Ultrasonography can diagnose soft-tissue masses that have typical
imaging features, such as cysts, fibromatosis coli, lymphangiomas,
lymphadenopathy with abscess formation, and vascular malformations (Fig. 3.17). Glasier et al. found high-resolution
ultrasonography to be diagnostically specific in 40% of patients with soft-tissue masses (27).
 |
|
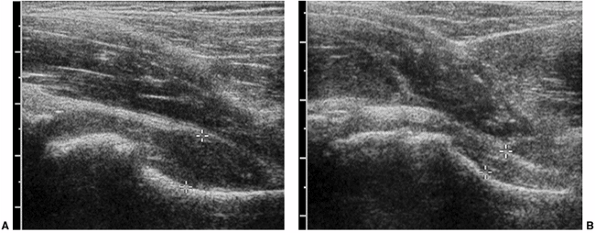
Figure 3.14 Three-year-old child with hip pain. A:
Longitudinal evaluation of the symptomatic hip from an anterior parasagittal approach demonstrates capsular distension with anterior bulging of the joint capsule. B: The contralateral normal side shows concave configuration of the capsule. |
of pediatric musculoskeletal disease. The absence of ionizing
radiation, the multiplanar imaging capabilities, the excellent spatial
and contrast resolution, and the ability to image vascular structures
without the need for intravenous
contrast make MRI ideal for the evaluation of pediatric musculoskeletal abnormalities.
 |
|
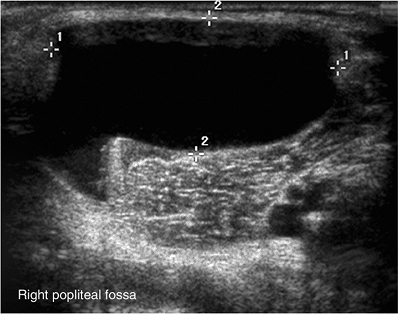
Figure 3.15
Five-year-old child with a popliteal mass. Ultrasound shows an anechoic lesion, with a tail extending toward the joint. Findings are consistent with a popliteal cyst. |
 |
|
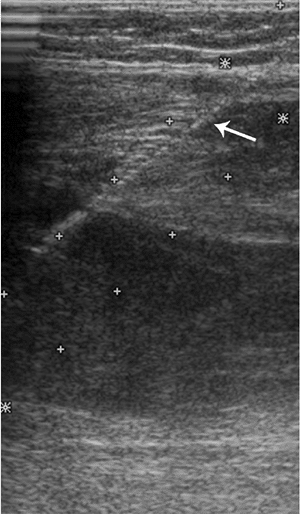
Figure 3.16 Ultrasound used for providing real-time guidance for biopsy of soft-tissue masses (arrow points to course of needle). Fine-needle aspiration of this mass confirmed diagnosis of recurrent osteosarcoma.
|
 |
|
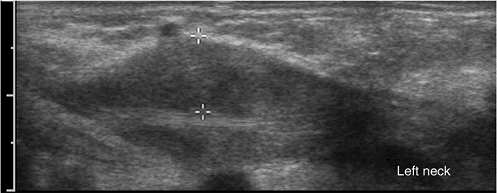
Figure 3.17
36-day-old infant with left neck mass. Longitudinal scan of the left side of the neck demonstrates fusiform enlargement of the sternocleidomastoid muscle, consistent with fibromatosis coli. |
of free protons in the tissue, the pulse sequences applied, and the use
of contrast agents (28). The hydrogen nucleus
is the most commonly imaged nucleus in clinical MRI because of its
abundance in biological tissues and its favorable magnetic properties.
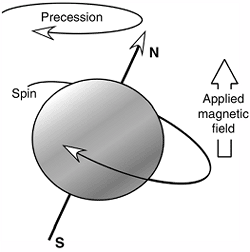
The spinning protons act like small magnets that, when placed in an
external magnetic field, align themselves parallel with the field (Fig. 3.18).
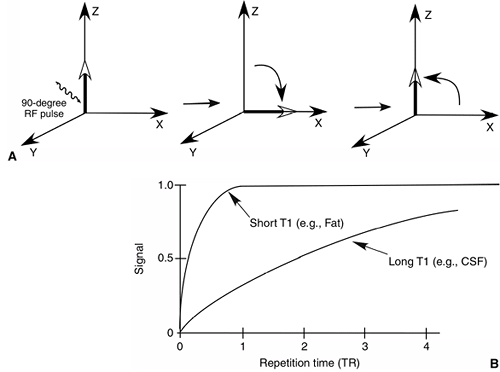
In conventional spin-echo imaging, a radio frequency (RF) pulse is
applied, which causes the protons to flip by 90 degrees. When the RF
pulse is removed, the protons realign themselves parallel with the
external magnetic field. The rate at which the protons realign with the
external magnetic field is called T1 relaxation (Fig. 3.19 A,B).
This is a tissue-specific time constant. The time required for 63% of
the deflected nuclei to realign with the external magnetic field after
the termination of the 90-degree RF pulse is the T1 relaxation time of
that tissue. The T1 relaxation time of fat is shorter than that of
water; so, on T1-weighted images, fat has high signal intensity,
whereas water has relatively low signal intensity. T1-weighted images
are excellent for depicting anatomic detail (Table 3.1).
 |
|
Figure 3.18
The spinning proton acts like a small magnetic dipole. When placed in a magnetic field, it aligns itself parallel with the external magnetic field and precesses about the applied field. |
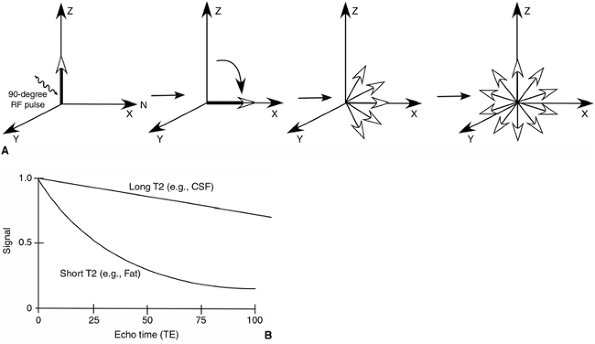
magnetization in the transverse plane. Immediately following the
90-degree RF pulse, all the deflected nuclei that lie in the transverse
plane spin in phase; however, soon thereafter, because of interactions
with neighboring nuclei, they slip out of phase. As a result,
transverse magnetization decreases, and this is called T2 relaxation or decay. T2 decay is faster for fat than for water, and therefore, water has a higher signal than fat on T2-weighted images (Fig. 3.20).
Most lesions have high signal intensity on T2-weighted images, and
therefore, T2-weighted images are better suited for the evaluation of
pathology (Table 3.1). Lesions that have a low
T2 signal are relatively few and include mineralized tissue, fibrosis,
blood products (e.g., hemosiderin), and high concentrations of
gadolinium.
between a lesion and adjacent tissues. This is especially true when
imaging bone marrow, where edema is much more conspicuous on
fat-suppressed T2 fast spin-echo (FSE) images. Fat suppression can be
achieved by applying a frequency-selective presaturation pulse, or by
using an inversion recovery sequence (short tau inversion recovery,
STIR). Uniform fat suppression is crucial in fat-suppressed spin-echo
T2-weighted images. Inversion recovery sequences, however, have less
signal-to-noise ratio than the fat-suppressed T2-weighted images (Table 3.1) (29).
evaluating ligaments and cartilage. 2D GRE images can be used for
depicting articular cartilage abnormalities. Isotropic 3D GRE
techniques allow the creation of high-resolution thin slices in any
arbitrary plane. The main disadvantage of GRE images is that they are
much more prone to magnetic susceptibility, which exaggerates metal
artifact. On the other hand, the advantage of magnetic susceptibility
is that GRE images are more sensitive in detecting blood and blood
products, such as hemosiderin (Table 3.1 and Fig. 3.21).
 |
|
Figure 3.19 T1 relaxation time. A:
Sequence of events when a 90-degree RF pulse is applied. The magnetized proton tips 90 degrees from the axis of the external field. The tipped protons then start to relax or realign with the external magnetic field at a rate defined by the T1 relaxation time of the tissue. B: Tissues with short T1 relaxation times (e.g., fat) appear bright on T1-weighted images, as compared with tissues with long T1 relaxation times, such as cerebrospinal fluid (CSF). |
|
TABLE 3.1 PULSE SEQUENCES: CLINICAL APPLICATIONS
|
||||||||||||||||||||||||
|---|---|---|---|---|---|---|---|---|---|---|---|---|---|---|---|---|---|---|---|---|---|---|---|---|
|
||||||||||||||||||||||||
 |
|
Figure 3.20 T2 relaxation time. A:
After the application of the 90-degree RF pulse, the transverse magnetization decreases because of the interaction of the tipped protons with adjacent nuclei. This is called “T2 relaxation.” B: On a T2-weighted image, tissues with long T2 relaxation times (e.g., cerebrospinal fluid) produce bright signals. |
agents in MRI for contrast enhancement. Gd is a paramagnetic ion, which
shortens the T1 relaxation time of tissues, causing enhancing lesions
to appear bright on T1-weighted images. Gd is used intravenously for
evaluating infections, vascular lesions, neoplasms, and synovitis. The
recommended intravenous dose is 0.1 mmol per kg. Diluted Gd can also be
injected intraarticularly to obtain MR arthographic images.
abnormalities in the shoulder and the acetabulum, assessing the
stability of osteochondral lesions, delineating loose bodies, and
assessing the integrity of the overlying cartilage (Fig. 3.22). Direct MR
arthrography is accomplished by injecting dilute Gd into the joint
space. This can be performed on any joint in which conventional
arthrography can be performed. The intraarticular contrast distends the
joint and outlines abnormalities. MRI should be started within 30
minutes of injection of the contrast to minimize absorption of the
contrast and loss of capsular distension.
 |
|
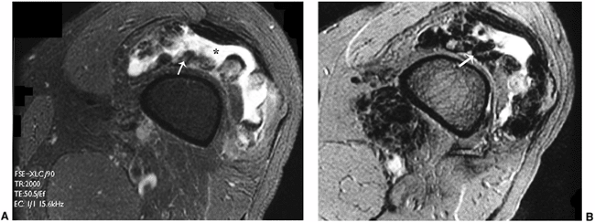
Figure 3.21 Pigmented villonodular synovitis (PVNS). A:
Axial T2-weighted image through the knee demonstrates fluid in the suprapatellar bursa (*) with a hypointense proliferated synovium (arrow). B: The hypointensity of the synovium is more pronounced on the gradient-echo image, secondary to magnetic susceptibility of hemosiderin (arrow). |
The signal characteristics of fatty marrow are similar to those of
subcutaneous fat because of its high lipid content. Hematopoietically
active marrow or red marrow has considerably lower signal intensity
than fatty marrow on T1-weighted images but approximates fatty marrow
on T2-weighted images. On T2-weighted and STIR sequences, the
hematopoietic marrow is usually isointense with muscle (Table 3.2).
Reduction of fat signal either by fat suppression or by STIR sequences
helps increase the conspicuity of marrow lesions, especially when using
FSE T2-weighted sequences.
 |
|
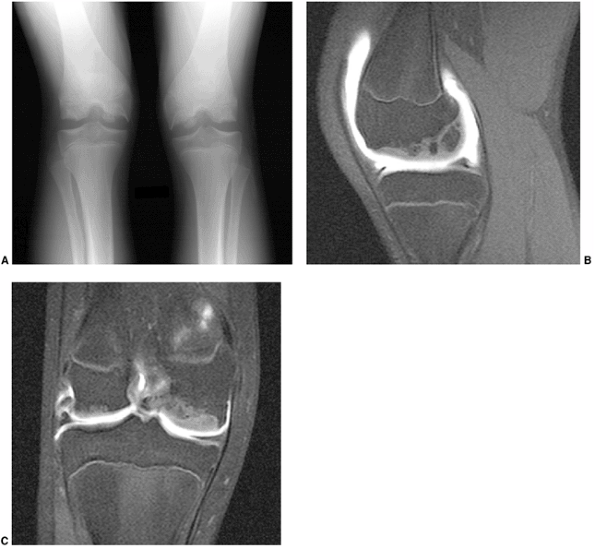
Figure 3.22 Magnetic resonance (MR) arthrography in a child with abnormal-looking epiphyses. A: Plain radiographs of both knees demonstrate marked irregularity of the epiphysis, and fragmentation. B: Sagittal image. C:
Coronal image. MR arthrogram images demonstrate that normal overlying cartilage is intact, suggesting a diagnosis of multiple ossification centers of the epiphysis. |
closely approximate those of hematopoietic marrow, knowledge of the
normal distribution pattern of hematopoietic marrow at different ages
becomes important (32). Marrow conversion from
hematopoietic marrow to fatty marrow progresses from the distal
appendicular skeleton proximally in the first two decades of life.
Marrow conversion in long bones starts in the diaphysis from distal to
proximal, next involves the distal metaphysis and, finally, the
proximal
metaphysis. The epiphyses demonstrate fatty marrow within 6 months of formation of the ossification center (33). Under stress, marrow can reconvert from fatty to red marrow; the reconversion progresses in the reverse order.
|
TABLE 3.2 TISSUE SIGNAL CHARACTERISTICS ON VARIOUS SEQUENCES
|
|||||||||||||||||||||||||||||||||||||||||||||||||
|---|---|---|---|---|---|---|---|---|---|---|---|---|---|---|---|---|---|---|---|---|---|---|---|---|---|---|---|---|---|---|---|---|---|---|---|---|---|---|---|---|---|---|---|---|---|---|---|---|---|
|
MRI can be used for identifying the cause of failed reduction, such as
infolding of the labrum or hypertrophy of the pulvinar. MRI can also be
performed to confirm adequate reduction after a spica cast has been
applied.
 |
|
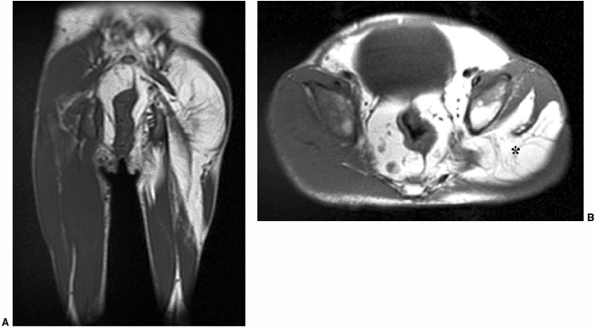
Figure 3.23 Proteus syndrome. Coronal (A) and axial (B)
T1-weighted images demonstrate asymmetric enlargement of the left thigh, caused by an excessive amount of fat (*) which extends into the pelvis in a young girl with proteus syndrome. |
In PFFD, MRI is used for assessing the acetabulum, the cartilaginous
femoral head, its connection to the shaft, and the status of the
musculature.
macrodystrophia lipomatosa, congenital fibromatosis, and proteus
syndrome are well evaluated with MRI (Fig. 3.23).
of the central nervous system (CNS). MRI is the definitive modality for
diagnosis, treatment planning, and follow-up of patients with tethered
cord. If a tethered cord is suspected, clinically or by
ultrasonography, MRI evaluation of the conus helps in identifying the
cause of tethering, such as a thickened filum or filar lipoma (Fig. 3.24).
Craniospinal imaging evaluates complications and sequelae of repair of
myelomeningocele and Chiari II malformations, such as hydrocephalus,
syrinx, scarring, and formation of epidermoid/dermoid at the site of
the original repair.
the craniospinal axis is performed to evaluate for Chiari I
malformation, diastematomyelia, and hydrosyringomyelia. If a syrinx is
detected, postcontrast images are imperative in order to exclude an
underlying cord tumor.
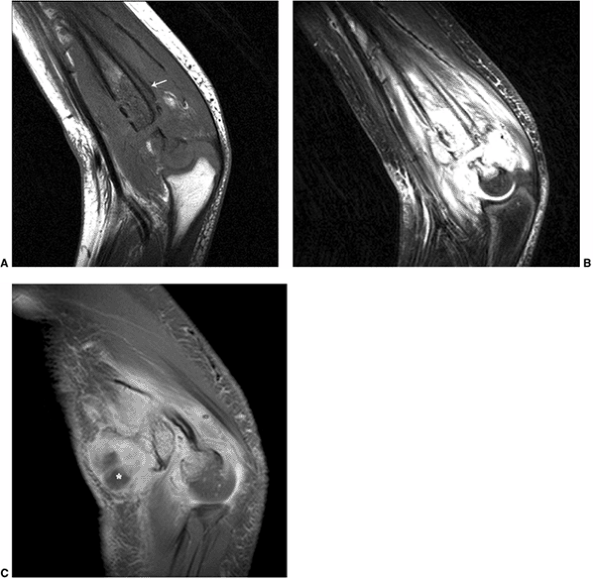
osteomyelitis in children. MRI has been shown to be 88% to 100%
sensitive in the diagnosis of osteomyelitis, and 75% to 100% specific (38,39,40).
T1-weighted images help delineate the extent of involvement of the
marrow, as well as extension into the growth plate and epiphysis. A
T2-weighted FSE sequence with fat suppression or a STIR sequence can
clearly depict the extent of the infection in the marrow and soft
tissues. As the infection spreads up and down the marrow space, it can
penetrate the cortex, elevate the periosteum, and then break into the
soft tissues. MRI can demonstrate accompanying cellulitis, myositis,
sinus tracts, phlegmon, and abscess formation. Post-Gd images are key
for the evaluation of devitalized tissues and abscess formation that
requires surgical intervention (41,42,43).
An abscess appears as a peripherally enhancing lesion on post-Gd,
fat-suppressed, T1-weighted images with a central hypointense fluid
collection that represents pus (Fig. 3.25).
 |
|
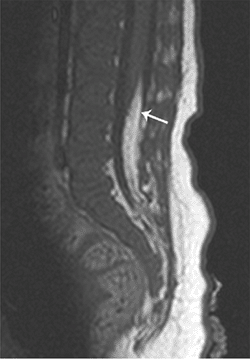
Figure 3.24
Tethered cord. Sagittal T1-weighted image of a child born with a sacral hairy patch demonstrates a tethered cord, ending at the L3 level, with an associated lipoma of the filum (arrow). |
It can detect early synovial inflammation and subtle cartilage
destruction, whereas radiography is able to show only late
manifestations of inflammatory arthritis, such as osteoporosis,
epiphyseal enlargement, bony erosions, subchondral cysts, and deformity
of the joint surface. Imaging of arthritis requires sequences that
depict the synovium (T2-weighted and Gd-enhanced T1-weighted sequences)
and articular cartilage (proton density and fat-suppressed
spoiled-gradient echo sequences). Inflamed synovium demonstrates low to
intermediate signal intensity on T1-weighted images, high signal
intensity on T2-weighted images, and intense enhancement on
post-contrast images. The post-Gd images should be obtained within 5
minutes of intravenous contrast administration, otherwise the contrast
can diffuse into the joint space, leading to overestimation of synovial
thickness (46). Cartilage demonstrates high
signal intensity on proton density, T2-weighted, and gradient-echo
images. MRI can also be used for assessing thinning, erosion, and loss
of cartilage (47).
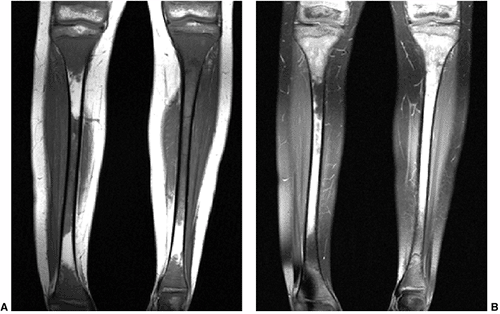
malignancies in children that can cause marrow replacement. Marrow
replacement with neoplasm can be diffuse or focal. When the involvement
is focal, metastatic deposits have well-circumscribed margins, and
differentiation from the surrounding normal marrow is easier than when
marrow infiltration is diffuse (Fig. 3.26). The
metastatic foci will be hyperintense, compared with muscle on STIR or
fat-suppressed T2-weighted images, and will demonstrate enhancement on
the T1-weighted post-Gd images. In diffuse metastatic replacement, the
abnormal signal intensity is more extensive and may be more difficult
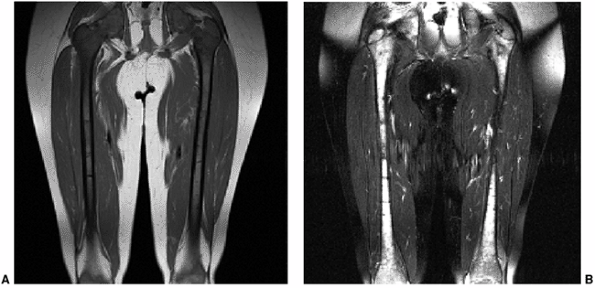
to separate from normal hematopoietic marrow (Fig. 3.27).
Loss of fatty marrow signal from the epiphysis gives a good indication
of marrow replacement by tumor. Hematopoietic marrow is usually
isointense to muscle on T2-weighted images. However, this may not be
true if the patient is receiving granulocyte colony-stimulating factor
(GCSF).
Out-of-phase gradient-echo images have been used to differentiate
between metastases and hematopoietic marrow; the latter loses signal on
out-of-phase sequence, whereas metastases remain bright (48).
 |
|
Figure 3.25 Osteomyelitis demonstrated by magnetic resonance imaging (MRI). Sagittal (A) T1- and (B)
T2-weighted images demonstrate loss of normal marrow signal in the distal humeral shaft, with associated infiltration of the surrounding soft tissues and periosteal elevation (arrow), secondary to osteomyelitis. C: Post-gadolinium (Gd) fat-suppressed T1-weighted image demonstrates a peripherally enhancing fluid pocket in the ventral aspect, consistent with an abscess (*) |
In cases of suspected soft-tissue masses, MRI has a 100% negative
predictive value. Its ability to histologically characterize the mass
remains limited. Features that favor benignity include lesion diameters
of less than 3 cm, well-delineated margins, homogeneous signal, lack of
peritumoral edema, and absence of neurovascular encasement (51).
There are, however, considerable overlaps in the MRI appearances of
benign and malignant soft-tissue masses, and a correct histologic
diagnosis can be reached in only 25% to 35% of cases (51,52,53).
Soft-tissue lesions, such as lipomas, hemangiomas, lymphangiomas, and
cysts, produce characteristic MRI images, thereby obviating the need
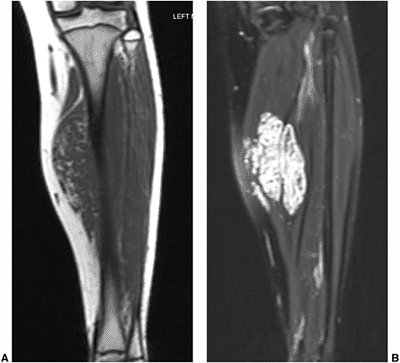
for a biopsy (54) (Fig. 3.28).
reliable method for predicting the histologic nature of bone lesions,
MRI plays an essential role in detection, staging, treatment planning,
and posttherapy follow-up. MRI is the most accurate modality for
staging bone tumors (55,56,57,58). The intraosseous and extraosseous extent of the tumor can be accurately staged using MRI (Fig. 3.29).
Intramedullary extent, cortical involvement, epiphyseal and joint-space
invasion, and evaluation of skip lesions can be easily studied
with
MRI. MRI is superior to CT in assessing soft-tissue involvement and the
relation of the tumor to adjacent neurovascular bundles (57).
 |
|
Figure 3.26 Metastatic neuroblastoma. A: Coronal T1-weighted image of both tibias demonstrates extensive areas of loss of normal fat signal of the marrow. B:
The corresponding fat-suppressed T2-weighted fast spin-echo (FSE) image demonstrates abnormal hyperintensity in the areas of marrow replacement in this child with metastatic neuroblastomas. |
 |
|
Figure 3.27 Diffuse marrow replacement with metastatic neuroblastoma. A:
Coronal T1-weighted image of both femurs demonstrates diffuse loss of normal T1 hyperintensity of fatty marrow. Note that the epiphyses also demonstrate replacement of the fatty marrow. B: The marrow infiltration, caused by metastatic neuroblastoma, appears diffusely hyperintense on the fat-suppressed T2-weighted fast spin-echo (FSE) image. |
 |
|
Figure 3.28 Intramuscular hemangioma. Coronal T1-(A) and fat-suppressed T2-(B)
weighted images demonstrate a T1 hypointense and T1 hyperintense intramuscular lesion, involving the medial aspect of the hamstring muscles. The signal intensity of the lesion is typical for a hemangioma. |
 |
|
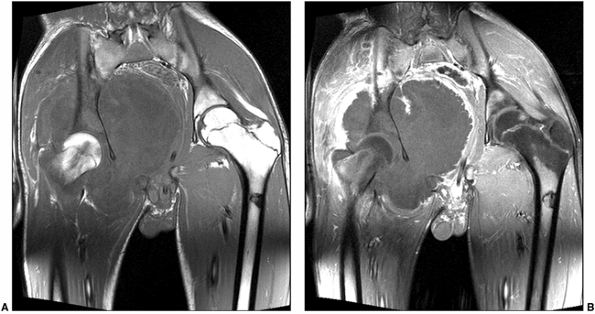
Figure 3.29 Osteosarcoma studied with magnetic resonance imaging (MRI). A:
Coronal T1-weighted image demonstrates a T1 hypointense mass in the right hemipelvis. There is loss of normal marrow signal in the right acetabulum and iliac bone. B: Post-contrast fat-suppressed T1-weighted image demonstrates peripheral enhancement, suggesting that central parts of the tumor are mostly necrotic. Biopsy revealed a chondroblastic osteosarcoma. |
 |
|
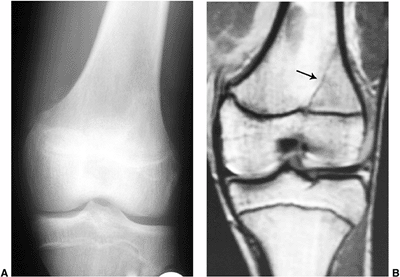
Figure 3.30 Occult fracture in a 16-year-old soccer player who presented with knee pain. A: The radiograph was interpreted as normal. B: Coronal T1-weighted image demonstrates a linear hypointensity (arrow)
along the lateral aspect of the tibial metaphysis, extending to the physis, consistent with a radiographically occult fracture. |
Gd–diethylenetriamine pentaacetic acid (DTPA) can help differentiate
between viable and necrotic portions of a tumor (59).
Viable components show enhancement on the postcontrast images, whereas
necrotic parts fail to enhance on MRI, thereby identifying viable
tumors for biopsy. MRI also plays a crucial role in monitoring bone
tumors after preoperative chemotherapy and radiation. Tumor response
can be assessed through estimation of changes in volume, signal
intensity, and enhancement pattern (60).
MRI can help determine the extent of injury in fractures of the lateral
condyle of the elbow, which could otherwise be misdiagnosed as a
complete separation of the distal humeral epiphysis (Fig. 3.31).
 |
|
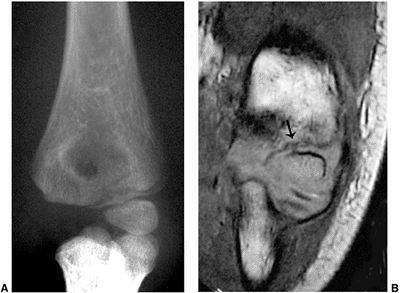
Figure 3.31 Lateral condyle fracture. A: Plain radiograph of the elbow demonstrates a fracture of the lateral condyle. B:
The true extent of the fracture line through the unossified epiphysis is demonstrated on the coronal T1-weighted magnetic resonance image (MRI) (arrow). |
before surgery. Such abnormalities can result in bowing and limb length
discrepancy (Fig. 3.32).
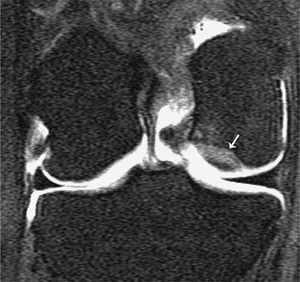
determine the status of the overlying cartilage and to assess whether
the osteochondral fragment is stable or not. The presence of Gd under
the fragment on MR arthrography suggests that the fragment is unstable.
MR arthrography has been shown to have an accuracy of 93%, compared
with an accuracy of 39% for conventional MRI (Fig. 3.33) (61).
performed for both diagnostic and therapeutic purposes. In spite of the
tremendous advances in imaging techniques, biopsy remains the ultimate
test for tissue characterization of musculoskeletal neoplasms and,
sometimes, infections. Radiologists are skilled in performing
percutaneous needle biopsies.
extensively for more than 70 years, and is a well-established
radiologic procedure. For accurate sampling of the tumor, guidance with
CT, ultrasonography, or fluoroscopy is almost always required. Whereas
fluoroscopy has the advantage of providing real-time guidance, CT can
better delineate small and deep skeletal lesions and associated
soft-tissue masses (Fig. 3.34). Needle biopsies have been shown to be cost effective (62).
In comparison with open biopsy, the advantages of percutaneous biopsy
include safety, low morbidity, and low cost. Although percutaneous
biopsies can be performed under local anesthesia, either sedation or
general anesthesia may be required in children.
 |
|
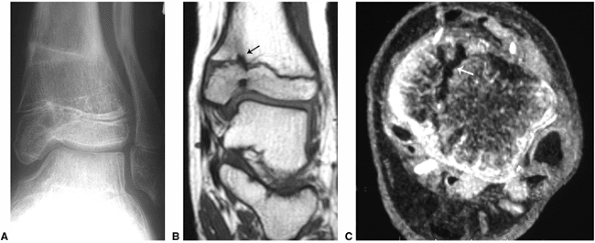
Figure 3.32 Mapping of an epiphyseal bar using magnetic resonance imaging (MRI). A:
Plain radiograph demonstrates healing fractures of the distal tibia and fibula, with angular deformity and evidence of bony bridging in the medial aspect of the tibial physis. B: Coronal T1-weighted and (C) axial gradient-echo images demonstrate the bony bridge (arrows), extending across the medial aspect of the tibial physis. |
of a false-negative result because the accuracy of a negative result
can be established only with follow-up or open biopsy.
simple, safe, and less invasive than open surgery. Treatment of UBCs
with methylprednisolone acetate was first proposed by Scaglietti et al.
in 1979 (65). Campanacci et al. demonstrated
comparable end results in UBCs that were treated with curettage and
bone grafting to those that were treated with cortisone injection (66).
using an 18- or 20-gauge spinal needle. Once the needle is inserted, a
clear yellow or slightly bloody fluid is aspirated. Radiographic
contrast is then injected into the cyst to evaluate for internal
loculations (Fig. 3.35). Methylprednisolone acetate (Depo-Medrol) is the most
commonly used steroid. Repeated injections are often necessary to
achieve complete healing of the cyst. Factors influencing the rate of
healing include age of the patient and the location, size, and degree
of loculation of the cyst (67).
Radiographic changes associated with healing, in the form of cortical
thickening and increased opacity of the cyst cavity, are usually seen
within 2 to 3 months after the injection (68).
 |
|
Figure 3.33
Stable osteochondral fragment. Coronal T1-weighted magnetic resonance (MR) arthrogram demonstrates an osteochondral defect on the lateral aspect of the medial femoral epicondyle (arrow). No intravasation is identified under the osteochondral defect, suggesting that it is stable. |
treatment of osteoid osteoma have been developed. These techniques
include percutaneous excision (with or without instillation of ethanol)
and in situ ablation of osteoid osteoma,
using laser photocoagulation or RF ablation. The imaging and clinical
findings should be highly suggestive of an osteoid osteoma if local
ablation is being contemplated because histologic diagnosis is not
possible by local ablation. Because RF ablation/laser photocoagulation
can cause local thermal injury, there should be no vital structures
within 1 cm of the lesion. This is why most operators do not perform
this procedure in the hand or in the posterior elements of the spine.
The success rate of RF ablation of osteoid osteomas has been reported
at 91% and 67% by Torriani and Rosenthal, respectively (69).
 |
|
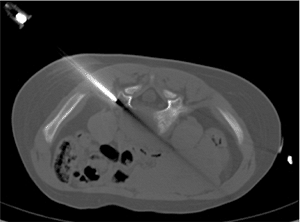
Figure 3.34
Transpedicular needle biopsy. Computed tomagraphy (CT)–guided biopsy of a lytic lesion, involving the L5 vertebral body using a transpedicular approach, revealed a diagnosis of Langerhans cell histocytosis. |
possibility of performing this procedure on an outpatient basis and the
fact that patients can resume all activities of daily living
immediately after the procedure. Torriani and Rosenthal reported that
the expense incurred with percutaneous RF ablation is only 25% of open
surgery (69).
 |
|
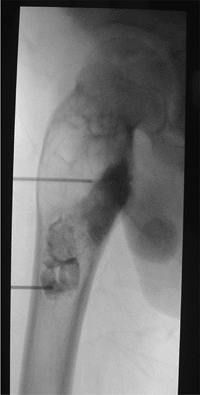
Figure 3.35
Treating a unicameral bone cyst with intracavitary steroid injection. After aspiration of the cyst, contrast is injected to confirm its unicameral nature, followed by the injection of steroid. |
(methyl diphosphonate), Tc 99m HEDP (1-hydroxyethylidene
diphosphonate)] are the most commonly used radiopharmaceuticals in
radionuclide imaging of skeletal disease. After intravenous injection,
approximately 50% of the injected dose of Tc 99m MDP localizes in the
bone within 24 hours. When Tc 99m decays (half-life 6 hours), γ rays
are emitted and are detected by a gamma camera to produce an image of
the distribution of the radiopharmaceutical. Tc 99m–labeled
phosphonates accumulate preferentially in the mineral phase of newly
forming bone. Therefore, areas of increased bone remodeling, caused by
infection, trauma, or tumor, will appear “hot” on a bone scintigraphy
compared to normal bone. After injecting the radiopharmaceutical,
images of the entire skeleton are obtained at 2 to 4 hours. Blood flow
and blood pool images may also be obtained immediately after the
administration of the radiopharmaceutical (three-phase bone scan) in
order to evaluate blood flow and assess the presence of hyperemia in
the area of concern. Sedation is usually not necessary for imaging, and
technically adequate images are usually obtained with moderate
restraint on the patient.
scintigraphy in infants and children include: (a) diagnosis of
osteomyelitis, (b) evaluation of avascular necrosis of the femoral head
[Legg-Calvé-Perthes (LCP) disease], (c) evaluation of metastatic bone
disease, and (d) trauma, including child abuse, stress fractures, and
spondylolysis.
with 50% of the cases occurring in children by 5 years of age. Most of
the cases result from hematogenous seeding of organisms, which explains
the preferred metaphyseal location in long bones—a location that is
rich in blood vessels but has a relatively sluggish blood flow, thereby
providing a favorable environment for growth of microorganisms. In
newborns and infants, the infection can easily spread to the
neighboring joint space through the transphyseal vessels, causing
abnormal growth and significant joint deformities. After 18 months of
age, the transphyseal vessels obliterate, and infection may spread
under the periosteum along the diaphysis. Although clinical examination
and laboratory markers of inflammation are helpful, radiologic
diagnosis is necessary to establish osseous involvement of infection.
Routine x-rays are insensitive to the diagnosis of osteomyelitis in the
early phase; bone scintigraphy becomes positive approximately 2 weeks
before routine radiographs do. The most commonly used imaging
modalities for diagnosing osteomyelitis in children are bone
scintigraphy and MRI.
 |
|
Figure 3.36 Bone scan of a 6-year-old patient with suspected osteomyelitis. Abnormal uptake of the radiotracer (arrows) is seen in the left femoral greater trochanter on blood pool (left) and delayed bone scan (right)
images. Also note the normal activity in the growth plates and in kidneys and bladder, the excretion route of the radiopharmaceutical. |
evaluation of osteomyelitis. A positive result of the study shows a
focal area of increased uptake on all three phases, reflecting
increased blood flow, hyperemia, and increased bone remodeling in the
area of osteomyelitis (Fig. 3.36). Whole-body
imaging is particularly important in neonatal osteomyelitis and
suspected gonococcal osteomyelitis because these infections may be
frequently multifocal. In neonatal osteomyelitis, the bone scan may
demonstrate decreased uptake (cold lesions) because of the highly
destructive nature of the disease. Bone scans become positive within 24
to 72 hours after the initial clinical presentation and have a
sensitivity and specificity of approximately 90%, which is comparable
to the rates for MRI (70). The modality of
choice also depends on the clinical presentation and on the local
expertise available. Radionuclide bone scan is ideal when symptoms are
poorly localized or multifocal osteomyelitis is suspected. Bone scan is
also highly effective in the diagnosis of osteomyelitis of the long
bones (71). MRI is the preferred modality for
vertebral and pelvic osteomyelitis because of the frequent presence of
soft-tissue abscesses along with these infections, requiring drainage
as part of the treatment. Bone scan may also be helpful in the
diagnosis of
septic
arthritis, if ultrasonography and aspiration of the joint are
inconclusive. Increased blood flow, hyperemia, and markedly increased
uptake in the subchondral bone on both sides of joints are the typical
findings from bone scans in septic arthritis.
head that primarily affects children between 4 and 8 years of age.
Limping and pain in the hip and thigh are the most common symptoms. In
approximately 50% of patients, the disease may result in severe osseous
destruction and arthritis if not corrected surgically at an early
stage. In the initial stage of the disease, bone scintigraphy will show
decreased uptake, reflecting decreased blood flow. Pinhole collimation
with magnification is necessary for accurate diagnosis in many
patients. The sensitivity of bone scintigraphy for diagnosis of LCP
disease is greater than 90% and precedes radiographic diagnosis by an
average of 6 weeks (72). After an average of 4
to 5 months, bone scans may show a column of increased uptake
laterally, representing reperfusion. This is associated with a good
prognosis, whereas persistent photopenia or hyperactivity of the
metaphysis usually represents a more aggressive disease course (73).
The sensitivity rates of MRI and bone scintigraphy appear to be similar
for diagnosis of LCP and for assessment of prognosis (70,74).
solid tumor in childhood and comprises about 8% to 10% of all pediatric
cancers. Neuroblastomas occur mainly in young children, with
approximately 75% occurring in children aged 4 years or younger, and
approximately 50% in children younger than 2 years. These
neuroblastomas arise from neural-crest–derived cells in the adrenal
medulla or the sympathetic nervous chain. The presence of cortical bone
involvement indicates advanced stage IV disease with a 5-year survival
rate of only 30% to 40%. Bone scintigraphy is highly accurate in the
detection of metastatic disease of the cortical bone and is also
complementary to the specific neuroendocrine tumor imaging marker of
metaiodobenzylguanidine (MIBG) (75). On bone
scan, metastases appear as symmetric or asymmetric foci of increased
uptake, primarily in metaphyseal long bones, but also in the vertebrae,
ribs, and skull (Fig. 3.37). Metaphyseal
lesions close to the physis may be difficult to detect, and careful
evaluation with close-up views is important in order to detect subtle
abnormalities. Occasionally metastases may appear “cold,” with highly
destructive lesions (76).
 |
|
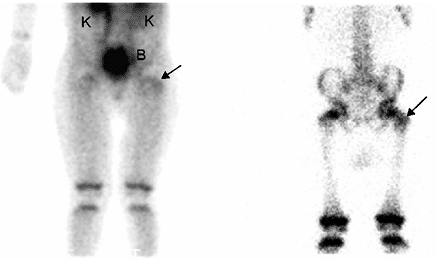
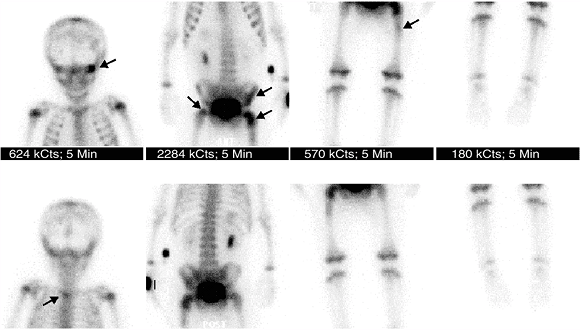
Figure 3.37
Whole-body bone scan for evaluation of metastatic bone disease in a patient with neuroblastoma. Multiple lesions of increased uptake are easily recognized (arrows) in the left orbit, upper thoracic spine, left ileum, and bilateral proximal femurs. |
children and adolescents, with most cases occurring between the ages of
10 and 17 years. Osteosarcomas primarily involve the metaphyseal
portions of the long bones and typically appear as areas of markedly
increased uptake on the bone scan. The area of increased uptake is
usually larger than the extent of the tumor because of the peritumoral
reactive changes. Therefore bone scans cannot be used to assess the
extent of the tumor; however, they are useful in evaluating skip
lesions and metastatic disease. Although metastatic bone disease is
rare at initial presentation, bone metastases are not infrequently seen
in patients receiving neoadjuvant chemotherapy, with 16% reported to
have osseous metastases before lung involvement (77).
 |
|
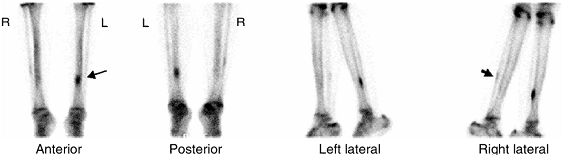
Figure 3.38 Bone scan of a patient with left shin pain. Markedly increased uptake of the radiopharmaceutical in the left tibia (arrow), consistent with stress fracture. Also note mild increased uptake in the right fibula (arrow), likely representing a healing old stress fracture.
|
There are usually multiple fractures, involving the long bones, ribs,
skull, vertebrae, and facial bones, usually showing different stages of
healing. Bone scintigraphy is a highly sensitive technique for
detecting osseous injuries and may be more sensitive than routine
radiographs in this clinical setting (79). Bone
scintigraphy, however, cannot replace radiographs in the evaluation of
child abuse because of its relatively limited sensitivity in detection
of skull fractures and metaphyseal fractures due to their close
proximity to epiphyses, which normally demonstrate high uptake (80).
Bone scintigraphy may also show false-negative results in healed
fractures. In a relatively recent study, 70% of injuries were detected
both by bone scintigraphy and x-rays, 20% only by scintigraphy, and 10%
only by x-ray images (80). Therefore a combination of x-ray and bone scintigraphy is suggested for optimal diagnosis of osseous injury in child abuse.
 |
|
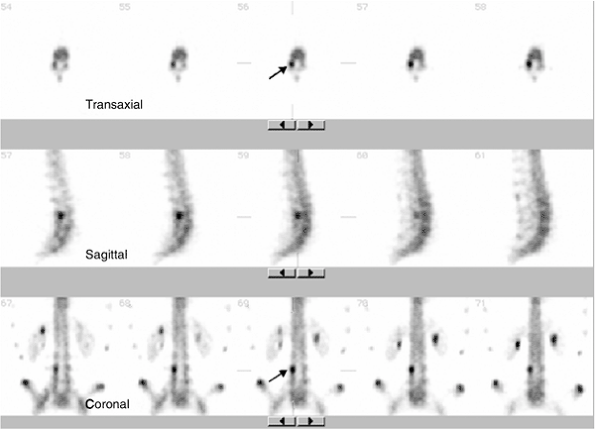
Figure 3.39
Single photon emission computed tomography (SPECT) bone scan of the lumbar spine for suspected pars fracture in a gymnast. Transaxial, sagittal, and coronal images demonstrate focal increased uptake in the right pars region of L4 (arrow), consistent with spondylolysis. |
in toddlers are the tibia, calcaneus, and cuboid. Bone scintigraphy is
almost always positive within 24 hours of the fracture and shows
increased uptake along the diaphysis of the tibia and focal increased
uptake in the small bones. In children with unexplained leg pain who
refuse to walk, and in whom plain x-rays are normal, bone scintigraphy
is recommended in order to rule out occult fractures. Stress fractures
of the tibia and fibula result from repetitive submaximal stress and
are most common in runners. These are uncommon in children under 10
years of age. The bone scan is positive at the time of presentation and
typically shows a fusiform pattern of increased uptake (Fig. 3.38).
Early stress fractures are usually not identified on plain radiographs
and advanced stress fractures may appear on the x-ray several weeks
after bone scintigraphy. Bone scintigraphy is also helpful in
differentiating stress fractures from shin splints. Shin splints is a term that refers to a periostitis near the insertion of the soleus, resulting
from recurring stress and usually requiring a shorter recovery period than stress fractures (81).
The typical presentation on the bone scan is a linear uptake along the
posteromedial aspect of the middle one third of the tibia involved.
interarticularis of a vertebra, most commonly at L4 or L5, and is
believed to represent a stress fracture. Spondylolysis is very rare
under 5 years and above 20 years of age and is most commonly seen in
patients between 7 and 18 years of age (82).
Spondylolysis may be asymptomatic and is often diagnosed as an
incidental finding in many patients, but may cause low back pain in
others. A positive bone scan in the pars region indicates spondylolysis
as the cause of low back pain and correlates with good outcome after
fusion surgery (83,84).
Tomographic images of bone scintigraphy [single photon emission
computed tomography (SPECT)] of the lumbar spine should always be
obtained, because more than 50% of active spondylolysis may not be
detected with routine planar bone scans (85) (Fig. 3.39).
Bone scans should be interpreted in correlation with radiographs and/or
CT, because other conditions such as osteoid osteoma, degenerative
changes, infections, and tumors may also show increased uptake on bone
scintigraphy.
HG, Dobbins JT III, Ravin CE. Principles of digital radiography with
large-area, electronically readable detectors: a review of the basics. Radiology 1999;210:595.
NM, Harcke HT, McHugh P, et al. Real-time ultrasound in the diagnosis
of congenital dislocation and dysplasia of the hip. J Bone Joint Surg [Br] 1985;67(B):406.
MS, Steinmetz ND, Trepman E. Detection of wooden foreign bodies in
muscle tissue: experimental comparison of computed tomography, magnetic
resonance imaging, and ultrasonography. Foot Ankle 1994;15:437.
M, Salti S, Trapani S, et al. Correlation between clinical and
ultrasound assessment of the knee in children with mono-articular or
pauci-articular juvenile rheumatoid arthritis. Pediatr Radiol 199;29:117.
JM, Ross G, Cummings J, et al. Usefulness of magnetic resonance imaging
in the diagnosis of acute musculoskeletal infections in children. J Pediatr Orthop 1995;15:144.
MI, Fanis SL, Xenakis T, et al. The role of MRI in the evaluation of
hip joint disease in clinical subtypes of juvenile idiopathic
arthritis. Br J Radiol 2002;75:229.
CS, Aliabadi P, Wright RJ, et al. Enhancement of joint fluid with
intravenously administered gadopentetate dimeglumine: technique,
rationale, and implications. Radiology 1993; 187:179.
M, McGuire MH, Herbold DR. Magnetic resonance imaging of soft tissue
masses: an evaluation of fifty-three histologically proven tumors. Magn Reson Imaging 1998;6:237.
TH, Ehman RL, King BF, et al. Value of MR imaging in differentiating
benign from malignant soft-tissue masses: study of 95 lesions. AJR 1990;155:1251.
JR, Seeger LL, Yao L, et al. Diagnosis of soft-tissue masses with MR
imaging: can benign masses be differentiated from malignant ones? Radiology 1992;185:581.
JT, Taminiau AH, Eulderink F, et al. Radiologic staging of primary bone
sarcoma: MR imaging, scintigraphy, angiography, and CT correlated with
pathologic examination. Radiology 1988;169:805.
TD, Manfrini M, Ruggieri P, et al. Staging of intraosseous extent of
osteosarcoma: correlation of preoperative CT and MR imaging with
pathologic macroslides. Radiology 1988;167:765.
R, Sciuk J, Bosse A, et al. Response of osteosarcoma and Ewing sarcoma
to preoperative chemotherapy: assessment with dynamic and static MR
imaging and skeletal scintigraphy. Radiology 1990;175:791.
DG, McCawley TR, Ratner LM, et al. In-phase and out-of-phase MR imaging
of bone marrow: prediction of neoplasia based on the detection of
coexistent fat and water. AJR 1997;169:1439.
WA, Destouet JM, Gilula LA. Percutaneous skeletal biopsy 1981: a
procedure for radiologists—results, review, and recommendations. Radiology 1981;139:545.
O, Marchetti PG, Bartolozzi P. The effects of methylprednisolone
acetate in the treatment of bone cyst: results of three years
follow-up. J Bone Joint Surg Am [Br] 1979;61(B):200.
R, Albisinni U, Caroli GC., et al., Contrast examination as a
prognostic factor in the treatment of solitary bone cyst by cortisone
injection. Skeletal Radiol 1984;12:97.
SK, Blumenthal DH, Poznanski AK, et al. Radiographic changes in
unicameral bone cysts following direct injection of steroids: a report
on 14 cases. Radiology 1981;140:689.
LP, Connolly SA, Drubach LA, et al. Acute hematogenous osteomyelitis of
children: assessment of skeletal scintigraphy-based diagnosis in the
era of MRI. J Nucl Med 2002;43:1310.
AK, Dias LS, Conway JJ, et al. The prognostic value and significance of
serial bone scintigraphy in Legg-Calve-Perthes disease. J Pediatr Orthop 1997;17:230.
F, De Rosa V, Zekri H, et al. Confirmation of the early prognostic
value of bone scanning and pinhole imaging of the hip in
Legg-Calve-Perthes disease. J Nucl Med 2003;44:1761.
SA, Cook D, Fitzgerald M, et al. Complementary use of radiological
skeletal survey and bone scintigraphy in detection of bony injuries in
suspected child abuse. Arch Dis Child 2003;88:387; discussion 387.
BD, Johnson RP, Carrera GF, et al. Painful spondylolysis or
spondylolisthesis studied by radiography and single-photon emission
computed tomography. Radiology 1985; 154:207.
RD, Summerville DA, Treves ST, et al. Low-back pain in adolescent
athletes: detection of stress injury to the pars interarticularis with
SPECT. Radiology 1991;180:509–512.