
task of the pediatric orthopaedic surgeon in order to determine the
efficacy of treatments, stay abreast of new technology, and provide
optimal patient care. However, this task can be daunting because the
clinician is inundated with medical information from scientific
journals, scientific meetings, the lay press, industry, and even the
Internet. Critical evaluation of the medical literature is vital in
order to distinguish the studies that are scientifically sound and
sufficiently compelling to warrant a change of practice from those that
are methodologically flawed or biased. A working understanding of
clinical epidemiology and biostatistics is necessary for critical
evaluation of the medical literature. This chapter provides an overview
of the concepts of study design, hypothesis testing, measures of
effect, diagnostic performance, evidence-based medicine (EBM), outcomes
assessment, and biostatistics. Examples from the orthopaedic literature
and a glossary of terminology (terms italicized throughout the text)
are provided.
cataloguing vital statistics from birth and death records in the 1600s,
through correlational studies associating cholera with water
contamination, case-control studies linking smoking with lung cancer,
and prospective cohort studies such as the Framingham Heart Study, to
the randomized clinical trial (RCT) for the polio vaccine (1). The evidence-based medicine (EBM) and patient-derived outcomes
assessment movements burst onto the scene of clinical medicine in the
1980s and 1990s as a result of contemporaneous medical, societal, and
economic influences. Pioneers such as Sackett and Feinstein emphasized
levels of evidence and patient-centered outcomes assessment (2,3,4,5,6,7,8,9,10).
Work by Wennberg et al. revealed substantial small-area variations in
clinical practice, with some patients being 30 times more likely to
undergo an operative procedure than other patients with identical
symptoms just because of their geographic location (11,12,13,14,15,16).
Further critical research suggested that up to 40% of some surgical
procedures might be inappropriate and that up to 85% of common medical
treatments had not been rigorously validated (17,18,19).
Meanwhile, the costs of health care in the US were rapidly rising to
over 2 billion dollars per day, increasing from 5.2% of the gross
domestic product in 1960 to 16.2% in 1997 (20).
Health maintenance organizations and managed care emerged in recent
times. In addition, increasing federal, state, and consumer oversight
were brought to bear on the practice of clinical medicine. These forces
have led
to an increased focus on the effectiveness of clinical care and on the design of clinical research studies.
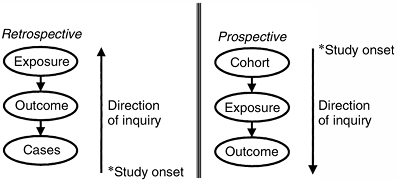
which means that the direction of inquiry is backward from the cases
and that the events of interest have transpired before the onset of the
study, or they may be prospective, which
means that the direction of inquiry is forward from the cohort
inception and that the events of interest transpire after the onset of
the study (Fig. 4.1). Cross-sectional studies are used for surveying patients at one point in time. Longitudinal studies follow the same patients over multiple points in time.
is the nonrandom systematic error in the design or conduct of a study.
Bias is usually not intentional; however, it is pervasive and
insidious. Bias can corrupt a study at any phase, including patient
selection (i.e., selection and membership bias), study performance
(i.e., performance and information bias), patient follow-up (i.e.,
nonresponder and transfer bias), and outcome determination (i.e.,
detection, recall, acceptability, and interviewer bias). Frequent
biases in the orthopaedic literature include selection bias when unlike
groups are being compared, nonresponder bias in studies with low
follow-up rates, and interviewer bias when the investigator is
determining outcome. A confounder is a variable having independent associations with both the independent (predictor) and the dependent
(outcome) variables, thereby potentially distorting the relation
between them. For example, an association between knee laxity and
anterior cruciate ligament injury may be confounded by female gender
because women may have greater knee laxity and a higher risk of
anterior cruciate ligament injury. Frequent confounders in clinical
research include gender, age, socioeconomic status, and comorbidities.
As discussed in the section on hypothesis testing, chance may lead to invalid conclusions based on the probability of type-I and type-II errors, which are related to P values and power.
 |
|
Figure 4.1 Prospective versus retrospective study design, defined on the basis of the direction of inquiry and on the onset of the study.
|
be minimized by study design and statistical analysis. Prospective
studies minimize the bias associated with patient selection, quality of
information, attempts to recall preoperative status, and nonresponders.
Randomization minimizes selection bias and equally distributes confounders. Blinding can further decrease bias, and matching can decrease confounding. Confounders can sometimes be controlled post hoc
by the use of stratified analysis or multivariable methods. The effects
of chance can be minimized by an adequate sample size on the basis of power
calculations and use of appropriate levels of significance in
hypothesis testing. The ability of study design to optimize validity
while minimizing bias, confounding, and chance is acknowledged by the
adoption of hierarchic levels of evidence based on study design (Table 4.1).
is a retrospective, descriptive account of a group of patients with
interesting characteristics or of a series of patients who have
undergone an intervention. A case series of one patient is a case report.
Case series are easy to construct and can provide a forum for the
presentation of interesting or unusual observations. However, case
series are often anecdotal, are subject to many possible biases, lack a
hypothesis, and are difficult to compare with other series. Therefore,
case series are usually viewed as a means of generating hypotheses for
further studies but are not viewed as conclusive.
in which the investigator identifies patients with an outcome of
interest (cases) and patients without the outcome (controls) and then
compares the two groups in terms of possible risk factors. The effects
in a case-control study are frequently reported in terms of the odds ratio.
Case-control studies are efficient (particularly for the evaluation of
unusual conditions or outcomes) and are relatively easy to perform.
However, an appropriate control group may be difficult to identify, and
preexisting high-quality medical records are essential. Moreover,
case-control studies are susceptible to multiple biases, particularly
selection and detection bias based on the identification of cases and
controls.
often used for determining the prevalence of disease or for identifying
coexisting associations in patients who have a particular condition at
one particular point in time. Prevalence
of a condition is the number of individuals with the condition divided
by the total number of individuals at a particular point in time. Incidence,
in contradistinction, refers to the number of individuals with the
condition divided by the total number of individuals over a defined
time period. Thus, prevalence data are usually obtained from a
cross-sectional survey and are expressed as a proportion, whereas
incidence data are
usually
obtained from a prospective cohort study and contain a time value in
the denominator. Surveys are also frequently performed to determine
preferences and treatment patterns. Because cross-sectional studies
represent a snapshot in time, they may be misleading if the research
question involves the disease process over time. Surveys also present
unique challenges in terms of adequate response rate, representative
samples, and acceptability bias.
is one in which a population of interest is identified and followed
prospectively in order to determine outcomes and associations with risk
factors. Retrospective cohort studies, or historic cohort studies, can
also be performed, in which cohort members are identified on the basis
of records, and the follow-up period occurs entirely or partly in the
past. Cohort studies are optimal for studying the incidence, course,
and risk factors of a disease because they are longitudinal, which
means that a group of subjects is followed over time. The effects in a
cohort study are frequently reported in terms of relative risk.
Because traditional cohort studies are prospective, they can optimize
follow-up and data quality and can minimize the bias associated with
selection, information, and measurement. In addition, they have the
correct time sequence to provide strong evidence about associations.
However, these studies are costly, are logistically demanding, often
require long periods for completion, and are inefficient in assessing
unusual outcomes or diseases.
of clinical evidence because it provides the most valid conclusions
(internal validity) by minimizing the effects of bias and confounding.
A rigorous randomization with enough patients is the best means of
avoiding confounding. The setting up of an RCT involves the
construction of a protocol document that explicitly establishes
eligibility criteria, sample size, informed consent, randomization,
stopping rules, blinding, measurement, monitoring of compliance,
assessment of safety, and data analysis. Because allocation is random,
the selection bias is minimized, and confounders (known and unknown)
are equally distributed, in theory, between groups. Blinding minimizes
performance, detection, interviewer, and acceptability bias. Blinding
may be practiced at four levels: (a) participants, (b) investigators
applying the intervention, (c) outcome assessors, and (d) analysts. Intention-to-treat analysis
minimizes nonresponder and transfer bias, whereas sample-size
determination ensures adequate power. The intention-to-treat principle
states that all patients should be analyzed within the treatment group
to which they were randomized in order to preserve the goals of
randomization. Although the RCT is the epitome of clinical research
designs, the disadvantages of RCTs include their high expense, logistic
complexities, and length of time to completion. Accrual of patients and
acceptance by clinicians may be problematic to achieve. With rapidly
evolving technology, a new technique may quickly become well accepted,
making an existing RCT obsolete or a potential RCT difficult to accept.
In terms of ethics, RCTs require clinical equipoise (i.e., equality of
treatment options in the clinician’s judgment) for enrollment, interim
stopping rules to avoid harm and evaluate adverse events, and truly
informed consent. Finally, although RCTs have excellent internal
validity, some have questioned their generalizability (external
validity) because the practice pattern and the population of patients
enrolled in an RCT may be overly constrained and nonrepresentative.
conduct of clinical research studies. Informed consent is of paramount
importance and it is the focus of much of the activity of Institutional
Review Boards. Investigators should be familiar with the Nuremberg Code
and the Declaration of Helsinki because they pertain to ethical issues
of risks and benefits, protection of privacy, and respect for autonomy (21,22).
generalizations from a sample to the population from which it came.
Hypothesis testing either confirms or refutes the assertion that the
observed findings did not occur by chance alone, but because of a true
association between variables. By default, the null hypothesis of a study asserts that there is no significant association between variables, whereas the alternative hypothesis
asserts that there is a significant association. If the findings of a
study are not significant we cannot reject the null hypothesis, whereas
if the findings are significant we can reject the null hypothesis and
accept the alternative hypothesis.
sample make an inference about the truth in the overall population. By
constructing a table of the possible outcomes of a study (Table 4.2), we can see that the inference of a study is correct if no significant association is
found when there is no true association or if a significant association
is found when there is a true association. However, a study can have
two types of errors: A type-I or alpha (α) error
occurs when a significant association is found when there is no true
association (resulting in a “false-positive” study that rejects a true
null hypothesis); a type-II or beta (β) error
occurs when there is a significant association, but the study wrongly
concludes that there is none (resulting in a “false-negative” study
that rejects a true alternative hypothesis).
|
TABLE 4.2 HYPOTHESIS TESTING
|
|||||||||||||||
|---|---|---|---|---|---|---|---|---|---|---|---|---|---|---|---|
|
|||||||||||||||
error. By convention, the α level of significance is set at 0.05, which
means that we accept the finding of a significant association if there
is less than a one in 20 possibility that the observed association was
due to chance alone. The P value, which is
calculated from a statistical test, is therefore a measure of the
extent to which the data favors the null hypothesis. If the P
value is less than the α level (0.05), then the evidence against the
null hypothesis is strong enough to reject it, and the conclusion will
be that the result is statistically significant. The P
values are frequently used in clinical research and are given great
importance by journals and readers. However, there is a strong movement
in biostatistics to deemphasize P values
because: (a) a significance level of P <0.05 is arbitrary; (b) a
strict cutoff point can be misleading (there is little difference
between P = 0.049 and P = 0.051 yet only the former is considered
“significant”); (c) the P value gives no information about the strength of the association, and (d) the P
value may be statistically significant without the results being
clinically important. Alternatives to the traditional reliance on P
values include the use of variable α levels of significance based on
the consequences of the type-I error, and the reporting of P values without using the term “significant.” The use of 95% confidence intervals instead of P
values has gained acceptance, because these intervals convey
information about the significance of the findings (i.e., 95%
confidence intervals do not overlap if they are significantly
different), the magnitude of the differences, and the precision of
measurement (indicated by the range of the 95% confidence interval).
finding a significant association if it truly exists and is defined as
the difference between 1 and the probability of a type-II (β) error. By
convention, the acceptable power is set at 80% or more, which means
there is a 20% or less chance that the study will demonstrate no
significant association when there is an association. In practice, when
a study demonstrates a significant association, the potential error of
concern is the type-I (α) error, as expressed by the P
value. However, when a study demonstrates no significant association,
the potential error of concern is the type-II (β) error, as expressed
by power. That is, in a study that demonstrates no significant effect,
there may truly be no significant effect; on the other hand, there may
actually be a significant effect but the study was too underpowered to
demonstrate it because the sample size may have been too small or the
measurements may have been too imprecise. Therefore, in a study that
demonstrates no significant effect, the power of the study should be
reported. The calculations for power analyses differ depending on the
statistical methods used in the analysis. Four elements are involved in
a power analysis: α, β, effect size, and sample size (n). Effect size
is the difference that one wants to be able to detect with the given α
and β It is based on a clinical sense about what extent of difference
would be clinically meaningful. Effect sizes are often defined as
dimensionless terms on the basis of a difference in mean values divided
by the pooled standard deviation for a comparison of two groups. Low
sample sizes, small effect sizes, and large variance decrease the power
of a study. An understanding of power issues is important in clinical
research in order to minimize resources when planning a study and to
ensure the validity of the study. Sample size
calculations are performed when planning a study. Typically, power is
set at 80%, α level is set at 0.05, the effect size and variance are
estimated from pilot data or the literature, and the equation is solved
for the necessary sample size. The calculation of power after the study
has been completed (i.e., post hoc power analysis) is controversial and is not recommended.
test is the percentage (or proportion) of patients who have the disease
and are classified positive (true-positive rate). A test with 97%
sensitivity implies that of 100 patients with disease, 97 will show
positive test results. Sensitive tests have a low false-negative rate.
A negative result on a highly sensitive test rules disease out (SNout).
The specificity
of a test is the percentage (or proportion) of patients without the
disease who are classified negative (true-negative rate). A test with
91% specificity implies that of 100 patients without the disease, 91
will show negative test results. Specific tests have a low
false-positive rate. A positive result on a highly specific test rules
disease in (SPin). Sensitivity and specificity can be combined into a
single parameter, the likelihood ratio (LR),
which is the probability of a true positive divided by the probability
of a false positive. Sensitivity and specificity can be established in
studies in which the results of a diagnostic test are compared with the
gold standard of diagnosis in the same patients [e.g., by comparing the
results of magnetic resonance imaging with arthroscopic findings (23)].
|
TABLE 4.3 DIAGNOSTIC TEST PERFORMANCE
|
||||||||||||||||||||||||||||||||||||
|---|---|---|---|---|---|---|---|---|---|---|---|---|---|---|---|---|---|---|---|---|---|---|---|---|---|---|---|---|---|---|---|---|---|---|---|---|
|
||||||||||||||||||||||||||||||||||||
diagnostic testing performance and have important implications for
screening and clinical practice guidelines (CPGs) (24,25);
however, they are less relevant in the typical clinical setting because
the clinician does not know whether the patient has the disease. The
clinically relevant questions are the probability that a patient has
the disease given a positive result [positive predictive value (PPV)] and the probability that a patient does not have the disease given a negative result [negative predictive value (NPV)].
The PPVs and NPVs are probabilities that require an estimate of the
prevalence of the disease in the population and can be calculated using
equations that utilize Bayes theorem (26).
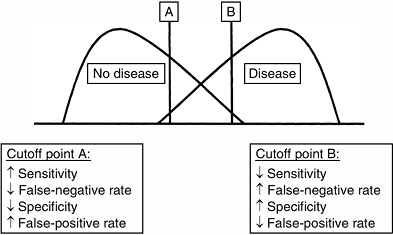
specificity. Because there is typically some overlap between the
diseased and nondiseased groups with respect to a test distribution,
the investigator can select a positivity criterion with a low
false-negative rate (to optimize sensitivity) or a criterion with a low
false-positive rate (to optimize specificity) (Fig. 4.2).
In practice, positivity criteria are selected on the basis of the
consequences of a false-positive or a false-negative diagnosis. If the
consequences of a false-negative diagnosis outweigh the consequences of
a false-positive diagnosis of a condition [e.g., septic arthritis of
the hip in children (27)], a more sensitive
criterion is chosen. This relation between the sensitivity and
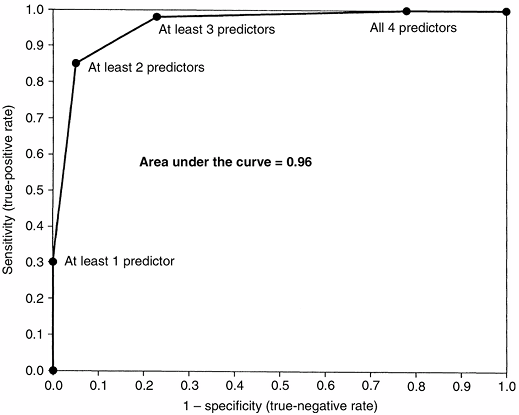
specificity of a diagnostic test can be portrayed by using a receiver-operating characteristic (ROC) curve. An ROC graph shows the relation between the true-positive rate (sensitivity) on the y axis and the false-positive rate (1–specificity) on the x axis plotted at each possible cutoff (Fig. 4.3). Overall diagnostic performance can be evaluated from the area under the ROC curve (28).
 |
|
Figure 4.2
Selecting a positivity criterion. Because there typically is overlap between the diseased population and the nondiseased population over a range of diagnostic values (x axis), there is an intrinsic trade-off between sensitivity and specificity. Identifying positive test results to the right of cutoff point A, there is high sensitivity because most diseased patients are correctly identified as positive; however, there is lower specificity because some nondiseased patients are incorrectly identified as positive (false positives). Identifying positive test results to the right of cutoff point B, there is lower sensitivity because some diseased patients are incorrectly identified as negative (false negatives); however, there is high specificity because most nondiseased patients are correctly identified as negative. |
is a number, between 0 and 1, that indicates how likely an event is to
occur on the basis of the number of events per number of trials. The
probability of heads on a coin toss is 0.5. Odds
refers to the ratio of the probability of an event occurring to the
probability of the event not occurring. The odds of flipping a heads on
a coin toss is 1 (0.5/0.5). Because probability and odds are related,
they can be converted; odds = probability/(1 – probability).
can be determined in a prospective cohort study, where RR equals the
incidence of disease in the exposed cohort divided by the incidence of
disease in the nonexposed cohort (Table 4.4). A similar measurement in a retrospective case-control study (where incidence cannot be determined) is the odds ratio (OR),
which is the ratio of the odds of a patient in the study group having
the disease compared with the odds of a patient in the control group
having the same disease (Table 4.4). For
example, a prospective cohort study of
anterior-cruciate-ligament–deficient skiers that finds a significantly
higher proportion of subsequent knee injuries in nonbraced (12.7%)
versus braced (2.0%) skiers may report a risk ratio of 6.4 (12.7%/2.0%)
(29). This report can be interpreted to mean
that a nonbraced anterior-cruciate-ligament–deficient skier has a 6.4
times higher risk of subsequent knee injury than a braced skier.
The effect of a factor that reduces the probability of an adverse outcome can be quantified by the relative risk reduction (RRR), the absolute risk reduction (ARR), and the number needed to treat (NNT) (Table 4.4). The effect of a factor that increases the probability of an adverse outcome can be quantified by the relative risk increase (RRI), the absolute risk increase (ARI), and the number needed to harm (NNH) (Table 4.4).
 |
|
Figure 4.3
Receiver-operating characteristic (ROC) curve for a clinical prediction rule to differentiate septic arthritis from transient synovitis of the hip in children (27). The false-positive rate (1 – specificity) is plotted on the x axis, and sensitivity is plotted on the y axis. The area under the curve represents the overall diagnostic performance of a prediction rule or a diagnostic test. For a perfect test, the area under the curve is 1.0. For random guessing, the area under the curve is 0.5. (From Kocher MS, Zurakowski D, Kasser JR. Differentiating between septic arthritis and transient synovitis of the hip in children: an evidence-based clinical prediction algorithm. J Bone Joint Surg 1999;81A:1662–1670, with permission.) |
refers to the result of that medical care. The emphasis of the outcomes
assessment movement has been on patient-derived outcomes assessment.
Measures of outcomes include generic, condition-specific, and patient
satisfaction (30).
|
TABLE 4.4 TREATMENT EFFECTS
|
|||||||||||||||||||||||||||||||||||||||
|---|---|---|---|---|---|---|---|---|---|---|---|---|---|---|---|---|---|---|---|---|---|---|---|---|---|---|---|---|---|---|---|---|---|---|---|---|---|---|---|
|
|||||||||||||||||||||||||||||||||||||||
the Short Form-36 (SF-36), are used for assessing health status or
health-related quality of life, on the basis of the World Heath
Organization’s multiple-domain definition of health (31,32).
such as the International Knee Documentation Committee (IKDC) knee
score or the Constant shoulder score, are used for assessing aspects of
a specific condition or body system.
are used for assessing various components of care and have diverse
applications, including quality of care, health care delivery,
patient-centered models of care, and continuous quality improvement (33,34,35,36).
involves identifying the construct, devising items, scaling responses,
selecting items, forming factors, and creating scales. A large number
of outcomes instruments have been developed and used without formal
psychometric assessment of their reliability, validity, and
responsiveness to change.
refer to the repeatability of the instrument when used by different
observers or by the same observer at different time-points,
respectively. Test–retest reliability can
be assessed by using the instrument to evaluate the same patient on two
different occasions without an interval change in medical status. These
results are usually reported using the kappa statistic or intraclass correlation coefficient.
assesses whether an instrument is representative of the characteristic
being measured, using expert consensus opinion (face validity). Criterion validity assesses an instrument’s relationship to an accepted, “gold-standard” instrument. Construct validity
assesses whether an instrument follows accepted hypotheses (constructs)
and produces results consistent with theoretical expectations.
conscientious, explicit, and judicious use of current best evidence in
making decisions about the care of individual patients (37).
EBM integrates best research evidence with clinical expertise and
patient values. The steps of EBM involve: (a) converting the need for
information into an answerable question; (b) tracking down the best
evidence to answer that question; (c) critically appraising the
evidence with regard to its validity, impact, and applicability; and
(d) integrating the critical appraisal with clinical expertise and the
patient’s unique values and circumstances (38,39).
The types of questions asked in EBM are foreground questions pertaining
to specific knowledge about managing patients who have a particular
disorder. Evidence is graded on the basis of study design (Table 4.1),
with an emphasis on RCTs, and can be found on evidence-based databases
[e.g., Evidence-Based Medicine Reviews (EBMR) from Ovid Technologies,
the Cochrane Database of Systematic Reviews, Best Evidence, Clinical
Evidence, National Guidelines Clearinghouse, CancerNet, and Medline]
and evidence-based journals (e.g., Evidence-Based Medicine and ACP Journal Club).
 |
|
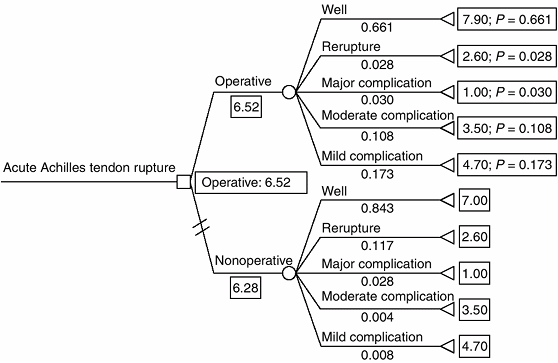
Figure 4.4 Expected-value decision analysis tree for operative versus nonoperative management of acute Achilles tendon rupture (45).
Decision nodes are represented by □, chance nodes are represented by ^, and terminal nodes are represented by [black up-pointing triangle] Mean outcome utility scores are listed to the right of the terminal node (0–10). Outcome probabilities are listed under the terminal node title (0–1). Operative treatment is favored because it has a higher expected value (6.52 versus 6.28). (From Kocher MS, Bishop J, Luke A, et al. Operative vs nonoperative management of acute achilles tendon ruptures: expected-value decision analysis. Am J Sports Med 2002;30: 783–790, with permission.) |
is a summary of the medical literature in which explicit methods are
used to perform a thorough literature search and a critical appraisal
of studies. A more specialized type of SR is a meta-analysis,
in which quantitative methods are used to combine the results of
several independent studies (usually RCTs) to produce statistical
summaries. For example, a study that systematically reviews the
literature (with inclusion and exclusion criteria for studies) about
internal fixation versus arthroplasty for femoral neck fractures and
then summarizes the subsequent outcomes and complications would be
considered a SR. On the other hand, a study that systematically reviews
the literature (with inclusion and exclusion criteria for studies) and
then combines the patients to perform new statistical analyses would be
considered a meta-analysis (40).
are algorithms that are developed, on the basis of the best available
evidence, to standardize processes and optimize outcomes. They may also
potentially reduce errors of omission and commission, reduce variations
in practice patterns, and decrease costs (41).
The rationale underlying explicit decision analysis is that a decision
must be made, often under circumstances of uncertainty, and that
rational decision theory optimizes expected value. The process of
expected-value decision analysis involves the creation of a decision
tree to structure the decision problem, determination of outcome
probabilities and utilities (patient values), fold-back analysis to
calculate the expected value of each decision path to determine the
optimal decision-making strategy (Fig. 4.4), and sensitivity analysis to determine the effects of varying outcome probabilities and utilities on decision making (Fig. 4.5). Decision analysis can identify the
optimal decision strategy and how this strategy changes with variations
in outcome probabilities or patient values. This process, whether used
explicitly or implicitly, integrates well with the newer doctor–patient
model of shared decision making.
 |
|
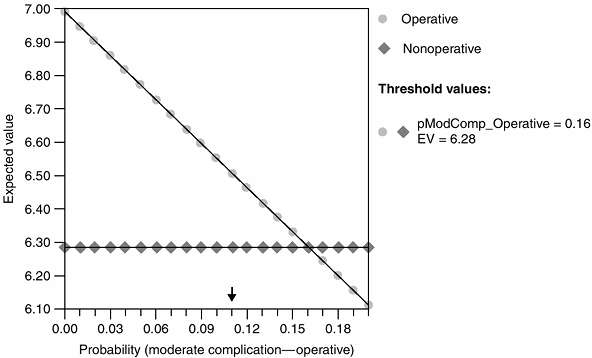
Figure 4.5 Sensitivity analysis for operative versus nonoperative management of acute Achilles tendon rupture (45).
The probability of wound complication from operative treatment is shown on the x axis. The lines represent the expected value for the operative and nonoperative decisions. Above the threshold value (i.e., probability of wound complication from operative treatment = 21%), nonoperative treatment is favored. (From Kocher MS, Bishop J, Luke A, et al. Operative vs nonoperative management of acute achilles tendon ruptures: expected-value decision analysis. Am J Sports Med 2002;30:783–790, with permission.) |
designs include cost-identification studies, cost-effectiveness
analysis, cost-benefit analysis, and cost-utility analysis (46,47).
implications for the way in which information is summarized and
analyzed. Data can be categorical, ordinal, or continuous. Categorical data
indicate types or categories and can be thought of as counts.
Categories do not represent an underlying order. Examples include
gender and a dichotomous (yes/no, successful/failure) outcome. Also
called nominal data, categorical data are generally described in terms of proportions or percentages and are reported in tables or bar charts.
The numbers that are used represent an order but are not necessary to
scale. Examples include cancer stages and injury grades. Ordinal data
are also generally described in terms of proportions or percentages and
are reported in tables or bar charts.
observations on a continuum for which the differences between numbers
have meaning on a numerical scale. Examples include age, weight, and
distance. When a numerical observation can take on only integer values,
the scale of measurement is called discrete. Continuous data are generally described in terms of mean and standard deviation and can be reported in tables or graphs.
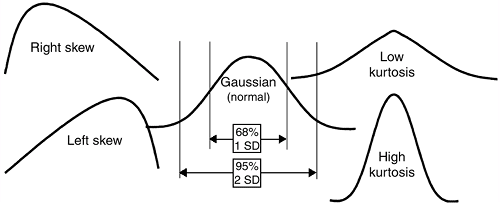
Data can be characterized by different distributions, such as the
normal (Gaussian) distribution, skewed distributions, and bimodal
distributions (Fig. 4.6).
the outcome of interest is time until an event occurs. A group of
patients is monitored to see if they experience the event of interest.
The endpoint in survivorship analysis can be mortality or a clinical
endpoint such as revision of a total joint replacement. Typically,
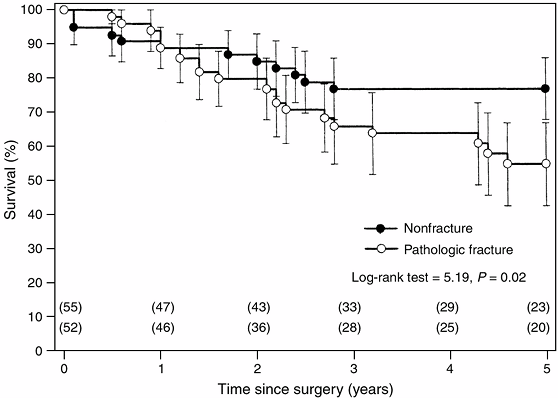
survivorship data are analyzed using the Kaplan-Meier (KM)
product-limit method and are depicted graphically by KM curves (Fig. 4.7) (48,49,50).
analyses assess the relation of an independent variable to a dependent
variable. The commonly used statistical tests and their indications are
listed in Table 4.5. Multivariate analysis explores relations between multiple variables. Regression is a method of obtaining a mathematic relationship between an outcome variable (Y) and an explanatory variable (X) or a set of independent variables (XiS) Linear regression is used when the outcome variable is continuous, and the goal is to find the line that best predicts Y from X.
Logistic regression, which is used when the outcome variable is binary
or dichotomous, has become the most common form of multivariate
analysis for non–time-related outcomes. Other regression methods
include time-to-event data (e.g., Cox proportional-hazards
regression) and count data (e.g., Poisson regression). Regression modeling is commonly used to predict outcomes (Table 4.6)
or to establish independent associations (controlling for confounding
and collinearity) among predictor or explanatory variables. For
example, logistic regression can be used for determining predictors of
septic arthritis versus transient synovitis of the hip in children from
an array of presenting demographic, laboratory, and imaging variables (27).
Similarly, linear regression can be used for arriving at independent
determinants of patient outcome, measured by using a continuous outcome
instrument (36). Because many variables usually influence a particular outcome, it is often necessary to use multivariate analysis.
 |
|
Figure 4.6 Data distributions.
|
illustrative of the impact of the medical literature on the
understanding of a pediatric orthopaedic condition and on the
importance of well-designed clinical research studies.
 |
|
Figure 4.7
Kaplan-Meier estimated survivorship curves comparing survival rates between patients who had osteosarcoma with a pathologic fracture and those without a fracture (51). The estimated rates were significantly lower for patients with a pathologic fracture (log-rank test = 5.19; P = 0.02). The error bars around the survivorship curves represent 95% confidence intervals derived by Greenwood formula. The number of patients on whom the estimates were based are shown in parentheses. |
“lateral curvatures also occur, the proximate cause of which is the
attitudes in which these patients lie” (52).
This concept of a postural etiology persisted for the next two thousand
years and was supported by the writings of Nicolas Andry in the 1700s,
James Paget in the 1800s, and Robert Lovett in the 1900s (53).
Medical literature describes the various methods of treatment that were
subsequently developed, including different kinds of braces and
appliances, traction devices, gymnastic exercises, subcutaneous
tenotomy, and plaster of paris casts (53). Modern surgical management of scoliosis is based on the results of case series of in situ fusion in 360 patients by Hibbs et al. in 1931 and fusion with instrumentation in 129 patients by Harrington in 1962 (54,55).
scoliosis was advocated. In 1941, a committee of the American
Orthopaedic Association, headed by Alfred Shands, investigated the
treatment of scoliosis in the United States and reviewed the records of
425 patients (56). This committee concluded
that bracing and exercise programs were effective only in some patients
and that those with progressive
deformity
were best treated with correction followed by fusion. John Moe
established the Scoliosis Research Society in 1966. Classical
epidemiologic methods were utilized to establish the incidence of
scoliosis and to study the value of screening programs (57,58). A nomogram was developed for the prediction of curve progression to aid in planning treatment and advising families (59). Case series purported to support the efficacy of the Milwaukee brace and the Boston brace (60,61). The long-term results of natural history, bracing, and surgery were reported (62,63,64,65). The health, functioning, and psychosocial characteristics of patients with idiopathic scoliosis were investigated (66,67).
|
TABLE 4.5 STATISTICAL TESTS FOR COMPARING INDEPENDENT GROUPS AND PAIRED SAMPLES
|
||||||||||||||||||||||||||||||||||||||||||||||||
|---|---|---|---|---|---|---|---|---|---|---|---|---|---|---|---|---|---|---|---|---|---|---|---|---|---|---|---|---|---|---|---|---|---|---|---|---|---|---|---|---|---|---|---|---|---|---|---|---|
|
||||||||||||||||||||||||||||||||||||||||||||||||
|
TABLE 4.6 MULTIVARIATE METHODS: LOGISTIC REGRESSION FOR PREDICTION OF SEPTIC ARTHRITIS OF THE HIP IN CHILDREN
|
||||||||||||||||||||||||||||||||||||||||||||||||||||||||||||||||||||||||||||||||||||||||||
|---|---|---|---|---|---|---|---|---|---|---|---|---|---|---|---|---|---|---|---|---|---|---|---|---|---|---|---|---|---|---|---|---|---|---|---|---|---|---|---|---|---|---|---|---|---|---|---|---|---|---|---|---|---|---|---|---|---|---|---|---|---|---|---|---|---|---|---|---|---|---|---|---|---|---|---|---|---|---|---|---|---|---|---|---|---|---|---|---|---|---|
|
||||||||||||||||||||||||||||||||||||||||||||||||||||||||||||||||||||||||||||||||||||||||||
effectiveness of treatment. RCTs of different spinal instrumentation
systems are under way. A large, multicenter trial on the effectiveness
of bracing for adolescent idiopathic scoliosis has been proposed.
Further inquiry into the effect of scoliosis on health-related quality
of life has also been advocated.
significant association is found when there is no true significant
association (rejecting a true null hypothesis). The αlevel is the
threshold of statistical significance established by the researcher (P
<0.05 by convention).
significant association is found when there is a true significant
association (rejecting a true alternative hypothesis).
patients and/or investigators do not know who is in the treatment group
and who is in the control group. The term masking is often used.
design that describes a series of patients with an outcome of interest
or who have undergone a particular treatment. There is no control group
in a case series.
design that involves identifying cases with outcome of interest, and
controls without such an outcome, and then looking back to see if these
outcomes had exposure of interest.
observation whose outcome is unknown because the patient has not had
the event of interest or is no longer being followed.
evidence-based statement designed to standardize the process of care
and to optimize the outcome of care for specified clinical
circumstances.
that involves identifying group(s) having the exposure or condition of
interest, and then following these group(s) forward for the outcome of
interest.
measurement. It is usually reported as 95% CI, which is the range of
values within which there is a 95% probability that the true value lies.
associations with both the dependent and independent variables, thereby
potentially distorting the relation between the variables.
instrument that assesses whether the instrument is representative of
the characteristic being measured (face validity).
continuum scale of equal intervals and are capable of having fractions
(i.e., interval, ratio, numerical, and quantitative data).
financial costs to benefits. Both are measured in monetary units. The
result is reported as a ratio.
patient-oriented utility of outcomes. It is reported frequently as cost
per quality-adjusted life-year (QALY).
that involves the allocation of two or more experimental treatments,
one after the other in a specified or random order to the same group of
patients.
methods that analyze the probability and utility of outcomes in order
to analyze a decision under conditions of uncertainty.
considered to be clinically meaningful. It is used in power analysis to
determine the required sample size.
outcome of interest, and that contributes information about the outcome
in addition to that provided by other variables considered
simultaneously.
clinical trials in which all patients randomly assigned to a treatment
group are analyzed in that treatment group, whether or not they have
received that treatment or have completed the study.
would be expected in a patient with a particular condition compared to
a patient without the condition. It is the ratio of true-positive rate
to false-positive rate.
that uses quantitative methods to combine the results of several
independent studies to produce statistical summaries.
variables with respect to a single outcome, or analysis of several
outcome variables simultaneously with respect to explanatory variables.
condition/outcome in the experimental group to the odds of having the
condition/outcome in the control group (case-control study).
association when it truly exists [1 -probability of type II (β) error].
By convention, power of 80% or greater is considered sufficient.
that randomly allocates eligible patients to experimental versus
control groups or different treatment groups.
determine how varying different components of a decision tree or model
change the conclusions.
medical literature that uses explicit methods to perform a thorough
literature search and critical appraisal of studies.
AD, Sackett DL, Guyatt GH. Users’ guides to the medical literature. I.
How to get started. The evidence-based medicine working group. JAMA 1993;270(17):2093–2095.
AR, Pritchett JA, Schimpff CR. The epidemiology of cancer therapy. II.
The clinical course: data, decisions, and temporal demarcations. Arch Intern Med 1969;123:323–344.
JG, Feinstein AR. A comparative contrast of clinimetric and
psychometric methods for constructing indexes and rating scales. J Clin Epidemiol 1992;45:1201–1218.
MR. Does inappropriate use explain geographic variations in the use of
health care services? A study of three procedures [see Comments]. JAMA 1987;258(18):2533–2537.
RE, Fink A, Brook RH, et al. Physician ratings of appropriate
indications for three procedures: theoretical indications vs
indications used in practice. Am J Public Health 1989;79(4): 445–447.
Medical Organization. Declaration of Helsinki: recommendations guiding
physicians in biomedical research involving human subjects. JAMA 1997;277:925–926.
MS, DiCanzio J, Zurakowski D, et al. Diagnostic performance of clinical
examination and selective magnetic resonance imaging in the evaluation
of intra-articular knee disorders in children and adolescents. Am J Sports Med 2001;29:292–296.
MS, Zurakowski D, Kasser JR. Differentiating between septic arthritis
and transient synovitis of the hip in children: an evidence-based
clinical prediction algorithm. J Bone Joint Surg 1999;81A:1662–1670.
MS, Sterett WI, Briggs KK, et al. Effect of functional bracing on
subsequent knee injury in ACL-deficient professional skiers. J Knee Surg 2003;16:87–92.
MS, Steadman JR, Zurakowski D, et al. Determinants of patient
satisfaction after anterior cruciate ligament reconstruction. J Bone Joint Surg 2002;84-A:1560–1572.
M, Devereaux PJ, Swiontkowski MF, et al. 3rd internal fixation compared
with arthroplasty for displaced fractures of the femoral neck. A
meta-analysis. J Bone Joint Surg 2003;85A: 1673–1681.
MS, Mandiga R, Murphy J, et al. A clinical practice guideline for
septic arthritis in children: efficacy on process and outcome for
septic arthritis of the hip. J Bone Joint Surg 2003;85A: 994–999.
MD, Naglie G, Naimark D, et al. Primer on medical decision analysis:
part 4—analyzing the model and interpreting the results [see Comments].
Med Decis Making 1997;17(2):142–151.
MS, Bishop J, Luke A, et al. Operative vs nonoperative management of
acute achilles tendon ruptures: expected-value decision analysis. Am J Sports Med 2002;30:783–790.
SP, Ghert MA, Zurakowski D, et al. Pathologic fracture in osteosarcoma:
prognostic importance and treatment implications. J Bone Joint Surg 2002;84A:49–57.
RA, Risser JC, Ferguson AB. Scoliosis treated by the fusion operation:
an end-result study of three hundred and sixty cases. J Bone Joint Surg 1931;13A:91–104.
SL, Dolan LA, Spratt KF, et al. Health and function of patients with
untreated idiopathic scoliosis: a 50-year natural history study. JAMA 2003;289:559–567.