
orthopaedics. It is this ongoing 17-year adventure, punctuated by
upheavals and accidents along the way and jolted by seismic shocks,
that gives this discipline its originality and makes it so interesting.
Growth analysis is the evaluation of the effects of time on the growing
child. Growth is a complex and well-synchronized phenomenon with a
hierarchical pattern that organizes the different types and rates of
growth in various tissues, organs, and individuals through time (1).
mainly growth at the cellular level (e.g., in the growth plate).
Although the histologic structure is the same, each growth plate has
its own characteristics and dynamics (1). The
study of height, weight, and body proportions may be considered as the
study of “macrogrowth.” This study is the culmination of all of the
effects of microgrowth on the individual: the combined effect of growth
of the lower limbs, the trunk, and the upper limbs, increase in weight,
and so on (2,3,4,5,6,7,8). It is this latter form of growth that this chapter deals with.
and the changes it brings about, can be better perceived by considering
these facts: from birth onward, height will increase by 350% and weight
will increase 20-fold; the femur and tibia will triple in length; and
the spine will double in length (2,9,10). Growth requires an enormous amount of energy.
life are much greater than those of adulthood: calories, 110 versus 40
calories per kilogram (kg) per day; protein, 2 versus 1 gram per kg per
day; and water, 150 versus 5 milliliters (mL) per kg per day. Skeletal
mineralization alone requires storage of 1 kg of calcium between birth
and adulthood (11).
diseases, disorders, and injuries are best analyzed on the basis of
past growth, whereas treatments are often planned mostly on the basis
of assumptions about future or remaining growth of various parts of the
body. Growth is an essential element in the natural history of any
orthopaedic disorder in the growing child (12).
It would be a mistake to assume that only growth in terms of increase
in height is important. It is equally important to consider the manner
in which the skeletal system develops, that is, the timing of growth in
various parts of the body and the changing proportions of various body
segments (6,11,13). In addition, the orthopaedist must not lose sight of other aspects of growth, such as growth of the nervous system.
He or she will need to know the significance of these values, for
example, the significance of bone age on the growth of the lower limb
in a girl who has a bone age of 13 years or the effect of a ten-level
spinal fusion in a boy who has a bone age of 10 years. Bone age, Tanner
classification of the stages of puberty, and measurement of the upper
and lower portions of the body are all parameters that may need to be
considered in the analysis of any particular case (2,3,20).
in growth will also allow the orthopaedist to anticipate certain
events, for example, the onset of the increase in growth velocity in a
girl with early breast development. However, these values vary with the
individual, and average values may not apply to a particular
individual. What is most important is the pattern and rate of growth
for the particular individual. It is the rate of growth that will
influence orthopaedic decisions, more than the final height. Likewise,
a change in direction of one of the parameters, which alters its
synchronization with other parameters, may signal an abnormality, a
return to normal phase, or the onset of a normal phase of growth. For
this reason, a sequence of measurements of the important parameters is
far superior to a single measurement.
data are ethnically specific and that it is difficult to transfer
parameters from one population to another. For example, bone age
atlases are not transferable between populations nor are growth curves
transferable from one country to another. A comparison of data relating
to children in England (16,17,18), Switzerland (21), France (22), and the United States (7,15,20,23)
reveals no significant differences in final heights, bone ages, or
other parameters of growth. Looking beyond racial diversity, there are
growth constants (i.e., stages through which every child must pass,
regardless of chronologic age) that are the same in all ethnic groups (24,25).
consultation: a height gauge, scales, a metric tape, and a bone age
atlas. With these tools, the specialist will be able to perform rapid
mental arithmetic and reach a reasonable decision. A few simple
questions will guide the orthopaedist to the information that is
required (2,3).
-
How tall is the child?
-
What is the child’s sitting height?
-
How long is the subischial leg length?
-
How much has the child grown in a single year?
-
What is the child’s chronologic age? What is the bone age?
-
How much growth does the child have left in the trunk and in the lower limbs?
-
Exactly what point has the child reached on his or her developmental path?
-
Where is the child in relation to puberty and the pubertal peak?
-
What about the Tanner signs?
-
Are the child’s proportions within normal limits? How much does the child weigh?
a single measurement. A single measurement can be an error, two
measurements constitute an indication, and three measurements define a
tendency.
generalized or localized to a particular part of the body, measurements
of growth should be taken at regular intervals (4,14,15,16,17,18,26,27). Examples of growth disturbances are skeletal dysplasia (28), spinal deformity (29), limb-length discrepancy (30), or paralytic conditions (31,32,33).
At every clinic, the first response should be to measure the different
anthropometric parameters. Checking the child every 6 months, one of
the two checkups being preferably around his or her birthday, allows an
easy assessment of the growth velocity of the child and the different
body segments (2,3).
These measurements provide a real-time image of growth, and, when
carefully recorded in a continually updated “growth notebook,” they
provide charts that make decisions easier (2,3,10).
Growth velocity is an excellent example, because it provides the best
indicator of the beginning of puberty, on which so many decisions rest.
The first sign of puberty is the increase in growth rate to more than
0.5 centimeters (cm) per month or 6 cm per year.
measurements of these parameters. He or she should be able to perform
these measurements and teach the correct method to others. It is often
useful and possible to instruct the family or the primary physician on
how to obtain necessary data.
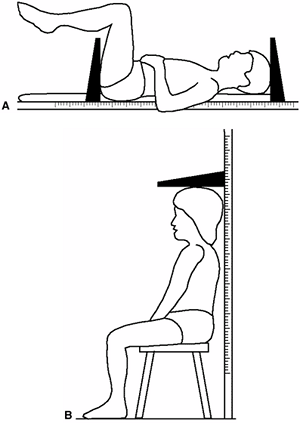
In children younger than 5 years, standing height is measured with the
child lying down because in this age group this position is both easier
and more reliable (18).
approximately 1.20 meters (m), or even 1.30 m. Growth is brisk up to
the age of 5 years. After that, it slows considerably until the onset
of puberty, which occurs at approximately 11 years in girls and 13
years in boys. At 2 years of age, the standing height is approximately
50% of the adult height, at 5 years of age it is approximately 60%, by
the age of 9 years approximately 80%, and at puberty approximately 86%.
In this latter period, standing height increases more rapidly.
These two different regions often grow at different rates at different
times, which is valuable information for decisions in orthopaedics.
Values for the standing heights of girls and boys at various ages are
given in Tables 2.1 and 2.2. The percentages of standing and sitting heights attained at various ages are given in Tables 2.3 and 2.4.
measured with the child lying down for the same reasons that the
standing height is also measured supine in this age group (10,18) (Fig. 2.1).
After the age of 2 years, the child to be measured should be placed on
a stool or table at a convenient height. The most important
consideration of all is that the child should always be measured under
the same conditions using the same measuring instruments. The sitting
height averages 34 cm at birth, and averages 88 cm for girls and 92 cm
for boys at the end of growth.
follow the changes in the sitting height rather than in the standing
height (10,34). If a
6-year-old girl with juvenile scoliosis is being treated, her sitting
height will be approximately 64 cm and will increase to about 88 cm.
Therefore the orthopaedist will have to control the spinal curve while
her trunk grows 24 cm. The measurement of sitting height can also be
useful in anticipating the onset of puberty (10).
In an average population, puberty starts at approximately 75 cm sitting
height in girls and at approximately 78 cm in boys. When the sitting
height is approximately 84 cm, 80% of girls have menarche (2,3,10,35).
 |
|
Figure 2.1 A: Measurement of sitting height. B:
Once the child is able to sit reliably (i.e., after 2 years of age), measurement with a sitting height gauge can be accurately accomplished by having the patient sit on a firm table or stool at a convenient height. |
measured to determine the subischial leg length. As implied by the
name, subischial limb length is measured by subtracting the sitting
height from the standing height (18).
the completion of growth, it will average 81 cm in boys and 74.5 cm in
girls. This 63 cm of growth in boys and 56.5 cm of growth in girls
contributes a far greater percentage of growth in height than does
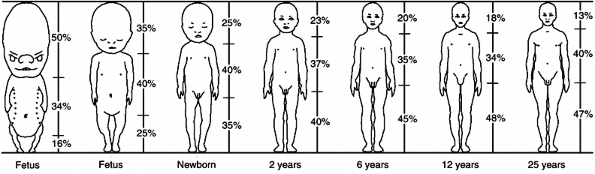
trunk growth (18). This accounts for the changing proportions of the body during growth (Fig. 2.2).
parameter for the measurement of standing height. Combining these two
measurements avoids virtually all errors. To measure arm span, the
patient simply raises the arms to a horizontal position, and the
distance between the tips of the middle fingers is measured with a tape
measure (36,37). There is an excellent correlation between
arm span and standing height—standing height is about 97% of arm span (36).
In 77% of healthy children, arm span will be 0 to 5 cm greater than
standing height; in 22%, it will be 5 to 10 cm greater; and in 1%, it
will be greater by 10 cm or more. This relationship persists throughout
puberty, with arm span tending to be slightly greater in proportion to
standing height in boys than in girls. If the trunk is normal (i.e.,
without deformity), its length will equal approximately 52% of arm
span, and the lower limbs will be equal to approximately 48%, or will
be the same as their proportions in the standing height (2,3).
determining what the normal height of a child who is in a wheelchair
would be; this allows the calculation of the child’s height and weight (31,32,33,36).
It is routinely used for any child who has a spine deformity (e.g.,
scoliosis) for calculating the normal values for pulmonary function.
This relation is also useful in diagnosing certain disorders
characterized by a disproportion between the limbs and the trunk, for
example, Marfan syndrome, in which arm span is usually 5 cm greater
than standing height. In children with spinal deformity, arm span is a
good estimate of what standing height would be if there were no scoliosis.
|
TABLE 2.2 STANDING HEIGHTS OF BOYS AT VARIOUS AGES
|
|||||||||||||||||||||||||||||||||||||||||||||||||||||||||||||||||||||||||||||||||||||||||||||||||||||||||||||||||||||||||||||||||||||||||||||||||||||||||||||||||||||||||||||||||||||||||||||||||||||||||||||||||||||||||||||||||||||||||||||||||||||||||||||||||||||||||||||||||||||||||||||||||||||||||||||||||||||||||||||||||||||||||||||||||||||||||||||||||||||||||||||||||||||||||||||||||||||||||||||||||||||||||||||||||||||||||||||||||||||||||||||||||||||||||||||||||||
|---|---|---|---|---|---|---|---|---|---|---|---|---|---|---|---|---|---|---|---|---|---|---|---|---|---|---|---|---|---|---|---|---|---|---|---|---|---|---|---|---|---|---|---|---|---|---|---|---|---|---|---|---|---|---|---|---|---|---|---|---|---|---|---|---|---|---|---|---|---|---|---|---|---|---|---|---|---|---|---|---|---|---|---|---|---|---|---|---|---|---|---|---|---|---|---|---|---|---|---|---|---|---|---|---|---|---|---|---|---|---|---|---|---|---|---|---|---|---|---|---|---|---|---|---|---|---|---|---|---|---|---|---|---|---|---|---|---|---|---|---|---|---|---|---|---|---|---|---|---|---|---|---|---|---|---|---|---|---|---|---|---|---|---|---|---|---|---|---|---|---|---|---|---|---|---|---|---|---|---|---|---|---|---|---|---|---|---|---|---|---|---|---|---|---|---|---|---|---|---|---|---|---|---|---|---|---|---|---|---|---|---|---|---|---|---|---|---|---|---|---|---|---|---|---|---|---|---|---|---|---|---|---|---|---|---|---|---|---|---|---|---|---|---|---|---|---|---|---|---|---|---|---|---|---|---|---|---|---|---|---|---|---|---|---|---|---|---|---|---|---|---|---|---|---|---|---|---|---|---|---|---|---|---|---|---|---|---|---|---|---|---|---|---|---|---|---|---|---|---|---|---|---|---|---|---|---|---|---|---|---|---|---|---|---|---|---|---|---|---|---|---|---|---|---|---|---|---|---|---|---|---|---|---|---|---|---|---|---|---|---|---|---|---|---|---|---|---|---|---|---|---|---|---|---|---|---|---|---|---|---|---|---|---|---|---|---|---|---|---|---|---|---|---|---|---|---|---|---|---|---|---|---|---|---|---|---|---|---|---|---|---|---|---|---|---|---|---|---|---|---|---|---|---|---|---|---|---|---|---|---|---|---|---|---|---|---|---|---|---|---|---|---|---|---|---|---|---|---|---|---|---|---|---|---|---|---|---|---|---|---|---|---|---|---|---|---|---|---|---|---|---|---|---|---|---|---|---|---|---|---|---|---|---|---|---|---|---|
|
|||||||||||||||||||||||||||||||||||||||||||||||||||||||||||||||||||||||||||||||||||||||||||||||||||||||||||||||||||||||||||||||||||||||||||||||||||||||||||||||||||||||||||||||||||||||||||||||||||||||||||||||||||||||||||||||||||||||||||||||||||||||||||||||||||||||||||||||||||||||||||||||||||||||||||||||||||||||||||||||||||||||||||||||||||||||||||||||||||||||||||||||||||||||||||||||||||||||||||||||||||||||||||||||||||||||||||||||||||||||||||||||||||||||||||||||||||
making a surgical decision, whether one is dealing with a case of
idiopathic scoliosis, paralytic scoliosis, or lower limb osteotomy.
Children should always be weighed at consultations (2,3,7,15,16,18,19).
There may be striking morphologic changes from one year to the next. If
weight evaluation becomes an integral part of each consultation,
changes will become obvious and can be incorporated into the
orthopaedic specialist’s deliberations. A simple trend
in the increase in a boy’s weight is 18 to 20 kg at 5 years of age; 30 kg at 10 years of age; and 60 kg at 17 years of age (2,3).
Note that weight doubles between 10 and 17 years of age. At 5 years of
age, the child’s weight has reached 32% of the final normal weight (2,3,18) yet only 48% of the final normal weight is achieved at 10 years of age.
|
TABLE 2.3 USE OF THE MULTIPLYING COEFFICIENT IN DETERMINATION OF GROWTH REMAINING FOR GIRLS
|
|||||||||||||||||||||||||||||||||||||||||||||||||||||||||||||||||||||||||||||||||||||||||||||||||||||||||||||||||||||||||||||||||||||||||||||||||||||||||
|---|---|---|---|---|---|---|---|---|---|---|---|---|---|---|---|---|---|---|---|---|---|---|---|---|---|---|---|---|---|---|---|---|---|---|---|---|---|---|---|---|---|---|---|---|---|---|---|---|---|---|---|---|---|---|---|---|---|---|---|---|---|---|---|---|---|---|---|---|---|---|---|---|---|---|---|---|---|---|---|---|---|---|---|---|---|---|---|---|---|---|---|---|---|---|---|---|---|---|---|---|---|---|---|---|---|---|---|---|---|---|---|---|---|---|---|---|---|---|---|---|---|---|---|---|---|---|---|---|---|---|---|---|---|---|---|---|---|---|---|---|---|---|---|---|---|---|---|---|---|---|---|---|---|
|
|||||||||||||||||||||||||||||||||||||||||||||||||||||||||||||||||||||||||||||||||||||||||||||||||||||||||||||||||||||||||||||||||||||||||||||||||||||||||
 |
|
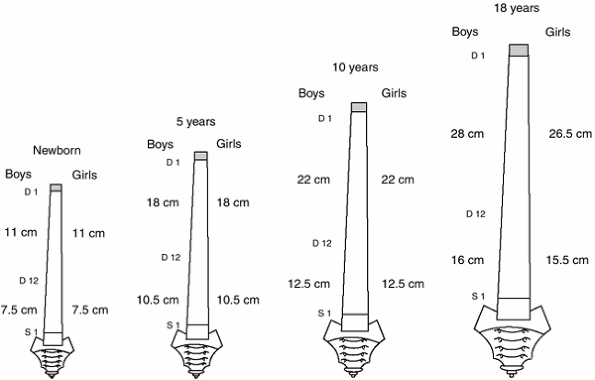
Figure 2.2
The proportions of the body as they change during growth. The head and trunk together constitute the sitting height; the segment below is the subischial leg length. At skeletal maturity, the sitting height makes up 52% of the standing height, and the subischial height makes up 48% of the standing height. (From Lowrey GH. Growth and development of children, 6th ed. Chicago, IL: Mosby Year Book, 1973, with permission.) |
scoliosis brace may no longer correct the spinal curve as it did
before. Excess weight of 10% or more may also induce symptoms in a hip
deformed by Perthes disease or limit a child’s ability to walk or run.
A low weight, on the other hand, can explain the delay in the onset of
menarche
because girls generally need to attain a weight of 40 kg for menarche
to occur. If a patient’s excess weight or obesity aggravates an
orthopaedic condition, it is useful to have objective measurements to
document the problem for the patient and his or her parents. A
generally accepted estimate of body fat is expressed in Quetelet body
mass index (BMI): weight (kg)/height(m2) (37). Using this index, 20 to 25 kg per m2 is normal, 25 to 30 kg per m2 is moderate obesity, 30 to 40 kg per m2 is major obesity, and more than 40 kg per m2 is morbid obesity.
|
TABLE 2.4 USE OF THE MULTIPLYING COEFFICIENT IN DETERMINATION OF GROWTH REMAINING FOR BOYS
|
|||||||||||||||||||||||||||||||||||||||||||||||||||||||||||||||||||||||||||||||||||||||||||||||||||||||||||||||||||||||||||||||||||||||||||||||||||||||||
|---|---|---|---|---|---|---|---|---|---|---|---|---|---|---|---|---|---|---|---|---|---|---|---|---|---|---|---|---|---|---|---|---|---|---|---|---|---|---|---|---|---|---|---|---|---|---|---|---|---|---|---|---|---|---|---|---|---|---|---|---|---|---|---|---|---|---|---|---|---|---|---|---|---|---|---|---|---|---|---|---|---|---|---|---|---|---|---|---|---|---|---|---|---|---|---|---|---|---|---|---|---|---|---|---|---|---|---|---|---|---|---|---|---|---|---|---|---|---|---|---|---|---|---|---|---|---|---|---|---|---|---|---|---|---|---|---|---|---|---|---|---|---|---|---|---|---|---|---|---|---|---|---|---|
|
|||||||||||||||||||||||||||||||||||||||||||||||||||||||||||||||||||||||||||||||||||||||||||||||||||||||||||||||||||||||||||||||||||||||||||||||||||||||||
outlined the concept of the “multiplying coefficient,” which can be
applied to growth measurements in children at any age. This has also
been described by Payle et al. (42). It is easy
to calculate this coefficient, which is obtained by considering the
percentage of growth that has been attained. For example, once a child
has reached 40% of his or her expected adult standing height, the
multiplying coefficient can be calculated as 100/40 = 2.5 The
multiplying coefficient can be applied to all biometric data—standing
height, sitting height, subischial leg length, and length of the femur,
tibia, humerus, radius, and ulna (Tables 2.3 and 2.4).
of gestation, the systems are busy organizing themselves and are
developing at a brisk pace (43,44,45,46).
During this period, the fetus makes daily progress, so that when the
infant is born, it has reached a weight six million times that of the
original egg. By the second month of life, the sitting height is
increasing at a rate of 1 millimeter (mm) daily, which subsequently
increases to 1.5 mm per day. Were this rate of growth to continue until
the age of 10 years, the child would ultimately stand 6 m tall (2,3).
and turns into a miniature adult. At the end of the second trimester of
gestation, the fetus has reached 70% of its expected length at birth
(it measures 30 cm at this stage) but has achieved no more than 20% of
the expected birth weight (it weighs approximately 800 grams [g]).
During the third trimester, the fetus gains weight at the highest rate
(700 g per month). This means that various stages of
growth do not occur simultaneously during intrauterine life. Length increases steadily and rapidly during the first 6 months in utero, whereas weight gain is most rapid during the final 3 months of gestation (Fig. 2.2).
 |
|
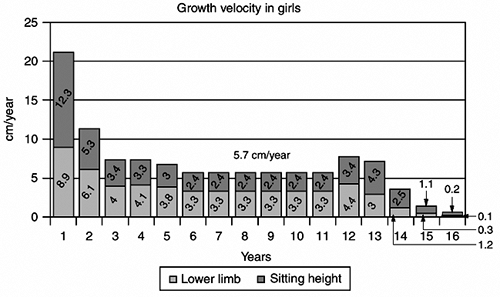
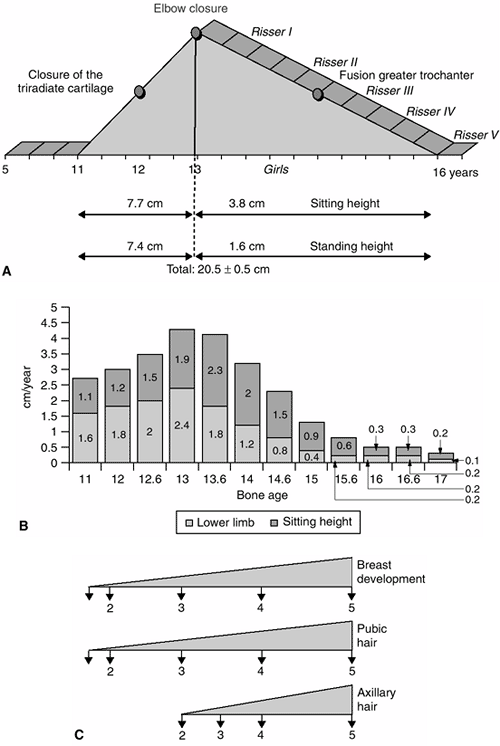
Figure 2.3
Growth velocity in girls. The gain in standing height between birth and 5 years is 55 centimeters (cm)—approximately 27.5 cm in sitting height and 27.5 cm in lower limb. Between the age of 6 years and the beginning of puberty, the gain in standing height is 34 cm—14 cm in sitting height and 20 cm in lower limb. During puberty, the gain in standing height is 20.5 cm—11.5 cm in sitting height and 9 cm in lower limb. |
follow the growth of the fetus and to detect even the slightest
abnormality (47,48). It
can be anticipated that many orthopaedic conditions characterized by
disproportionate or abnormal growth will be diagnosed prenatally.
the child. After birth, not only does the overall rate of growth vary
at different ages, but the rates at which various segments of the body
grow also differ. For example, during the first 5 years of life,
sitting height and subischial leg length increase at about the same
rate; from age 5 years to puberty, the sitting height accounts for one
third of the gain and the subischial leg length accounts for two
thirds; from puberty to maturity, the ratio is reversed, with the
sitting height accounting for two thirds of the gain in height and the
subischial leg length accounting for one third (Figs. 2-3 and 2-4).
The extent of increase in sitting height and subischial leg length for
boys and girls of various ages are shown in Figures 2.5 and 2.6.
 |
|
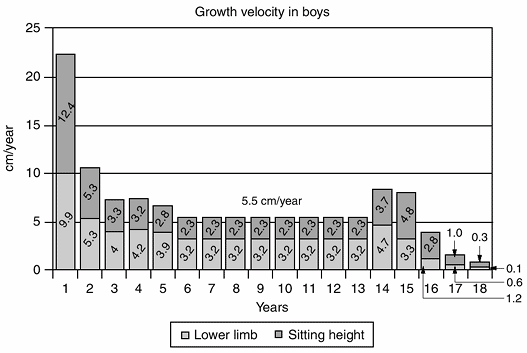
Figure 2.4
Growth velocity in boys. The gain in standing height between birth and 5 years is 54 centimeters (cm)—27 cm in sitting height and 27 cm in lower limb. Between the age of 6 years and the beginning of puberty, the gain in standing height is 44 cm—18.5 cm in sitting height and 25.5 cm in lower limb. During puberty, the gain in standing height is 22.5 cm—12.5 cm in sitting height and 10 cm in lower limb. |
cm) is 30% of the final height. By the age of 5 years, the standing
height increases to 108 cm, which is double the birth height and 62% of
the final height. The first year of life sees particularly vigorous
growth rates, with the infant’s height increasing by 22 cm (2,3).
This means that the height gain during a single year is as great as it
is during the entire surge of puberty. After the age of 1 year, the
growth rate starts to slow down but remains strong, with the infant
growing another 11 cm between 1 and 2 years of age, and 7 cm between 3
and 4 years of age (2,3).
approximately 34 cm, which is roughly two thirds of the standing height
and 37% of the final sitting height. By the age
of
5 years, the sitting height increases to 60 cm, approximately 66% of
the final sitting height, with only another 26 to 30 cm to grow (10,49).
This information is useful in anticipating the effects of deformity and
the consequences of arthrodesis in spinal deformity in young patients (10).
almost identical to that of sitting height. At birth, the lower limbs
are relatively short (only 18 cm) compared to the trunk. By the age of
5 years, the subischial leg length measures 45 cm (a gain of 27 cm),
representing about 60% of the final length. After age 5 years, the
subischial leg length increases by approximately another 35 cm in boys
and 29 cm in girls, before growth ceases; this is a considerable amount
of growth but less than what occurred in the first 5 years (2,3). These figures indicate a need for great caution whenever predictions are being made concerning inequality of limb length.
 |
|
Figure 2.5 A: Pubertal peak in girls. B:
Growth velocity in girls. Note the pubertal peak (from 11 years to the end of growth) between the ascending side from 11 to 13 years of age and the descending side after 13 years of age. C: The corresponding Tanner stages. (Adapted from Diméglio A, Bonnel F. Le rachis en croissance. Paris: Springer-Verlag, 1990, with permission.) |
 |
|
Figure 2.6 A: Pubertal peak in boys. B:
Growth velocity in boys. Note the pubertal peak (from 13 years to the end of growth) between the ascending side from 13 to 15 years of age and the descending side after 15 years of age. C: The corresponding Tanner stages. (Adapted from Diméglio A, Bonnel F. Le rachis en croissance. Paris: Springer-Verlag, 1990.) |
proportions change. The cephalic end of the body becomes relatively
smaller, whereas the subischial leg length increases (Figs. 2-3 and 2-4).
It is now readily appreciated why any congenital limb deformity or
chondrodystrophy has such a dramatic onset during this period of rapid
growth. Similarly, any limb paralysis occurring during the first years
of life will usually result in severe shortening, not only because so
much growth remains but also because the ill effects of the paralysis
are felt the most when growth is expected to be extremely rapid.
phenomenon but also a volumetric one. At birth, weight is between 3000
and 3500 g, which is 5% of the final figure.
At
5 years, the weight averages 18 to 20 kg, which is 32% of the final
adult weight. In 5 years, the weight gain is 15 to 17 kg. Birth weight
triples in a single year and quadruples by the age of 3 years.
Chest morphology has undergone dramatic changes. The most precious
growth is the neurologic growth: the head circumference is 35 cm at
birth and increases by 12 cm in the first year, reflecting the growth
of the nervous system. Head circumference should be measured at every
physical examination during the first 2 years after birth and twice a
year up to 5 years. Any neurologic assault on the infant during this
period can have serious effects on neurologic development.
years of bone age in girls and 13 years of bone age in boys), there is
a marked deceleration in growth, with standing height increasing at
approximately 5.5 cm per year (Figs. 2-3 and 2-4). About two thirds of this growth (3.2 cm) occurs in the lower limb and about one third (2.3 cm) occurs in the sitting height (10).
The trunk is now growing at a slower rate, whereas the lower limbs are
growing faster than the trunk, thereby altering the proportions of the
body (Fig. 2.2). During this period, in boys,
standing height will increase by 27% (approximately 44 cm), sitting
height by 20% (approximately 18 cm), and subischial leg length by 32%
(approximately 26 cm); in girls, standing height will increase by 22%
(approximately 34 cm), sitting height by 17% (approximately 14 cm), and
subischial leg length by 28% (approximately 20 cm) (Figs. 2-5 and 2-6).
growth remains to be attained in standing height (12.5 cm in sitting
height and 10 cm in lower limb) in the case of boys and 20.5 cm (11.5
cm in sitting height and 9 cm in lower limb) in the case of girls. From
age 5 years to the beginning of puberty, the average weight gain is
about 2.5 kg per year (Figs. 2-5 and 2-6).
At 10 years of age, the weight represents about 50% of the final
weight. In contrast, the standing height at this age is 78% of the
final standing height in the case of boys and 83% in the case of girls (2,3,15,16,17,19).
start anticipating puberty at the age of 10 years in girls and 12 years
in boys. The acceleration in growth velocity best characterizes the
beginning of puberty. From a clinical viewpoint, puberty will be
recognized by a combination of factors other than growth: sexual
development, chronologic age, and bone age. After the age of 11 years,
the growth patterns of boys and girls proceed differently. On average,
girls will experience the onset of puberty at 11 years (bone age), and
boys at 13 years (bone age). Puberty and its accompanying rapid growth
is a period of great importance to the orthopaedic surgeon. It is
therefore important to recognize the period just before puberty (2,3,12,13,15,16,17,18,19,21,34,50,51,52,53,54).
-
dramatic increase in stature (2,3)
-
change in the proportions of the upper and lower body segments (11,13,37)
-
change in overall morphology: biachromial diameter, pelvic diameter, fat distribution, and so on (36)
-
development of secondary sexual characteristics (18,19,50,51)
to 17 years in boys) there is a dramatic increase in the growth rate.
However, during this period, the growth is far more noticeable in the
trunk than in the lower limbs: two thirds of the growth goes toward
increasing sitting height and only one third is toward increasing
subischial leg length.
height. On average, boys are between 12 and 15 cm taller than girls.
This is accounted for by two factors. First, boys have approximately 2
years of growth more than girls. Second, boys have a slightly greater
increase in the rate of growth during puberty than girls do, accounting
for approximately 2 cm of additional height.
approximately 1 cm per month. At the onset of puberty, boys have 13%
(±1%) of their remaining standing height to grow. This is approximately
22.5cm (±1cm) made up of 12.5 cm in sitting height and 10 cm in
subischial leg length. Girls have 12% (±1%) of their standing height to
grow. This is approximately 20.5cm (±1cm) made up of 11.5 cm in sitting
height and 9 cm in subischial leg length.
between 13 and 15 years of bone age in boys and between 11 and 13 years
of bone age in girls (2,3,6,18,37,50,51,53).
After bone age 13 years in girls and 15 years in boys, there is a
considerable decrease in the annual velocity of height gain (Figs. 2.3, 2.4, 2.5 and 2.6).
The lower limbs stop growing rapidly; the total remaining growth is 5.5
cm, about 4 cm in the sitting height and about 1.5 cm in the lower
limb. This variation in growth velocity is an extremely important
factor to consider in the treatment of many disorders, especially
scoliosis and limb-length discrepancy.
view of the growth phenomenon. Precise evaluation of the
characteristics of puberty, using the bone age assessment, the Tanner
classification, the onset of menstruation, the Risser sign, and the
annual height velocity, is something that needs to be undertaken with a
great deal of care and consideration. One of the major problems with
using only the onset of menarche and the Risser sign is that they occur
after the growth associated with puberty has begun to slow (3).
course of puberty; the first appearance of pubic hair, the budding of
the nipples, and the swelling of the testes are the first physical
signs to signal the onset of puberty (2,3,18,50,51). The first physical sign of puberty in boys, testicular growth in 77% (37),
occurs, on average, 1.7 years before the peak height velocity and 3.5
years before attaining adult height. The bone age will be approximately
13 years at the onset of puberty; the Risser sign is 0 and the
triradiate cartilage is open.
This averages 11 years in bone age. The Risser sign is still 0, and the
triradiate cartilage is still open at the onset of puberty. Menarche
occurs about 2 years after breast budding, and final height is usually
achieved 2.5 to 3 years after menarche. After menarche, girls will gain
the final 5% of their standing height, about 3 to 5 cm (10,35,54). The appearance of axillary hair, although variable, occurs after the peak of the pubertal growth diagram.
Puberty may be accelerated and growth can end more quickly than usual,
catching the unwary physician off guard. In fact, it has been
demonstrated that it is not uncommon to see an acceleration of the bone
age during puberty (37).
Even if one indicator is missing or does not match the other, it is
still possible to have a good idea of where the child is on his or her
own path through puberty (2,3,10).
By plotting the gains in standing height and sitting height every 6
months, a picture of the period of puberty is developed. It is also
easy to divide this into two parts. The first phase (i.e., the
ascending limb of the growth velocity curve) is characterized by an
increase in the velocity of growth and is the major portion of the
pubertal growth spurt. The second phase (i.e., the descending phase of
the growth velocity curve) is characterized by a slowing of the rate of
growth (2,3,10).
ascending phase, which corresponds to the acceleration in the velocity
of growth. This phase lasts 2 years, from approximately 11 to 13 years
of bone age in girls and from 13 to 15 years of bone age in boys. The
gain in standing height in girls during this phase is about 15.1 cm,
made up of 7.7 cm in sitting height and 7.4 cm in subischial leg
length. The gain in standing height in boys during this phase is about
16.5 cm, made up of 8.5 cm in sitting height and 8 cm in subischial leg
length. During this first phase of the pubertal growth spurt, the
increase in sitting height contributes 53% and the increase in
subischial leg length contributes 47%. Therefore, more growth comes
from the trunk than from the legs during this phase of growth (10).
The peak height velocity occurs on the ascending side of the growth
velocity curve. It does not occur at just one point on the curve but
takes place during 2 years. It can be roughly identified by accurate
assessment of standing height and sitting height at 6-month intervals.
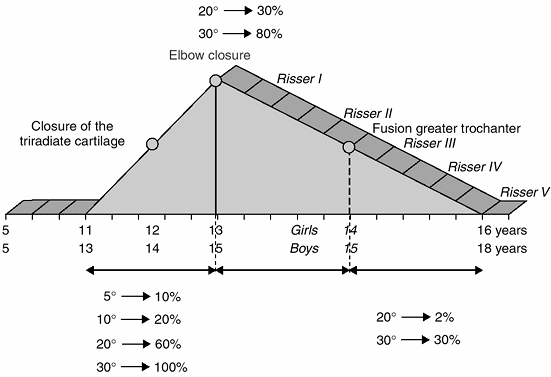
ascending phase of the pubertal growth velocity diagram. This closure
corresponds to an approximate bone age of 12 years in girls and 14
years in boys. After closure of the triradiate cartilage, there is
still a considerable amount of growth remaining: greater than 12 cm of
standing height in girls and more than 14 cm in boys (3).
descending side, which corresponds to the deceleration in the velocity
of growth. The closure of the elbow (discussed in subsequent text)
divides the ascending and descending phases of puberty (10).
The descending phase lasts 3 years, from 13 to 16 years of bone age in
girls and from 15 to 18 years of bone age in boys. During this phase,
both boys and girls will gain about 6 cm in standing height, with 4.5
cm attained from an increase in sitting height and 1.5 cm attained from
an increase in subischial leg length. During this phase, the increase
in sitting height contributes 80% of the gain in the standing height (10).
apophysis, on the descending phase of the growth curve, when the rate
of growth is slowing. This decrease in the rate of growth is usually
between bone ages of 13 and 13.5 years and corresponds to Risser sign I
on the iliac apophysis (34,35,55,56,57).
After this stage, the average girl will gain an additional 4 cm of
sitting height and 0.6 cm of subischial leg length. The menarche is not
as precise as many other indicators during puberty. Forty-two percent
of girls experience menarche before Risser I, 31% at Risser I, 13% at
Risser II, 8% at Risser III, and 5% at Risser IV (7).
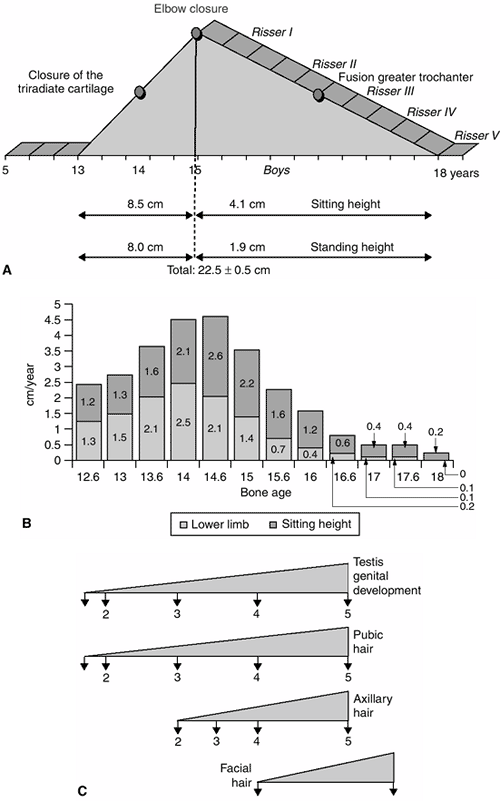
three micropeaks: the first peak involves the lower limb at the very
beginning of this period, and the second peak involves the trunk (these
two peaks are on the ascending phase of the growth velocity curve); the
third peak involves growth of the thorax and occurs during the
descending phase of the curve (Fig. 2.7).
At the beginning of puberty, the average weight is 40 kg for boys and
33 kg for girls. At skeletal maturity, the average weight for boys is
65 kg (a gain of 25 kg) and the average weight for girls is 56 kg (a
gain of 23 kg). During the growth spurt of puberty, the average gain in
weight each year is 5 kg (2).
 |
|
Figure 2.7 The three micropeaks during puberty: lower limb, sitting height, and thorax peak (at Risser I).
|
significance. Everything depends on bone age. Personal data indicate
that about 50% of children have a bone age that is significantly
different from their chronologic age. Delayed bone age is
characteristic of some disorders: Perthes disease (58,59), severe cerebral palsy and rickets with nephropathy, Ollier disease, and multiple hereditary osteochondromatosis (60). A narrow window of bone age has been described by Loder et al. (61) in slipped capital femoral epiphysis (62).
Whether it is a case of Legg-Calvé-Perthes disease, limb-length
discrepancy, or chondrodystrophy, all reasoning, analyses, forecasting,
and decision making should be based on bone age.
The younger the child, especially before puberty, the more difficult it
is to determine future growth, and the more likely it is for errors to
be made. In addition, children are often bone age “mosaics.” Bone age
determinations carried out in the hands, elbows, pelvis, and knees will
not always agree with one another (2,3,10).
and with too little information. The standard deviations for
determining bone age must be understood, as well as the nuances of what
to look for in the interpretation of the radiograph. When using a
particular method [e.g., the Greulich and Pyle atlas (20)],
it is important to read the entire book to understand what to look for
and to know the standard error, rather than simply comparing
radiographs. If there is a major decision to be made, it is better to
have two interpretations of the child’s bone age and to enlist the
support of pediatric radiologists with experience in bone age
determination (66,67).
that four radiologists’ interpretations of skeletal age differed by
more than 2 years in 10% of patients. Carpenter and Lester (65)
evaluated bone age in children younger than 10 years. They showed that
taking separate readings of the distal radius and ulna, the carpal
bones, the metacarpals, and the phalanges could magnify these errors
and that the ages of the carpal bones and the distal radius and ulna
often lag behind the ages of the metacarpals and phalanges. In
Legg-Calvé-Perthes disease, the discrepancy in maturation between
carpal bone and metacarpal bone is frequent (59). This means that excessive haste in reading the bone age can result in fatal strategic errors.
assessment of skeletal maturity: atlas, sum of scores, and statistical
combination of scores. Knowledge of these methods and their limitations
is important for the orthopaedist, especially in difficult cases (20,68,69,70,71). The Greulich and Pyle atlas (20)
is the most familiar and most commonly applied approach and involves
qualitatively matching the subject’s hand and wrist x-ray against a
series of gender-specific standards. This atlas is based on a
collection of radiographs of children born between 1917 and 1942. In
comparing this atlas with its French counterpart, the Sempé and Pavia
atlas (22), we learned that there is no major
difference between these two atlases. Therefore, the Greulich and Pyle
atlas is sufficient for clinical decision making in orthopaedic
practice when used by physicians knowledgeable in the method. One of
the shortcomings in using the Greulich and Pyle atlas is that there are
few changes in the hand during the critical time of puberty (ascending
side of the pubertal growth velocity diagram).
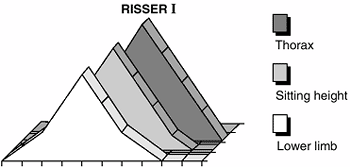
This method is the scoring system that evaluates the anteroposterior
and lateral views of the elbow and assigns a value to the epiphyses.
This value is then plotted on a chart to give the bone age. Four
ossification centers are taken into consideration: condyle and
epicondyle, trochlea, olecranon, and radial epiphysis. This method is
reliable and is based on the skeletal maturation of the elbow, which
occurs during a 2-year period corresponding with the ascending phase of
the growth velocity curve. Therefore, it is extremely helpful in boys
aged 13 to 15 years and in girls aged 11 to 13 years, a period in which
many of the clinical decisions involving future growth are made (e.g.,
epiphysiodesis and spinal arthrodesis). In addition, it shows good
correlation with the Greulich and Pyle atlas but is much easier to use.
elbow are wide open, but 2 years later, when the peak velocity of the
pubertal growth spurt is reached and growth begins to slow, they are
all completely closed. This complete closure occurs 6 months before
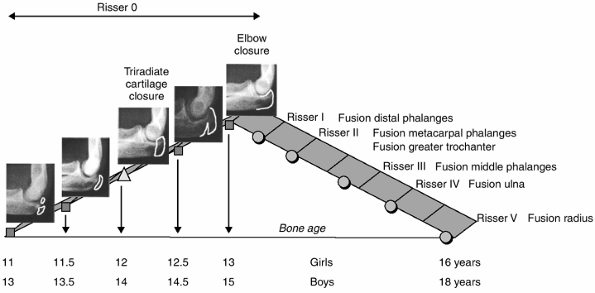
Risser I. In the method by Sauvegrain, the olecranon is the bone that
shows the most characteristic and clear-cut sequences during the first
2 years of puberty (10). At the beginning of puberty (at bone age 11 years in girls and 13 years in boys), two ossification centers appear (Fig. 2.9).
Six months later (at bone age 11.5 years in girls and 13.5 years in
boys), they merge to form a half-moon shape. At bone age 12 years in
girls and 14 years in boys, the olecranon apophysis has a rectangular
appearance. Six months later (at bone age 12.5 years in girls and 14.5
years in boys), the olecranon apophysis begins to fuse with the ulna, a
process that takes another
6
months, being completed by the bone age of 13 years in girls and 15
years in boys. In our clinical practice experience, the olecranon alone
can give rapid and valuable information about bone age, but the whole
system is required for more detailed determination. The Sauvegrain
method is more accurate in itself because it allows differentiation of
bone age in semesters, which is not true of the Greulich and Pyle atlas
for the considered time of puberty.
 |
|
Figure 2.8
The Sauvegrain method of assessing skeletal age. In girls, for example, 16 points mean 10.5 years of age and 18 points in boys, for example, mean 13 years of age. |
is a sophisticated approach, scoring hand and wrist radiographs and
using a computer program. Both of these methods are time consuming and
not useful in daily practice (69).
from pelvic radiographs is based on nine indicators, three of which are
useful during puberty: the triradiate cartilage, the greater
trochanter, and the Risser sign. The triradiate cartilage closure
occurs on the ascending side of the pubertal growth diagram at bone age
12 years in girls and 14 years in boys. After its closure, a
significant amount of growth in standing height still remains: 13 cm in
girls and 14 cm in boys. The greater trochanter closure occurs on the
descending phase of the pubertal growth diagram, at bone age 14 years
in girls and 16 years in boys (that is, between Risser II and Risser
III).
The sign appears on the radiograph of the pelvis, which is often
studied during the assessment of this disorder, thereby obviating the
need for an additional radiograph. The duration of excursion of the
Risser sign is also variable, and may range from 1 to 3 years (55,56). However, the value of this sign in accurate decision making has been questioned. Little et al. (76)
concluded that, all things considered, it is better to rely on
chronologic age. Although this author does not agree with their
conclusions, when important decisions are made the Risser sign should
be supplemented with the bone age, as
determined by the method of Greulich and Pyle (20). Figure 2.10 shows these correlations.
 |
|
Figure 2.9
A simplification of the Sauvegrain method using only the stages of closure of the olecranon apophysis and its relationship to the pubertal growth diagram and the Risser sign. At 11 years in girls and 13 years in boys, double ossific nucleus. At 11.5 years in girls and 13.5 years in boys, semi-moon shape. At 12 years in girls and 14 years in boys, quadrangular shape. At 12.5 years in girls and 14.5 years in boys, beginning of fusion. At 13 years in girls and 15 years in boys, complete fusion. |
growth spurt, which corresponds to the ascending limb of the pubertal
growth diagram. However, this period of Risser 0 is important in
decision making in many conditions; therefore, it is important to have
more precise markers of the stage of puberty (growth) during this
period, such as annual growth velocity, elbow maturation, and changes
in morphology of the triradiate cartilage. Risser 0 gives little
information other than to indicate that the peak of the growth velocity
curve has not been reached. The author has recommended dividing this
period of the ascending phase of the pubertal growth diagram,
characterized by Risser 0, into three periods, based on the triradiate
cartilage and the closure of the olecranon apophysis: triradiate
cartilage open, triradiate cartilage closed but olecranon open, and
olecranon closed (10) (Figs. 2-10 and 2-11).
of the pubertal growth velocity diagram. It generally appears after the
elbow closure (Fig. 2.11), when the epiphyses of the distal phalanges (II, III, IV, and V) of the hand fuse (Fig. 2.12).
The rate of growth in sitting height and standing height decreases
abruptly. Axillary hair generally appears during this period (Figs. 2-5 and 2-6).
It generally appears when the greater trochanteric apophysis unites
with the femur. When the proximal phalangeal epiphyses fuse in the hand
(Fig. 2.12), there is approximately 3 cm left to grow in sitting height and no more growth of the lower limb.
and 16.5 years in boys. The phalangeal epiphyses of P1 and P2 fuse
during this period (Figs. 2-10 and 2-12); the greater trochanter is closed; and 1 year of growth and an increase of 2 cm in sitting height still remain.
and 17 years in boys. The distal epiphysis of the ulna is united to the
shaft. At this stage, the remaining growth in sitting height is 1 cm (Fig 2.10).
that does not provide much information to the clinician. The distal
radial epiphysis generally unites around the time of Risser V. The
iliac apophysis may fuse at age 22 or 23 years, but in some cases it
never fuses.
is meaningless as an isolated parameter. It should be constantly
measured against chronologic age, the rate of annual growth in standing
height, and secondary sexual characteristics.
indication of spinal growth. The spine makes up 60% of the sitting
height, whereas the head represents 20%, and the pelvis represents 20% (9,10,77).
If we accept the fact that there are at least three growth zones per
vertebra (sometimes four), the resulting morphology of the spinal
column is
the
product of 100 growth plates. The pattern of growth in the posterior
arch, where closure is linked, in particular, to the presence of the
neural stem, differs from that seen in the body of the vertebra, which
behaves like a long bone (9,10,23,78).
 |
|
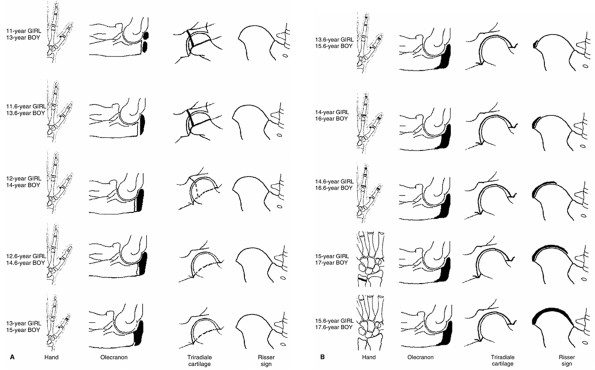
Figure 2.10 Ascending (A) and descending (B)
side of puberty in girls and boys in relation to skeletal maturation of the hand, the elbow, the triradiate cartilage, and the Risser sign. |
newborn, one would find very little morphologic variation between them.
The process by which cervical, thoracic, and lumbar vertebrae acquire
their individual identities is gradual. In the vertebral body,
ossification first appears in the dorsal region; from this hub, the
process of ossification radiates to the cranial and caudal parts of the
spine. The process of ossification is extremely slow, and does not
finish until the 25th year of life.
smaller than the thoracic and cervical vertebrae. However, during the
first years of growth, they grow more rapidly. Between 3 and 15 years
of age, the lumbar vertebrae and their discs increase in size by about
2 mm per year, whereas the thoracic vertebrae and their discs increase
by 1 mm.
The
discs account for approximately 30% of the height of the spinal segment
at birth. At maturity, this proportion decreases to 25%, with the discs
constituting 22% of the cervical spine, 18% of the thoracic spine, and
35% of the lumbar spine (9,10).
not grow at the same rate. In the thoracic region, the posterior
components grow at a faster pace than their anterior counterparts. The
reverse occurs in the lumbar region. Growth potential therefore varies
from one level to the next, differing from anterior to posterior. In
addition, as the vertebrae develop, there is a constant remodeling of
the anatomic organization of the spine; for example, the articular
apophyses change in both morphology and direction (10,29).
and adulthood. At birth, the vertebral column is approximately 24 cm
long. In the newborn, only 30% of the spine is ossified. There is
little substantial difference in morphology between one vertebra and
another. The length of a thoracic
vertebra is about 7.6 mm and that of a lumbar vertebra is about 8 mm (9,10).
The average adult spine is approximately 70 cm long in men, with the
cervical spine measuring 12 cm, the thoracic spine 28 cm, the lumbar
spine 18 cm, and the sacrum 12 cm. The average female spine is
approximately 65 cm long at maturity.
 |
|
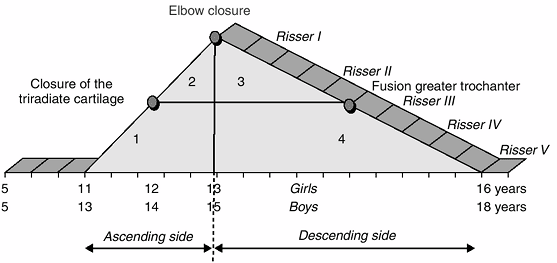
Figure 2.11
The pubertal growth diagram can be divided into four zones. First zone: ascending side, triradiate cartilage open, bone age between 11 and 13 years in girls and between 13 and 15 years in boys, Risser 0. Second zone: ascending side, triradiate cartilage closed, bone age between 11 and 13 years in girls and between 13 and 15 years in boys, Risser 0. Third zone: descending side, elbow closed but greater trochanter not fused, bone age between 13 and 16 years in girls and between 15 and 18 years in boys, Risser I–II. Fourth zone: descending side, elbow closed and greater trochanter fused, bone age between 13 and 16 years in girls and between 15 and 18 years in boys, Risser III–V. |
 |
|
Figure 2.12
The correlation between the closure of the physes in the hand and the Risser sign that occurs in 80% of adolescents. The thumb is a special zone. The distal phalanx of the thumb fuses just as the olecranon apophysis closes, or at Sauvegrain of 27. This is bone age 13 years in girls and 15 years in boys. The Risser sign is still 0. The sesamoid ossifies at the beginning of puberty. |
grow about 9 cm, to reach the adult length of 12 to 13 cm. The length
of the cervical spine will nearly double by 6 years of age. It will
gain an additional 3.5 cm during the pubertal growth spurt. The
cervical spine represents 22% of the C1-S1 segment and 15% to 16% of
sitting height (9,10).
location, typically decreasing in width from C1 to C7 or from C1 to C3,
and then widening slightly. These differences are important in the
clinical setting because the room available for the spinal cord can be
very consequential. It should be remembered that, regardless of the
size of the child (e.g., in dwarfing conditions), the spinal cord will
attain the usual adult diameter. The average width of the cervical cord
is 13.2 mm, and the average anteroposterior depth is 7.7 mm (9,10).
Therefore, the transverse and sagittal diameters of the cervical canal
are important. In the adult, at C3, the normal transverse diameter is
27 mm and the average sagittal diameter is approximately 19 mm (9,10).
frequent disorders of the spine during growth originate in this
segment. The T1-S1 segment measures about 19 cm at birth, and 45 cm at
the end of growth in the average man and 42 to 43 cm in the average
woman (9,10,77).
This segment makes up 49% of the sitting height at maturity. Knowledge
of the effects of arthrodesis on this segment of the spine requires
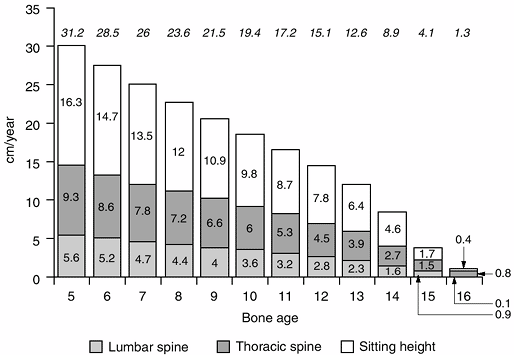
precise knowledge of the growth remaining at various ages (7) (Figs. 2.13, 2.14 and 2.15).
reach a length of about 28 cm in boys and 26 cm in girls at the end of
growth. Its length more than doubles between birth and the end of the
growth period. The growth of the
thoracic
segment has a rapid phase from birth to 5 years of age (7 cm), a slower
phase from 5 to 10 years of age (4 cm), and rapid growth through
puberty (7 cm) (9,10).
 |
|
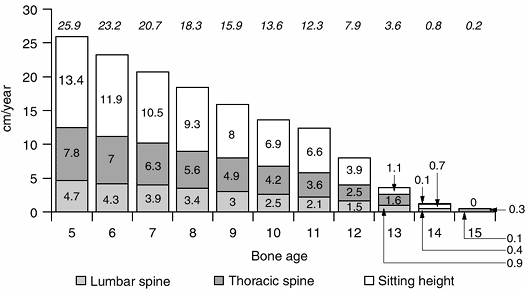
Figure 2.13 The remaining sitting height, and lumbar and thoracic spine in girls. Lumbar spine (a) is shown as the bottom bars, thoracic spine (b) is the middle bar, and sitting height (lumbar spine + thoracic spine) (c)
is the top bar. Noted at the top of the diagram is the total remaining growth at various ages (a + b + c) (Adapted from Diméglio A, Bonnel F. Le rachis en croissance. Paris: Springer-Verlag, 1990, with permission.) |
so a single thoracic vertebra and its disc represents 2.5% of the
sitting height. By knowing the amount of growth that each vertebra
contributes to the final height, the effect of a circumferential
arthrodesis, which stops all growth in the vertebrae and discs, can be
calculated (Table 2.5).
deficit (2.5% of sitting height for each thoracic vertebra), which is
about 0.8% of the remaining sitting height (Figs. 2.13, 2.14, 2.15 and 2.16).
|
TABLE 2.5 TIMING FOR SPINAL ARTHRODESIS
|
||||
|---|---|---|---|---|
|
 |
|
Figure 2.14 The remaining sitting height, and lumbar and thoracic spine in boys. Lumbar spine (a) is shown as the bottom bars, thoracic spine (b) is the middle bar, and sitting height (lumbar spine + thoracic spine) (c)
is the top bar. Noted at the top of the diagram is the total remaining growth at various ages (a + b + c) (Adapted from Diméglio A, Bonnel F. Le rachis en croissance. Paris: Springer-Verlag, 1990, with permission.) |
lumbar or the cervical canals. At the age of 5 years, this canal has
attained its maximum volume, and is wide enough to permit the entry of
the little finger of an adult hand. The average of the transverse and
anteroposterior diameters at T7 is approximately 15 mm (Fig. 2.17).
at birth, and it grows to approximately 16 cm in men and 15.5 cm in
women. As in the thoracic spine, growth is not linear: there is rapid
growth from 0 to 5 years of age (gain of about 3 cm); slow growth from
5 to 10 years of age (gain of about 2 cm); and rapid growth again from
10 to 18 years of age (gain of about 3 cm). The height of the lumbar
spine doubles between birth and maturity (9,10).
and a single lumbar vertebra and its disc account for 3.5% of the
sitting height. Values for the remaining growth of the lumbar segment
at various ages are given in Figures 2.13 and 2.14. A posterior
vertebral arthrodesis results in a
deficit of only one third of this value, that is, slightly more than 1% of the remaining sitting height (9,10).
 |
|
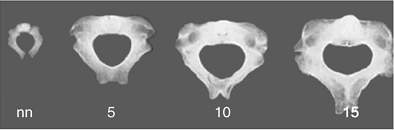
Figure 2.15
The spinal canal. At age 5 years, the spinal canal has grown to 95% of its definitive size. A perivertebral arthrodesis is possible at age 5 years. |
 |
|
Figure 2.16 The average length of the thoracic (lightly shaded) and lumbar spinal segments of the spine at various ages.
|
reached 90% of its final height but only 60% of its final volume. The
medullar canal in the lumbar spine is wider than that in the thoracic
spine. At skeletal maturity, the dimensions of the canals are such that
the adult thumb can be introduced into the cervical canal, the
forefinger into the thoracic canal, and the thumb into the lumbar
canal. At birth, the spinal cord ends at L3, and at maturity, it ends
between L1 and L2.
The thoracic circumference is a rough but valuable indicator of this
fourth dimension of spinal growth. The thorax has a circumference of 32
cm at birth, and it will grow 56 cm in boys and 53 cm in girls, that
is, to almost three times its birth size.
size at birth, 63% at the age of 5 years, 73% at 10 years, 91% at 15
years, and 100% at 18 years. From birth to the age of 5 years, the
thoracic circumference grows exponentially and increases by 24 cm. From
the ages of 5 to 10 years, the increase is slower; the thoracic
circumference is 66 cm at the age of 10 years, which means that its
growth is only 10 cm in 5 years. At that stage, it is at 73% of its
final dimension. Another spurt occurs between the ages of 10 and 18
years, particularly during puberty. The thoracic circumference then
increases by 23 cm, that is, as much as between birth and 5 years.
These two measures do not grow simultaneously, especially during
puberty. At age 10 years, the thoracic circumference is at 74% of its
final size, whereas the sitting height is almost at 80% of the expected
measurement at the end of growth.
be measured with obstetrical calipers, are two more parameters to
assess the growth of the thorax. At the end of growth, the thorax has
an anteroposterior diameter of about 21 cm in boys and 17 cm in girls;
that is, it has increased by 9 cm since birth. The transverse diameter
is 28 cm in boys and 24 cm in girls at the end of growth; that is, it
has increased by 14 cm since birth. The transversal diameter makes up
30% of the sitting height and the anteroposterior diameter constitutes
20%. The sum of the measurements of the transverse and anteroposterior
diameters of the thorax should equal 50% or more of the sitting height (10).
 |
|
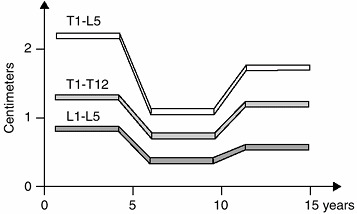
Figure 2.17
Growth of the spinal segments. These images represent the average amount of growth in the various spinal segments. For example, the T1-L5 segment grows about 2.1 centimeters (cm) each year from birth to age 5 years, 2.1 cm each year from ages 5 to 10 years, and about 1.5 cm each year from ages 10 to 15 years. |
of 5 years, and 50% at 10 years. It doubles between the age of 10 years
and skeletal maturity. Extensive thoracic congenital scoliosis
associated with fused ribs may affect thoracic growth and function and
may have an adverse effect on the development of the lungs.
Constrictive tridimensional deformities of the thorax may cause
restrictive lung disease. Campbell proposed that severe congenital
scoliosis with segmental hypoplasia of the hemithorax and fused ribs
may be treated by opening wedge thoracostomy with the use of a
chest-wall distractor (79,80,81,82).
unfortunately, it is not recorded often enough. Gain in sitting height
always needs to be compared with angular development of the spine (10,12).
This relation is all that is needed for the proper assessment of
treatment efficacy. If the increase in sitting height is accompanied by
stable angulation, the treatment is definitely working well (10,12,34). If, on the other hand, it is accompanied by deterioration of angulation, the treatment needs to be reconsidered.
In congenital scoliosis, the intrauterine growth and that occurring in
the first few years of life can reveal a great deal about the future
behavior of the spinal curvature (49). In
idiopathic infantile and juvenile scoliosis, the growth during the
first 10 years of life can be very important and may give clues to the
behavior of the spinal curvature during the
pubertal growth spurt (10,34).
However, in adolescent idiopathic scoliosis, the most common form of
scoliosis, there is no such information available before the spine
begins to curve in puberty. The ultimate outcome of the curve will be
determined during the pubertal growth spurt. Therefore, monitoring the
behavior of the spinal curve during this short and decisive period
gives the only clues to its natural history. To detect these clues, it
is necessary to know the onset of puberty (10).
judged on the ascending side of the pubertal growth velocity diagram
corresponding to the first 2 years of puberty (from 11 to 13 years bone
age in girls and from 13 to 15 years bone age in boys) (10).
Any spinal curve increasing by 1 degree each month (12 degrees per
year) during the ascending phase of the pubertal growth diagram is
likely to be a progressive curve that will require treatment. Any curve
that increases by 0.5 degree each month during this phase must be
monitored closely, whereas a curve that increases by less than 0.5
degree each month during this phase can be considered mild (10).
This observation of the natural history of the spinal curve during the
early part of puberty gives information about the behavior of the curve
during the last phase of puberty, as growth is slowing, and thereby
gives guidance about the frequency of follow-up visits and the duration
of bracing.
plays an essential role in the treatment of the disease. During the
ascending phase of the pubertal growth diagram a 5-degree curve is
associated with a 10% risk of progression, a 10-degree curve represents
a 20% risk, a 20-degree curve carries a 30% risk, and a 30-degree curve
raises the risk to virtually 100% (10,83,84).
At Risser I (13.6 years of bone age in girls and 15.6 years of bone age
in boys), there is a 10% risk of progression for an angulation of 20
degrees and a 60% risk for a 30-degree curve.
 |
|
Figure 2.18 The scoliotic risk in relation to the pubertal growth diagram.
|
bone age in boys), there is still a 30% risk of progression (5 degrees
or more) for a 30-degree curve and a 2% risk for a 20-degree curve (64).
At Risser III (14.6 years bone age in girls and 16.6 years bone age in
boys), there is a 12% risk of a curve of 20 degrees or greater
progressing by 5 degrees or more (10). At
Risser IV (15 years bone age in girls and 17 years bone age in boys),
the risk of the progression of scoliosis is markedly decreased,
although, for boys, a slight risk remains (83,84,85,86).
At Risser V (16 years bone age in girls and 18 years bone age in boys),
it would be futile, if not naïve, to wait until the iliac crest is
completely ossified, before discontinuing the treatment of scoliosis (64) (Fig. 2.18).
be, it is widely used as a deciding factor in many reports of brace
treatment or surgery. Nevertheless, its limitations must be understood.
The data of the studies by Lonstein et al. (83) and Pedriolle (85),
relating Risser sign and the curve magnitude, have been discussed. As
was pointed out in the preceding text, because two thirds of the
pubertal growth spurt occurs before the appearance of Risser I, and
because of the often ambiguous relation between Risser stage and bone
age, its value in both clinical decision making and research should be
questioned. Bone age, the growth rate, and secondary sexual
characteristics are the most reliable parameters. Risser stages must
not be regarded as a first-choice indicator; they must always be
compared with bone age (Greulich and Pyle atlas), especially when
making decisions that will have major consequences, such as ordering or
removing a brace or scheduling vertebral fusion (10).
as other ways to judge the remaining growth of the spine and therefore
the risk of progression of the curve. Although there may be some value
in these radiologic signs, it is important to know that in some
patients these apophyses may not close until after 20 years of age (64).
rate of annual growth rather than on radiologic signs. In cases where
annual growth rate is less than 2 cm per year, the end of growth is
imminent (89,90). This
parameter is far more precise than Risser V. It is considered that 3.5
years after the peak growth period in puberty and 2 years after the
onset of menstruation, there is virtually no risk of progression of
scoliosis, and growth is completed.
considered by physicians, is by how much will a spinal fusion for
scoliosis decrease the final height of the child (Table 2.5)?
To determine the answer to this question, the surgeon needs to know the
remaining growth in sitting height and the contribution to that height
made by the vertebrae that will be fused (10,91).
After a bone age of 13 years in girls, when there is only 3.8 cm of
future growth in sitting height, and a bone age of 15 years in boys,
when there is only 4.1 cm of remaining growth in sitting height, there
is little need for concern about final height. Figures 2.13 and 2.14
show the growth remaining in the spine at various ages; the effects of
arthrodesis at these ages can be calculated (Figs. 2-15 and 2-16).
before these ages. Faced with deformity in a developing spine, the
specialist may be best advised to carry out a vertebral arthrodesis to
prevent progression of a severe deformity (92).
It may be better to have a short spine that is straight than to have a
longer but crooked spine with the same sitting height (91).
In addition, the vertebrae in many cases of congenital scoliosis will
not grow normally, and therefore arthrodesis of these vertebrae does
not alter the height as much as it would in a normal spine. Arthrodesis
of six thoracic vertebral bodies, at the age of 5 years, will result in
an approximately 4-cm deficit in sitting height.
The crankshaft phenomenon occurs when there is a solid posterior
arthrodesis, with sufficient anterior growth remaining to produce a
rotation of the spine and trunk with progression of the spinal curve.
Therefore, it is very important for the surgeon to consider the state
of skeletal maturity and the amount of growth remaining in the portion
of the spine that is to be fused (94,95).
immature patients who underwent posterior arthrodesis at Risser 0 or I.
They found that in 72% of the patients the curve progressed less than
10 degrees, in 21% of them it progressed by 11 to 15 degrees, and in
seven patients it progressed by more than 16 degrees. Patients in
Tanner stage I, with open triradiate cartilage, had the greatest
increase in the curve, and the crankshaft phenomenon decreased with
greater maturity.
retrospective study of posterior spinal instrumentation with fusion in
43 patients with idiopathic scoliosis, who were at Risser 0 at the time
of surgery. The triradiate cartilage was open in 23 patients and closed
in 20 patients. The crankshaft effect was observed in 10 of the 23
patients with open triradiate cartilage, and in 1 patient with closed
triradiate cartilage.
is still a significant amount of growth remaining, that is, greater
than 12 cm of standing height for girls and more than 14 cm for boys.
factor in determining the remaining growth of the spine, which is a
difficult thing to do at best. The studies also emphasize the fact
that, for much of the decision making required in the treatment of
scoliosis, the Risser sign is not a reliable parameter because so much
of the spinal growth occurs before Risser I; Tanner signs, bone age,
and annual growth rate are more precise.
descending phase of the puberty growth diagram after elbow closure. The
last spurt of puberty predominantly involves the growth of the thorax,
which may completely change the evolution of idiopathic scoliosis (10,94).
The growth of the thorax, a largely ignored factor, can explain some of
the incidents of deterioration after initially good surgical results.
In addition, the greater the residual curve, the greater the chance of
significant crankshaft development (10,94).
rapidly progressive, circumferential fusion with segmental
instrumentation is the best strategy to avoid the crankshaft
phenomenon. The greater the magnitude of the curve, the more complex
and hazardous is the surgery, and the more unlikely it is to correct
the curve to 0 degrees. In such cases, there is no reason to wait for
the pubertal spurt (10). Puberty can only
worsen the situation. The deficit in sitting height caused by such
early fusion is largely compensated for by the correction of the curve.
A loss of sitting height by early arthrodesis at 10 years of age is not
important for the patient who will live, at least most of the time, in
a wheelchair. At age 5 years, the spinal canal has grown to 95% of its
definitive size; therefore, circumferential arthrodesis will have no
influence on the size of the spinal canal (10).
in boys from birth to the end of growth. The subischial leg length
represents 96% of the total lower limb length (femur + tibia) The cycle
of growth in the lower limb is very regular: a strong increase in
growth during the first 5 years of life; a steady and slower growth
from 5 years of age to the beginning of puberty; a slight growth spurt
during the accelerated growth velocity at the beginning of puberty; and
early cessation after the velocity peak (100,101,102,103).
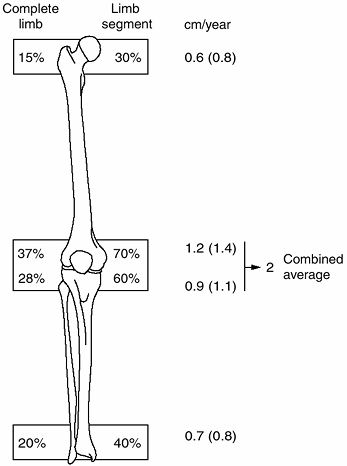
The femur grows more than the tibia. The difference in length between
the two bones is 2 cm at birth and 9 cm at the end of growth.
throughout growth. The proportions are set as early as age 5 years. The
length of the tibia is 80% that of the femur. This is a useful ratio to
remember when balancing lower limb lengthening. The relation between
the tibia and the fibula is also constant. The length of the fibula is
98% that of the tibia (i.e., there is no significant difference). The
contributions of the various growth plates to the length of the lower
limb and its individual bones are shown in Figure 2.19.
undergo a fivefold increase in length to approximately 44 cm in girls
and approximately 47 cm in boys by the time growth has finished. Growth
is particularly vigorous during the first 5 years of life, with the
femur doubling in length by 2 years and tripling by the age of 5 years,
at which age it reaches 60% of the final length (multiplying
coefficient of 1.66) (39-42,101).
 |
|
Figure 2.19
The contributions of the various growth plates to the length of the lower limb and its individual bones as a percentage, and in centimeters, of growth per year. The numbers in parentheses represent the increased growth seen during the first year of puberty in the growth plates. All other numbers are averages for the remaining period of growth. |
cm(±1 cm) in both girls and boys. From 5 years of age until puberty,
femoral growth slows to a steady rate of less than 2 cm per year,
increasing to more than 2.2 cm during puberty. The proximal femoral
physis of the femur accounts for 30% of the femoral growth, or
approximately 10 cm. The proximal femoral growth plates grow roughly
0.7 cm each year increasing to 0.8 cm per year at puberty. The distal
femoral epiphysis accounts for 70% of the femoral growth or
approximately 24 cm. The distal femoral growth plate grows roughly 1.2
cm each year, increasing to 1.4 cm per year at puberty (104).
rate than the femur. By the time the tibia has stopped growing, it will
be about 34 cm long in girls and 37 cm long in boys, having also
increased practically fivefold in length. By the age of 2 years, the
tibia will have nearly doubled its length, it will have tripled its
length by age 5 years and it will have reached, at this time, about 60%
of its final length (multiplying coefficient of 1.66). The tibial and
femoral growth profiles are almost identical, with vigorous growth
during the first 5 years of life, which then slows to about 1.3 cm each
year until puberty, when growth increases to 1.6 cm per year.
length of the tibia, or about 16 cm in girls and 18 cm in boys. Growth
occurs at a rate of roughly 0.9 cm per year. The proximal physis grows
about 0.7 cm each year from age 5 years until puberty, when it
increases to 1 cm per year. The distal tibial physis grows slower and
accounts for about 40% of growth potential, equivalent to 11 cm in
girls and 12 cm in boys. The distal physis grows about 0.5 cm from age
5 years until puberty, when it increases to 0.7 cm per year (100,101,102,103,104).
interdependent, and perfect harmony is necessary. Excessive growth in
the fibula, which happens in cases of achondroplasia, may lead to genu
varum. Similarly, resection of the fibula during growth may result in
ankle valgus. These clinical examples demonstrate how important it is
to restore continuity, length, and growth to either bone if deformity
is to be avoided.
to both of these growth centers. Any serious injury to the growth
centers around the knee during the early years of life is likely to
result in severe shortening of the lower limb. The knee undergoes the
greatest growth of all. From birth to maturity, the knee grows about
42.5 cm in boys (24 cm for the femur and 18.5 cm for the tibia) and
38.7 cm in girls (22 cm for the femur and 16.7 cm for the tibia). The
knee accounts for two thirds of growth (65%) in the lower limb (37% for
the femur and 28% for the tibia) (100,101,102,103,104).
from age 5 to the beginning of puberty, with slightly more than 1 cm of
growth in the femur and slightly less than 1 cm in the tibia. At
puberty, during the ascending phase of the puberty growth diagram, the
knee grows about 2.4 cm per year, with approximately 1.4 cm of growth
in the femur and 1 cm in the tibia. When the growth of the femur and
the tibia are combined, total growth in the lower limb before puberty
averages approximately 3.1 cm per year, increasing to 3.8 cm per year
during puberty.
lower limb is greatest during intrauterine life, and decreases from
birth onward. When the sizes of the fetal foot and the lower limb are
compared, the ratio is 1.41 at 8 weeks, 0.9 at birth, and 0.6 in
adults. At birth, the foot is about 7.5 cm long (i.e., 40% of its final
size). At the end of growth, the foot length is about 24 cm in girls
and 26 cm in boys (6,105). The length of the foot represents 15% of the standing height in both girls and boys at skeletal maturity.
The growth spurt of the foot occurs a few months before the start of
puberty. Although it is the first to start growing during puberty, the
foot is also the first musculoskeletal structure to stop growing.
Growth of the foot stops at bone age 12 years in girls and at bone age
14 years in boys (i. e., 3 years before the end of growth) (105). This makes the foot unique among the musculoskeletal structures in that its rate of growth mostly declines during puberty.
in girls, the foot is already 22 cm long and has only 1.6 cm or 2% of
its growth left. When puberty starts in boys, at approximately bone age
13 years, the foot is about 24 cm long and has 2 cm or 2.5% of its
growth remaining. Therefore, arthrodesis at the beginning of puberty
will have no considerable effect on the length of the foot (106).
limb-length discrepancies, an understanding of the growth of the limbs
gives the physician important information, both in predicting the
incidence of such discrepancies and in more accurately applying the
information from the various methods (e.g., the Moseley straight-line
graft) (42,102).
the trunk or in sitting height during puberty than there is in the
subischial length or the limbs (2,3).
The growth spurt in the lower limbs occurs during the first year of
puberty, and, after bone age of 13 years in girls and 15 years in boys
(i.e., elbow closure and descending phase of the puberty growth
velocity diagram), the rate of growth of the limbs decreases rapidly (54,107). The growth of the limbs is complete at bone age 13.6 years in girls and 15.6 years in boys (54,107) which corresponds to Risser I. In the Greulich and Pyle atlas (20),
this corresponds to fusion of the distal phalangeal physis of the index
and middle fingers. Limb growth is very brief during puberty, and this
must be taken into account. Epiphysiodesis is all the more effective in
cases where surgery is performed at the very beginning of puberty. The
optimum timing for epiphysiodesis remains a controversial subject. The
main challenge in this procedure is to reduce the margin of error (101,108,109). Decisions must be based on the pubertal diagram with precise evaluation of the bone age (hand and elbow) (Figs. 2.20, 2.21 and 2.22).
puberty or later, the risk of overcorrection is relatively small. The
amounts of growth remaining at the various growth plates in the lower
extremity are given in Figures 2.21 and 2.22.
for a problem such as congenital short femur is to multiply the
discrepancy at certain ages by a factor; for example, multiply the
discrepancy by 3 at age 1 year, by 2 at age 3 years for girls and 4
years for boys, by 1.5 at age 6 years for girls and 7 years for boys,
and by 1.1 at the beginning of puberty for both boys (13 years of bone
age) and girls (11 years of bone age). Therefore, a boy with a 4-cm
discrepancy at age 4 years will have an 8-cm difference at the end of
growth. At 7 years, a 4-cm discrepancy will increase to 6 cm. At the
onset of puberty, 10% of the growth of the lower limb remains on
average, so the final length discrepancy will be around 4.4 cm (2,3,101).
 |
|
Figure 2.20
Timing for epiphysiodesis. 5 to 6 centimeters (cm): Both tibia and femur at the beginning of puberty. Bone age 11 years in girls and 13 years in boys. 4 cm: Both tibia and femur 6 months after the onset of puberty. The elbow is useful for this determination. 3 cm: Only femur at the beginning of puberty or both tibia and femur at bone age 12 years in girls and 14 years in boys. 2 cm: Only femur at bone age 12 years in girls and 14 years in boys. |
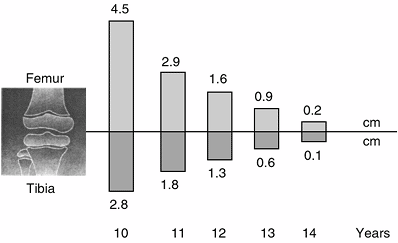 |
|
Figure 2.21
The remaining growth in the lower limb at the four growth plates, between the bone ages of 10 and 14 years in girls. (Adapted from Diméglio A, Bonnel F. Growth and development of the knee. In: De Pablos J, ed. The immature knee. Barcelona: Biblio Stm, 1998:3, with permission.) |
caution. For the final decision in complex cases, it is best to use all
of the information possible—standing height, sitting height, annual
growth rate, Hechard–Carlioz chart (110), Moseley chart (102), Lefort residual coefficient (40), and multiplying coefficient (39,40,41,42)—while
considering the bone age in order to lessen the margin of error. The
younger the patient, the higher the risk of inaccurate prediction (111).
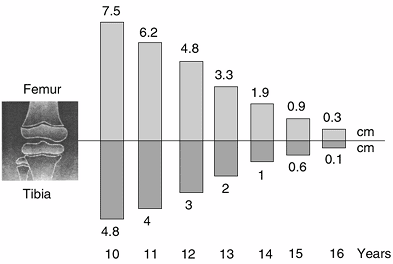 |
|
Figure 2.22
The remaining growth in the lower limb at the four growth plates, between the bone ages of 10 and 16 years in boys. (Adapted from Diméglio A, Bonnel F. Growth and development of the knee. In: De Pablos J, ed. The immature knee. Barcelona: Biblio Stm, 1998:3, with permission.) |
Furthermore, these forecasts are best suited to cases of malformation
in which the difference in the rate of growth between the two limbs
remains constant. Other causes of limb-length discrepancy, such as
poliomyelitis, vascular malformation, and chronic arthritis, may not
follow a constant pattern and are more difficult to evaluate (112).
depends on the final height of the child. Predicting the final height
before puberty is inexact (26). Approximately
80% of children will remain in the same percentile for height after age
5 years. Tables to make these predictions from bone age are found in
the Greulich and Pyle atlas (20). At the
beginning of puberty, the remaining growth in standing height is about
14% in boys and 13% in girls. The final standing height depends upon
the date of the beginning of puberty and its duration.
The first 5 years of life are characterized by an acceleration of
growth velocity, between the age of 5 and the beginning of puberty
there is a plateau, and at the very beginning of puberty there is a
slight spurt in growth (2,3,113,114,115).
At birth, the length of the upper limb is 20 cm: the humerus makes up
7.5 cm, the ulna 6.5 cm, and the hand 6 cm. The upper limb grows
approximately 10 cm during the first year, 6 cm during the second year,
5 cm during the third year, and 3.5 cm in the fourth year. After the
age of 5 years, the rate of growth decreases. The contributions of the
various growth plates to the length of the upper limb and its
individual bones are shown in Figure 2.23 (2,3,116).
years up to the first 2 years of puberty, after which it grows about
3.5 cm each year until the end of growth. This growth is made up of
approximately 1.3 cm in the humerus, 1.1 cm in the ulna, 1 cm in the
radius, and 0.7 cm in the hand. The length of the upper limb bones
nearly doubles between birth and 3 years of age. By 5 years of age, the
bones of the upper extremity have reached half their final length (2,3,115).
in boys, the elbow is closed and only the wrist and the hand are still
growing.
that of the lower limbs. The hand shows a relatively slight
acceleration in growth about 6 months before the forearm, and the
forearm reaches its peak growth velocity about
6 months before the upper arm (117). The proximal humerus reaches its maximal growth rate at approximately the same time as the trunk.
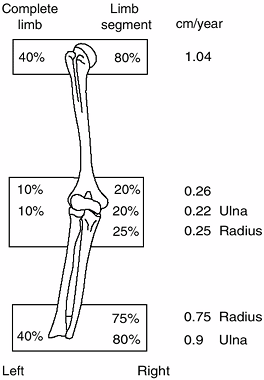 |
|
Figure 2.23
The contributions of the various growth plates to the length of the upper limb and its individual bones as a percentage of growth per year. |
A study of these indices is extremely valuable in assessing retarded
growth during the course of chondrodystrophy (i.e., rhizomelic and
mesomelic dwarfism) (2,3,118).
paralytic disorders (e.g., cerebral palsy, spina bifida, and
poliomyelitis). In these children, therefore, it is essential to record
and follow the parameters of growth closely to establish an indication
for surgery with as much accuracy and safety as possible (2,31,32,33,119,120).
There are two problems that make it difficult to measure and evaluate
the parameters of growth in such children. First, contractures and
deformities make morphometric measurements difficult or even
impossible. Second, reference values that pertain to children with
normal growth and development are not applicable to these children.
information about growth, first by measuring arm span when the child is
in a wheelchair and, second, by scrutinizing the child carefully from
head to foot. The length of even one bone that has been more or less
spared by the deficit could be sufficient to determine the standing
height of the child. For example, after age 8 years, the proportions of
the body segments remain the same; therefore, the length of the femur
represents 28% of standing height, and the length of the tibia and
fibula represents 24% of standing height. For the upper extremities,
the humerus represents 19% of standing height and 36.5% of sitting
height, the radius represents 14.5% and 27.8% of standing and sitting
height, respectively, and the ulna represents 15.5% and 29.5%,
respectively (2,3).
consideration. Many children, especially those with cerebral palsy and
total body involvement, have a deficit of 20 to 30 kg. Surgical
procedures are not the same for children who weigh 20, 40, and 60 kg.
Being underweight as a result of malnutrition creates a risk of
infection after surgery (121,122,123,124).
There are many parameters that are used to assess nutritional status,
such as measurements of the triceps and the subscapular skinfold, or
determination of the total lymphocyte count. Whichever tests the
surgeon relies on should be carried out on underweight children before
surgery, especially on those children with chronic conditions (125).
surgery. The obesity of children with muscular dystrophy or spina
bifida may restrict the choice of surgical approaches and
instrumentation. The gain in weight during puberty is the main enemy of
children with diplegia or ambulatory quadriplegia (2,3,126).
These patients sometimes display a wide range of bone ages, with the
bone age of the hand not matching that of the elbow or the pelvis (this
observation is made from the author’s personal experience). The real
bone age, therefore, must be approximately assessed, and this
information must be correlated with the results of anthropometric
measurements (31,32,33).
These measurements are based on radiographs that measure the bone
length, but they can also be obtained during a clinical examination.
For the tibia, a simple measurement is possible from the medial joint
line of the knee to the inferior rim of the medial malleolus (128).
They do not by themselves define a true age. They define trends and
outline the evolution of growth. They should be taken as just what they
are: a convenient means to map the route through puberty. They record
ephemeral points in the processes of growth and anticipate the events
that lie in the future. Their use helps the surgeon in avoiding
uncertain or unnecessary treatments and aids in developing
successful strategies. Nothing can produce worse results than decisions leading into uncharted territory (2,3,12).
to detect the pubertal peak velocity. Birthdays are a convenient
reminder for annual evaluations such as measurements of growth.
Percentages provide an extremely valuable and objective tool for
evaluating residual growth, particularly with respect to the
proportions between the lengths of various segments of the limbs, and
between the limbs and the trunk (2,3,10).
The multiplying coefficient can be applied to all biometric data.
However diverse their ethnic origins, and although stature has been
increasing in succeeding generations over the centuries, boys of all
generations and ethnic backgrounds will always have approximately 14%
of outstanding growth in standing height and 10% of length of the femur
or tibia remaining at the beginning of puberty. Neither the percentage
nor the proportions change, and even the ratios are stable. The humerus
is equivalent to, and will always be equivalent to, approximately 19%
of standing height and 36.5% of sitting height (2,3,5,118,129,130). Whatever be the population profile, the chronology of growth and stages of puberty remain the same.
reliable. For instance, the length of the femur in relation to standing
height, or the length of the thoracic segment in relation to sitting
height, provides more objective values. To gain this information, the
examiner should try to obtain a general overview of the child’s growth
and to plot the child’s anthropometric chart.
many conditions, especially the various types of dwarfism. The ratio of
sitting height to subischial leg length is essential when analyzing
chondrodystrophy. Special curves can be used to follow such patients (131,132).
Dwarfism can be divided into two families: short-trunk dwarfism, the
prime example of which is represented by Morquio syndrome; and
normal-trunk dwarfism, which is characterized by the limbs being
shorter than normal. The prime example here is achondroplasia (2,3). In this disease, weight is an important parameter to consider, and obesity is a frequent cause of complications (133).
synchronized, organized, and interdependent, but they vary widely in
the time of occurrence during growth. For instance, the growth of the
trunk accounts for most of the increase in standing height during the
last part of puberty. Also, weight gain lags behind growth in length
until puberty, after which the percentage gain in weight far exceeds
the percentage gain in height. All changes are gradual. Growth itself
is a succession of phases, periods of deceleration or acceleration,
spurts, and alternating processes. However intellectually comfortable
it may be to believe that the limbs always grow uniformly, checking
growth measurements every 6 months reveals that there are breaks and
phases during which growth alternates between the proximal and distal
parts of a limb.
decision making, particularly about epiphysiodesis or spinal
arthrodesis. For instance, in slipped capital femoral epiphysis, the
risk of contralateral slipping is only 4% when the triradiate cartilage
is closing and is 0% when the elbow is already closed (20,134,135).
first 2 years of puberty. By measuring the standing height, the sitting
height, and the subischial leg length every 6 months, it becomes much
easier to understand the puberty growth spurt. Bone age must be
analyzed with a critical mind and constantly compared to the rate of
annual growth in standing height and secondary sexual characteristics.
remaining growth. Puberty is the time when most of these decisions will
be made. In children in whom growth disturbance is anticipated, it is
best to record several parameters over time in order to have an
accurate picture of growth.
future growth. The milestones that mark the growth path during puberty
must be noted and understood by the orthopaedic surgeon.
JM, Whitehouse RH, Takaishi M. Standards from birth to maturity for
height, weight, height velocity and weight velocity: British children
1965, parts I and II. Arch Dis Child 1966;41:454.
JM, Whitehouse RH. Clinical longitudinal standards for height, weight,
height velocity and weight velocity and the stages of puberty. Arch Dis Child 1976;51:170.
A, Largo RH, Molinari L, et al. Physical growth of Swiss children from
birth to 20 years of age: first longitudinal study of growth and
development. Helv Paediatr Acta 1989;52(Suppl): 1–125.
AEW, Bulman JS. Growth curves of immature bones from Scottish island
population of sixteenth to mid-nineteenth century: limb-bone diaphyses
and some bones of the hand and foot. Int J Osteoarchaeol 1994;4:121–136.
JCY, Leung SSF, Chin BSK, et al. Can we predict body height from
segmental bone length measurements? A study of 3,647 children. J Pediatr Orthop 1998;18:387.
J. Utilisation du coefficient de croissance résiduelle dans le calcul
prévisionnel des inégalités de longueur des membres inférieurs. Rev Chir Pediatr Orthop 1981;67:753.
R, Meyer DB. The timing and sequence of events in the development of
the human vertebral column during the embryonic period proper. Anat Embryol 1979;157:167.
S, Kleinman R, Bleck EE. Growth landmarks and the evolution of
scoliosis: a review of pertinent studies on their usefulness. Dev Med Child Neurol 1980;22:675.
G, Combes J. Segments supérieur et inférieur au cours de la croissance
physiologique des filles: etude longitudinale de la croissance de 54
filles. Arch Fr Pediatr 1971;28:1057.
F, Burwell RG, Hall DJ. A longitudinal study of carpal bone development
in Perthes’ disease: its significance for both radiologic standstill
and bilateral disease. Clin Orthop 1986;209:115.
RT, Sundberg S, Keith G, et al. Determination of bone age in children
with cartilaginous dysplasia (multiple hereditary osteochondromatosis
and Ollier’s enchondromatosis). J Pediatr Orthop 2004;24:102–108.
H, Riedl S, Waldhort T. Computer-aided estimation of skeletal age and
comparison with bone age evaluations by the method of Greulich-Pyle and
Tanner-Whitehouse. Pediatr Radiol 1996;26:226.
J, Weiner DS, Bethem D, et al. Correlation of Risser’s sign and bone
age determination in adolescent idiopathic scoliosis. J Pediatr Orthop 1985;5:697.
RM, Smith MD, Mayes TC, et al. The characteristic of thoracic
insufficiency syndrome associated with fused ribs and congenital
scoliosis. J Bone Joint Surg Am 2003;85:399–408.
RM, Smith MD, Mayes TC, et al. The effect of opening wedge thoracostomy
on thoracic insufficiency syndrome associated with fused ribs and
congenital scoliosis. J Bone Joint Surg Am 2004;86:1659–1674.
DG, Song KM, Katz D, et al. Relationship of peak height velocity to
other maturity indicators in idiopathic scoliosis in girls. J Bone Joint Surg Am 2000;82:685–693.
J, Agostini S, Sampaio J, et al. The sitting-standing height ratio as a
method of evaluating early spine fusion in the growing child. Clin Orthop 1973;24:7.
BS. The effects of growth on the scoliotic spine following posterior
spinal fusion. In: Buckwalter JA, Ehrlich MG, Sandell LJ et al., eds. Skeletal growth and development: clinical issues and basic science advances, Vol. 3. Rosemont, IL: American Academy of Orthopaedic Surgeons, 1997:577.
RF, Lonstein JE, Winter RB, et al. Curve progression in Risser stage 0
on patients after posterior spinal fusion for idiopathic scoliosis. J Pediatr Orthop 1997;17:718.
JO, Herring JA, Browne RH. Posterior arthrodesis and instrumentation in
the immature (Risser-grade-0) spine in idiopathic scoliosis. J Bone Joint Surg Am 1995;77:39.
RB. Convex anterior and posterior hemiarthrodesis and
hemiepiphysiodesis in young children with progressive congenital
scoliosis. J Pediatr Orthop 1989;1:361.
MM. Growth of major long bones on healthy children: a preliminary
report on successive roentgenograms of the extremities from early
infancy to twelve years of age. Arch Dis Child 1943;66:227.
QW, Crook CE, Charney EB, et al. Assessment of linear growth of
children with cerebral palsy: use of alternative measures to height or
length. Dev Med Child Neurol 1989;31:206.
PB, Juszezak E, Lambert BR, et al. Impact of feeding problems on
nutritional intake and growth: Oxford feeding study II. Dev Med Child Neurol 2002;44:461–467.
WA, Hall JG, Scott CI Jr, et al. Growth curves for height for
diastrophic dysplasia, spondyloepiphyseal dysplasia congenita, and
pseudoachondroplasia. Am J Dis Child 1982; 136:316.