
One – General Principles: Basics > Principles of Treatment > 15 –
Outcome Studies in Trauma
careful attention to the design, statistical analysis, and critical
appraisal of clinical research. The delineation between “outcomes”
research and “evidence-based medicine” is vague. Because the term
evidence-based medicine (EBM) was coined first at McMaster University,
orthopaedic surgeons and researchers have adopted their own style of
critical appraisal, often coined as “evidence-based orthopaedics”
(EBO). EBO entails using a clear delineation of relevant clinical
questions, a thorough search of the literature relating to the
questions, a critical appraisal of available evidence and its
applicability to the clinical situation, and a balanced application of
the conclusions to the clinical problem.27,47,48
decision-making) is the central point of practicing EBO and involves,
according to EBM principles, integration of our clinical expertise and
judgment, patients’ perceptions and societal values, and the best
available research evidence.2,19
of high-quality randomized trials showing definitive results directly
applicable to an individual patient, to relying on physiologic
rationale or previous experience with a small number of similar
patients. The hallmark of the evidence-based surgeon is that, for
particular clinical decisions, he or she knows the strength of the
evidence, and therefore the degree of uncertainty.
avoid common misconceptions about EBO. Critics have mistakenly
suggested that evidence can be derived only from the results of
randomized trials or that statistical significance automatically means
clinical relevance. These things are not true. This chapter provides an
evaluation of all study designs with recommendations to their
appropriate use in orthopaedic clinical research.
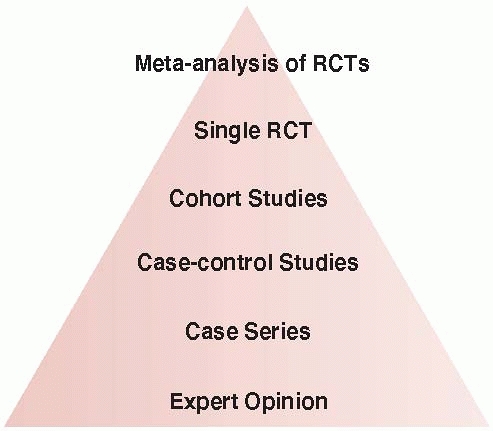
evidence with randomized controlled trials (RCTs) at the top,
controlled observational studies in the middle, and uncontrolled
studies and opinion at the bottom (Fig. 15-1).17,19,20,47 Understanding the association between study design and level of evidence is important. The Journal of Bone and Joint Surgery
(JBJS), as of January 2003, has published the level of evidence
associated with each published scientific article to provide readers
with a gauge of the validity of the study results. Based upon a review
of several existing evidence ratings, the JBJS uses five levels for
each of the four different study types (therapeutic, prognostic,
diagnostic, and economic or decision-modeling studies) (Table 15-1).52
Level 1 studies may be deemed appropriate for the application to
patient care, whereas Level 4 studies should be interpreted with
caution. For example, readers should be more confident about the
results of a high-quality multicenter randomized trial of arthroplasty
versus internal fixation on revision rates and mortality (Level 1
study) than two separate case series evaluating either arthroplasty or
internal fixation on the same outcomes (Level 4 studies).
 |
|
FIGURE 15-1 The hierarchy of evidence with high-quality randomized trials at the top and expert opinion at the bottom.
|
have evaluated the interobserver agreement among reviewers with varying
levels of epidemiology training in categorizing clinical studies
published in the JBJS into levels of evidence. Among 51 included
articles, the majority were studies of therapy (68.6%) constituting
Level 4 evidence (56.9%). Overall, agreement among reviewers for the
study type, level of evidence, and subcategory within each level was
substantial (range: 0.61-0.75). Epidemiology trained reviewers
demonstrated greater agreement (range: 0.99-1.0) across all aspects of
the classification system when compared with nonepidemiology trained
reviewers (range: 0.60-0.75). The findings suggested that epidemiology
and nonepidemiology trained reviewers can apply the levels of evidence
guide to published studies with acceptable interobserver agreement.
Although reliable, it remains unknown whether this system is valid.14
the validity of the study design. Thus, those designs that limit bias
to the greatest extent find themselves at the top of the pyramid and
those inherently biased designs are at the bottom (see Fig. 15-1). Application of the levels of evidence also requires a fundamental understanding of various study designs.
proposed a grading system that categorizes the hierarchy of research
designs as levels of evidence. Each level (from 1-5) is associated with
a corresponding grade of recommendation: (i) grade A—consistent Level 1
studies, (ii) grade B—consistent Level 2 or Level 3 studies, (iii)
grade C—Level 4 studies, and (iv) grade D—Level 5 studies.17,19,20,47
when making a recommendation for treatment, four areas should be
considered (Table 15-2)3,4,5:
(i) What are the benefits versus the harms? Are there clear benefits to
an intervention or are there more harms than good?; (ii) What is the
quality of the evidence? (iii) Are there modifying factors affecting
the clinical setting such as the proximity of qualified persons able to
carry out the intervention? (iv) What is the baseline risk for the
potential population being treated?
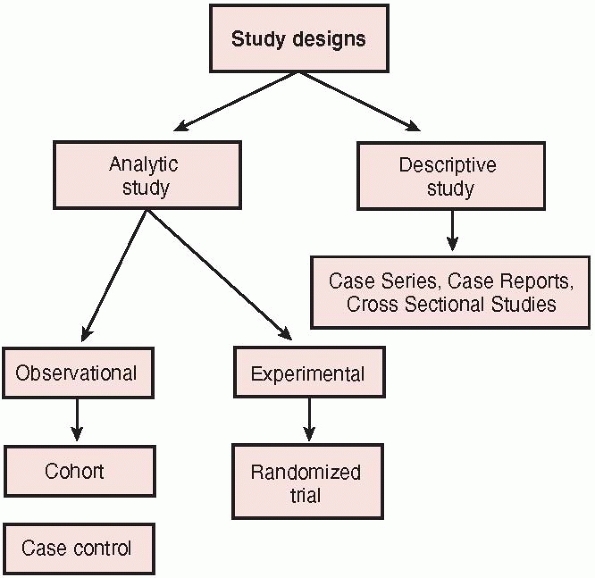
be classified broadly according to whether the study focuses on
describing the distributions or characteristics of a disease or on
elucidating its determinants (Fig. 15-2).20 Descriptive studies
describe the distribution of a disease, particularly what type of
people have the disease, in what locations, and when. Cross sectional
studies, case reports, and case series represent types of descriptive
studies. Analytic studies focus on
determinants of a disease by testing a hypothesis with the ultimate
goal of judging whether a particular exposure causes or prevents
disease. Analytic design strategies are broken into two types:
observational studies, such as case-control and cohort studies, and
experimental studies, also called clinical trials. The difference
between the two types of analytic studies is the role that the
investigator plays in each of the studies. In the observational study,
the investigator simply observes the natural course of events. In the
trial, the investigator assigns the intervention or treatment.
|
TABLE 15-1 Levels of Evidence
|
|||||||||||||||||||||||||||||||||||||||||||||
|---|---|---|---|---|---|---|---|---|---|---|---|---|---|---|---|---|---|---|---|---|---|---|---|---|---|---|---|---|---|---|---|---|---|---|---|---|---|---|---|---|---|---|---|---|---|
|
|||||||||||||||||||||||||||||||||||||||||||||
meta-analysis deserves mention because it is frequently utilized in the
surgical literature. A meta-analysis is a systematic review that
combines the results of multiple studies (of small sample size) to
answer a focused clinical question. Meta-analyses are retrospective in
nature. The main advantage of meta-analysis is the ability to increase
the “total sample size” of the study by combining the results of many
smaller studies. When well-designed studies are available on a
particular question of interest, a meta-analysis can provide important
information to guide clinical practice. Consider the following example.
Several small randomized trials have attempted to resolve the issue of
whether operative repair of acute Achilles tendon ruptures in younger
patients reduces the risk of rerupture compared with conservative
treatment. Of five randomized trials (ranging in sample size from 27 to
111 patients), four found nonsignificant differences in rerupture
rates. These studies were underpowered. Using meta-analytic techniques,
the results of these small studies were combined (n = 336 patients) to
produce a summary estimate of 3.6% surgery versus 10.6% conservative
(relative risk = 0.41; 95% confidence interval [CI], 0.17%-0.99%; p = 0.05) of adequate study power (>80%) to help guide patient care.9
|
TABLE 15-2 Criteria for Assessing Grade of Evidence
|
||||||||||||||
|---|---|---|---|---|---|---|---|---|---|---|---|---|---|---|
|
over traditional reviews (i.e., narrative or nonsystematic reviews).
Rigorous systematic reviews received over twice the number of mean
citations compared with other systematic or narrative reviews (13.8 vs.
6.0, p = 0.008).12
the outcomes available and not necessarily the outcomes of interest.
There is often a trade off between pooling data from many studies on
common and sometimes less relevant outcomes (i.e., nonunion) versus
fewer studies reporting less common outcomes of interest (i.e.,
avascular necrosis). Thus, the definition eligibility criteria for the
studies to be included is an important step in the conduct of a
meta-analysis.
 |
|
FIGURE 15-2 Categorization of study designs.
|
represents the current standard in the translation of evidence to
practice. While meta-analysis can be a powerful tool, its value is
diminished when poor quality studies (i.e., case series) are included
in the pooling. Pooled analyses of nonrandomized studies are prone to
bias and have limited validity. Surgeons should be aware of these
limitations when extrapolating such data to their particular clinical
settings.
While it may seem elementary to explain the term “randomization,” most
surgeons are unfamiliar with the rationale for random allocation of
patients in a trial. Orthopaedic treatment studies attempt to determine
the impact of an intervention on events such as nonunions, infections,
or death—occurrences that we call the trial’s target outcomes or target
events. Patients’ age, the underlying severity of fracture, the
presence of comorbid conditions, health habits, and a host of other
factors typically determine the frequency with which a trial’s target
outcome occurs (prognostic factors). Randomization gives a patient
entering a clinical trial an equal probability (or chance) of being
allocated to alternative treatments. Patients can be randomized to
alternative treatments by random number tables or computerized
randomization systems. Randomization is the only method for controlling
for known and unknown prognostic factors between two comparison groups.
For instance, in a study comparing plates and intramedullary nails for
the treatment of tibial shaft fractures in patients with concomitant
head injury, investigators reported imbalance in acetabular fractures
between treatment groups. Readers will agree that differences in
patient function or mortality may not be attributed to treatment
groups, but rather differences in the proportion of patients with
acetabular fractures. Realizing this imbalance due to lack of
randomization, the investigators employed a less attractive strategy to
deal with the imbalance—statistical adjustment for differences between
groups. By controlling for the difference in the number of acetabular
fractures between groups, the effect of plates versus nails in patients
was determined.
Concealed randomization ensures that surgeons are unable to predict the
treatment to which their next patient will be allocated. The safest
manner in which to limit this occurrence is a remote 24-hour telephone
randomization service. Historically, treatment allocations in surgical
trials have been placed within envelopes; while seemingly concealed,
envelopes are prone to tampering.
double-blinded due to the relative impossibility of blinding surgeons,
Devereaux and colleagues24 have
recently challenged the “classic” definition of double-blinding. In a
survey of 91 internists and researchers, 17 unique definitions of
“double-blinding” were obtained. Moreover, randomized trials in five
high-profile medical journals (New England Journal of Medicine, The Lancet, British Medical Journal, Annals of Internal Medicine, and Journal of the American Medical Association) revealed considerable
variability in the reporting of blinding terminology. Common sources of
blinding in a randomized trial include: physicians, patients, outcome
assessors, and data analysts. Current recommendations for reporting
randomized trials include explicit statements about who was blinded in
the study rather than using the term “double-blinded.” Surgical trials
can always blind the data analyst, almost always blind the outcome
assessor, occasionally blind the patient, and never blind the surgeon.
In a review of orthopaedic trials, outcome assessors were blinded only
44% of the time and data analysts were never blinded. However, at least
two thirds of surgical trials could have achieved double-blinding by
blinding the outcome assessors, patients, or data analysts.13
|
TABLE 15-3 Study Designs and Common Errors
|
|||||||||||||||||||||
|---|---|---|---|---|---|---|---|---|---|---|---|---|---|---|---|---|---|---|---|---|---|
|
This strategy preserves the value of randomization: prognostic factors
that we know about and those we don’t know about will be, on average,
equally distributed in the two groups, and the effect we see will be
just that due to the treatment assigned. When reviewing a report of a
randomized trial, one should look for evidence that the investigators
analyzed all patients in the groups to which they were randomized. Some
suggest that an intention-to-treat approach is too conservative and
more susceptible to type II error due to increased biologic
variability. Their argument is that an intention-to-treat analysis is
less likely to show a positive treatment effect, especially for those
studies that randomized patients who had little or no chance of
benefiting from the intervention.
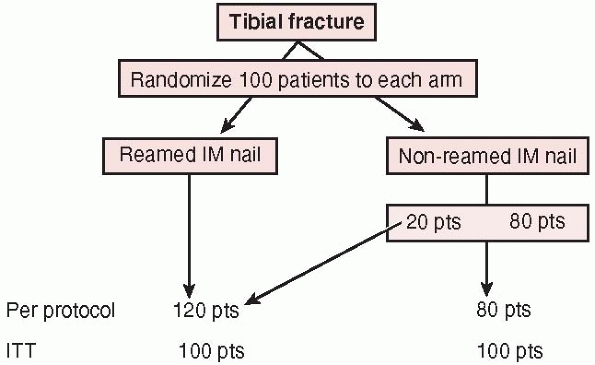
analysis, reports outcomes on the treatments patients actually received
regardless of the number of crossovers from one treatment to another.
This approach is often utilized to determine whether imbalances in
baseline factors actually affect the final result. It may be
particularly important when patients who are randomized to one
treatment (i.e., reamed or unreamed tibial nail) but never receive
either treatment. For example, in a trial of reamed versus unreamed
tibial nailing, a patient randomized to a reamed tibial nail who
ultimately receives an external fixator due to an intraoperative
surgical decision will be excluded from in per protocol analysis;
however, recall that this same patient would be included in the reamed
tibial nail group in an intention-to-treat analysis.
 |
|
FIGURE 15-3
The intention to treat principle: a per protocol analysis analyzes patient outcomes to the treatment they “actually received” whereas intention to treat analysis evaluates outcomes based upon the treatment to which patients were originally randomized. |
surgeons involved in the trial have performed both total hip
arthroplasties (THA) and hemiarthroplasties. Surgeons performing
arthroplasty are frequently less experienced (or expert) in one or both
surgical alternatives. This trial aims to limit this differential
expertise across treatment alternatives. In our proposed
expertise-based design, we will randomize patients to receive THA (by
surgeons who are experienced and committed to performing only THA) or
to hemiarthroplasty (by surgeons with expertise in hemiarthroplasty who
are committed to performing only hemiarthroplasty). Devereaux and
colleagues23 have outlined the
advantages of this trial design, which include the following: (i)
elimination of differential expertise bias where, in conventional
designs, a larger proportion of surgeons are expert in one procedure
under investigation than the other; (ii) differential performance,
cointervention, data collection, and outcome assessment are less likely
than in conventional RCTs; (iii) procedural crossovers are less likely
because surgeons are committed and experienced in their procedures; and
(iv) ethical concerns are reduced because all surgeries are conducted
by surgeons with expertise and conviction concerning the procedure.23
|
TABLE 15-4 Checklist for Assessing Quality of Reporting
|
|||||||||||||||||||||||||||||||||||||||||||||||||||||||||||||||||||||||||||||||||||||
|---|---|---|---|---|---|---|---|---|---|---|---|---|---|---|---|---|---|---|---|---|---|---|---|---|---|---|---|---|---|---|---|---|---|---|---|---|---|---|---|---|---|---|---|---|---|---|---|---|---|---|---|---|---|---|---|---|---|---|---|---|---|---|---|---|---|---|---|---|---|---|---|---|---|---|---|---|---|---|---|---|---|---|---|---|---|
|
|||||||||||||||||||||||||||||||||||||||||||||||||||||||||||||||||||||||||||||||||||||
study designs. The role of observational comparative studies in
evaluating treatments is an area of continued debate: deliberate choice
of the treatment for each patient implies that observed outcomes may be
caused by differences among people being given the two treatments,
rather than the treatments alone.10
Unrecognized confounding factors can interfere with attempts to correct
for identified differences between groups. There has been considerable
debate about whether the results of nonrandomized studies are
consistent with the results of RCTs.7,22,29,33 Nonrandomized studies have been reported to overestimate or underestimate treatment effects.29,33
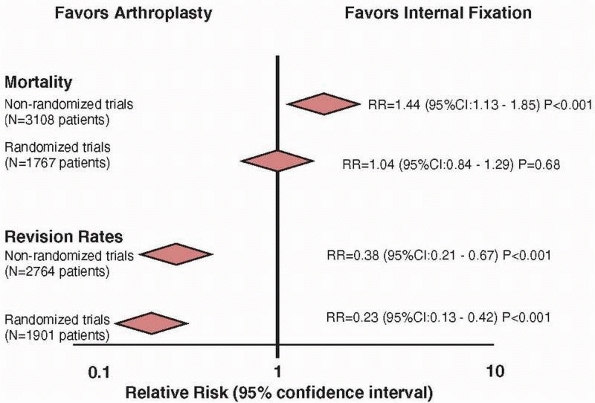
reported in a study comparing study designs that addressed the general
topic of comparison of arthroplasty and internal fixation for hip
fracture.17 Mortality data was
available in 13 nonrandomized studies (n = 3108 patients) and in 12
randomized studies (n = 1767 patients). Nonrandomized studies
overestimated the risk of mortality by 40% when compared with the
results of randomized trials (relative risk: 1.44 vs. 1.04,
respectively) (Fig. 15-4). If we believe the
data from the nonrandomized trials, then no surgeon would offer a
patient a hemiarthroplasty for a displaced hip fracture given the
significant risk of mortality. However, in practice, arthroplasty is
generally favored over internal fixation in the treatment of displaced
femoral neck fractures. Thus, surgeons believe the randomized trials
that report no significant differences in mortality and significant
reductions in revisions with arthroplasty.
 |
|
FIGURE 15-4
Estimates from randomized trials tend to provide a more conservative estimate of a treatment effect when compared to nonrandomized studies. Nonrandomized studies overestimate the benefit of internal fixation regarding mortality by 40%. |
RCT results can be found in the surgical literature. An observational
study of extracranial-to-intracranial bypass surgery suggested a
“dramatic improvement in the symptomatology of virtually all patients”
undergoing the procedure.56 However,
a subsequent large RCT demonstrated a 14% relative increase in the risk
of fatal and nonfatal stroke in patients undergoing this procedure
compared to medical management.1
These considerations have supported a hierarchy of evidence, with RCTs
at the top, controlled observational studies in the middle, and
uncontrolled studies and opinion at the bottom. However, these findings
have not been supported in two publications in the New England Journal of Medicine that identified nonsignificant differences in results between RCTs and observational studies.7,22
the most valid evidence, information from nonrandomized studies can
provide invaluable data to generate hypotheses for future studies.
patients at a similar point in time and follows them forward in time.
Outcomes are determined prior to the start of the study and evaluated
at regular time intervals until the conclusion of the study. A
comparison group (controls) may also be identified concurrently and
followed for the same time period.
outcomes of two surgical alternatives, a prospective evaluation of a
single group of patients with complex injuries can provide information
on the frequency of success (radiographic and functional outcomes) and
expected complications. This information is most useful when the data
collected remains consistent over time, the data collected includes
important baseline patient characteristics and patient outcomes, and
efforts are made to ensure patients are followed over time. Professor
Joel Matta’s acetabular fracture database is one striking example of a
carefully designed single-surgeon, prospective database that has
consistently collected data on patients for more than 20 years
(personal communication). With over 1000 patients with acetabular
fractures included in this database, the current limits of technique,
results, and complications can be reported to serve as a benchmark for
future studies. In addition, these types of studies can assist surgeons
in discussing the expected risk and outcomes of surgery with their
patients during the informed consent process.
infection), conducting a prospective cohort study may be
cost-prohibitive. A case-control study is a useful strategy in such
circumstances.20 Cases with the
outcome of interest are identified retrospectively from a group of
patients (i.e., databases) and matched (i.e., by age, gender, severity
of injury) with control patients who do not have the outcome of
interest. Both groups can be compared for differences in “risk” factors.10
One control may be matched for each case that is identified (1:1
matching). Alternatively, multiple controls may be matched to each case
(i.e., 3:1 or 4:1 matching). The validity of results from case-control
studies depends upon the accuracy of the reporting of the outcomes of
interest. For example, investigators conducted a study to determine
risk factors for hip fracture among elderly women.28
To accomplish this, they identified 159 women with their first hip
fracture and 159 controls (1:1 matching) matched for gender, age, and
residence. Risk factors included perceived safety of the residence,
psychotropic drug use, and tendency to fall. Comparison of these
factors between the hip fracture and control groups revealed an
increased risk of perceived safety (odds ratio = 5.8), psychotropic
drug use (odds ratio = 2.6), and tendency to fall (odds ratio = 2.3)
among patients who sustained a fracture compared to those who did not.
less time consuming, is often limited by bias in the ascertainment of
cases and the evaluation of outcomes. Comparison groups can be
identified during the same time period as the treatment group
(concurrent controls). However, controls from a different period of
time can also be utilized (historical controls). Patient follow-up may
be conducted passively (via patient records) or actively (patient
follow-up appointment and examination). When patient charts have formed
the basis for the outcome evaluation, readers should be convinced that
the outcomes were objective measures accurately obtained from patient
records. For example, in-hospital mortality data is an objective
outcome that is likely to have been well documented in patient charts;
however, patient satisfaction or functional outcome is subjective and
far less likely to have been recorded with any standardization or
consistency.
about the safety and complication profile of a new surgical technique
or implant. This information is most valid when eligibility criteria
for patient inclusion are clearly defined, consecutive patients are
screened for eligibility, surgery and perioperative care is consistent,
outcomes are objective and independently assessed, and follow-up is
complete. Unfortunately, the validity of the results can be compromised
by inadequate and incomplete reporting of patient characteristics and
outcomes in patient charts.
tibial intramedullary nails was largely fueled decades ago by case
series (Level IV evidence). Case series eventually led to prospective
cohort comparison of reamed and unreamed nailing techniques (Level II).
Realizing the biases inherent in nonrandomized designs, a number of
investigators conducted randomized trials ranging in sample size from
50-136 patients.57 Despite a strong
design, these trials were limited by small sample sizes, imprecise
treatment effects, lack of outcome assessment blinding, and unconcealed
allocation of patients to treatment groups.
Intramedullary Nails in Tibial fractures (SPRINT) trial was designed to
compare the effects of reamed and nonreamed intramedullary nailing
approaches.58 To overcome
limitations of previous studies, the design involved concealed central
randomization, blind adjudication of outcomes, and disallowing
reoperation before 6 months.
September 2005 across 29 clinical sites in Canada, the United States,
and the Netherlands. The final follow-up occurred in September 2006 and
final outcomes adjudication was completed in January 2007.
Participating investigators randomized patients by accessing a 24-hour
toll-free remote telephone randomization system that ensured
concealment. Randomization was stratified by center and severity of
soft tissue injury (open, closed, or both open and closed) in randomly
permuted blocks of 2 and 4. Patients and clinicians were unaware of
block sizes. Patients were allocated to fracture fixation with an
intramedullary nail following reaming of the intramedullary canal
(Reamed Group) or with an intramedullary nail without prior reaming
(Nonreamed Group).
the same protocol. SPRINT investigators hypothesized that the benefits
of reamed nails suggested by previous literature may have been due to a
lower threshold for early reoperation in patients with nonreamed nails.
Therefore, reoperations were disallowed within the first 6 months
following surgery. Exceptions to the 6-month rule included reoperations
for infections, fracture gaps, nail breakage, bone loss, or
malalignment. Patients, outcome assessors, and data analysts were
blinded to treatment allocation. Reoperation rates were monitored at
hospital discharge, 2 weeks postdischarge, 6 weeks postsurgery, and 3,
6, 9, and 12 months postsurgery.
study methodology including: (i) a sample size 10-fold greater than the
largest previous tibial fracture trial; (ii) a modern trial
organization including an independent blinded adjudication and data
safety monitoring committee; (iii) use of innovative trial
infrastructure for randomization and data management; and (iv) large
scale multimillion collaborative funding from the National Institutes
of Health and the Canadian Institutes of Health proving that
orthopaedic surgical trials belong in the same arena as the large
cardiovascular and osteoporosis trials.
medical literature has been that of hypothesis testing. The
investigator starts with what is called a null hypothesis
that the statistical test is designed to consider and possibly
disprove. Typically, the null hypothesis is that there is no difference
between treatments being compared. In a randomized trial in which
investigators compare an experimental treatment with a placebo control,
one can state the null hypothesis as follows: the true difference in
effect on the outcome of interest between the experimental and control
treatments is zero. We start with the assumption that the treatments
are equally effective, and we adhere to this position unless data make
it untenable.
analysis addresses the question of whether the observed data are
consistent with the null hypothesis. The logic of the approach is as
follows: Even if the treatment truly has no positive or negative impact
on the outcome (that is, the effect size is zero), the results observed
will seldom show exact equivalence; that is, no difference at all will
be observed between the experimental and control groups. As the results
diverge further from the finding of “no difference,” the null
hypothesis that there is no difference
between
treatment effects becomes less and less credible. If the difference
between results of the treatment and control groups becomes large
enough, clinicians must abandon belief in the null hypothesis. We will
further develop the underlying logic by describing the role of chance
in clinical research.
suspected coin is tossed 10 times and, on all 10 occasions, the result
is heads.2 How likely is this to
have occurred if the coin was indeed unbiased? Most people would
conclude that it is highly unlikely that chance could explain this
extreme result. We would therefore be ready to reject the hypothesis
that the coin is unbiased (the null hypothesis) and conclude that the
coin is biased. Statistical methods allow us to be more precise by
ascertaining just how unlikely the result is to have occurred simply as
a result of chance if the null hypothesis is true. The law of
multiplicative probabilities for independent events (where one event in
no way influences the other) tells us that the probability of 10
consecutive heads can be found by multiplying the probability of a
single head (1/2) 10 times over; that is, 1/2 × 1/2 × 1/2, and so on.2
The probability of getting 10 consecutive heads is slightly less than 1
in 1000. In a journal article, one would likely see this probability
expressed as a p value, such as p <0.001.
The meaning of statistically significant, therefore, is that it is
“sufficiently unlikely to be due to chance alone that we are ready to
reject the null hypothesis.” In other words, the p
value is defined as the probability, under the assumption of no
difference (null hypothesis), of obtaining a result equal to or more
extreme than what was actually observed. Let us use the example of a
study that reports the following: patient function scores following
tibial intramedullary nailing were significantly greater than those
patients treated with plates (75 points vs. 60 points, p
<0.05). This may be interpreted as the probability that the
difference of 15 points observed in the study was due to chance is less
than 5% (or 1 in 20).
CI when reporting the precision around a proportion. One can consider
the 95% CI as defining the range that includes the true difference 95%
of the time.11 In other words, if
the investigators repeated their study 100 times, it would be expected
that the point estimate of their result would lie within the CI 95 of
those 100 times. The true point estimate will lie beyond these extremes
only 5% of the time, a property of the CI that relates closely to the
conventional level of statistical significance of p
<0.05. For example, if a study reports that nails reduced the risk
of infection by 50% compared to plates in patients with tibial shaft
fractures (95% CI: 25%-75%), one may interpret the results consistent
with as little as a 25% risk reduction or as much as a 75% risk
reduction. In other words, the true risk reduction of infection with
nails lies somewhere between 25% and 75% (95% of the time).
data from a clinical or experimental study. A number of measures can be
utilized. These include measures of central tendency (mean, median, and
mode) and measures of spread (standard deviation, range). The sample
mean is equal to the sum of the measurements divided by the number of
observations. The median of a set of measurements is the number that
falls in the middle. The mode, however, is the most frequently
occurring number in a set of measurements. Continuous variables (such
as blood pressure or body weight) can be summarized with a mean if the
data is normally distributed. If the data is not normally distributed,
then the median may be a better summary statistic. Categorical
variables (pain grade: 0, 1, 2, 3, 4, or 5) can be summarized with a
median.
will often include a measure of spread. The standard deviation is
derived from the square root of the sample variance. One standard
deviation away from the mean accounts for somewhere around 68% of the
observations. Two standard deviations away from the mean account for
roughly 95% of the observations and three standard deviations account
for about 99% of the observations.
of the deviations of the measurements about their mean. The range of a
dataset reflects the smallest value and largest value.
mortality, reoperation) of two procedures can be presented to patients
as an odds ratio, a relative risk, a relative risk reduction, an
absolute risk reduction, and the number needed to treat. Both reduction
in relative risk and reduction in absolute risk have been reported to
have the strongest influences on patient decisionmaking.15
differences between two or more means, differences between proportions,
and associations between two or more variables (Table 15-5).26
of two independent samples of normally distributed continuous data are
the same, the appropriate test statistic is called t, hence the t-test. The author of the original article describing the distribution of the t-statistic used the pseudonym Student leading to the common attribution Student’s t-test.59
When the data is nonnormally distributed, a nonparametric test such as
the Mann Whitney U or Wilcoxon rank sum test can be utilized. If the
means are paired, such as left and right knees, a paired t-test is most appropriate. The nonparametric correlate of this test is the Wilcoxon signed rank test.
(i.e., hospital stay among three tibial fracture treatment groups:
plate fixation, intramedullary nail, and external fixation), single
factor analysis of variance is a test of choice. If the test yields
statistical significance, investigators can conduct post hoc comparison
tests (usually a series of pairwise comparisons using t-tests) to determine where the differences lie. It should be recalled that the p
value (alpha level) should be adjusted for multiple post hoc tests. One
rather conservative method is the Bonferroni correction factor that
simply divides the alpha level (p = 0.05) by the number of tests performed.
|
TABLE 15-5 Common Statistical Tests*
|
||||||||||||||||||||||||||||||
|---|---|---|---|---|---|---|---|---|---|---|---|---|---|---|---|---|---|---|---|---|---|---|---|---|---|---|---|---|---|---|
|
||||||||||||||||||||||||||||||
two proportions are compared. For example, these may be the proportion
of patients in each of two treatment groups who experience an
infection. The Chi-square (χ2) test is a simple method of determining whether the proportions are really different. When samples are small, the χ2 test becomes rather approximate because the data is discrete but the χ2 distribution from which the p-value
is calculated is continuous. A “Yates’ correction” is a device that is
sometimes used to account for this, but when cell counts in the
contingency table become very low (say, less than five), the χ2 test becomes unreliable and a Fisher’s exact test is the test of choice.
may be logical to try to use one variable to predict the other. The
variable to be predicted is called the dependent variable and is to be
used for prediction is the independent variable. For such a linear
relationship, the equation y=a+bx is defined as the regression equation. A is a constant and b
the regression coefficient. Fitting the regression equation, generally
using a software package, is the process of calculating values for a and b, which allows the regression line represented by this equation to best fit the observed data. The p value reflects the result of a hypothesis test that x and y are in fact unrelated, or in this case that b is equal to zero.
(i.e., age versus hospital stay in patients with ankle fractures) can
be summarized in a single number: the correlation coefficient.
The correlation coefficient, which is denoted by the letter r, can
range from -1.0 (representing the strongest possible negative
relationship in which the person who scores the highest on variable
scores the lowest on the other variable) to 1.0 (representing the
strongest possible positive relationship in which the person who is
older also has the longest hospital stay). A correlation coefficient of
zero denotes no relationship between the two variables.
comparative study: randomized trial, observational study with control
group, case-control) can be subject to errors in hypothesis testing.
For example, when investigators conduct studies to determine whether
two treatments have different outcomes, there are four potential
outcomes (Fig. 15-5)47:
(i) a true positive result (i.e., the study correctly identifies a true
difference between treatments); (ii) a true negative result (i.e., the
study correctly identifies no difference between treatment); (iii) a
false negative result-Type II (beta) error (i.e., the study incorrectly
concludes no difference between treatments when a difference really
exists); and (iv) a false positive result-Type I (alpha) error (i.e.,
the study incorrectly concludes a difference between treatments when no
difference exists).
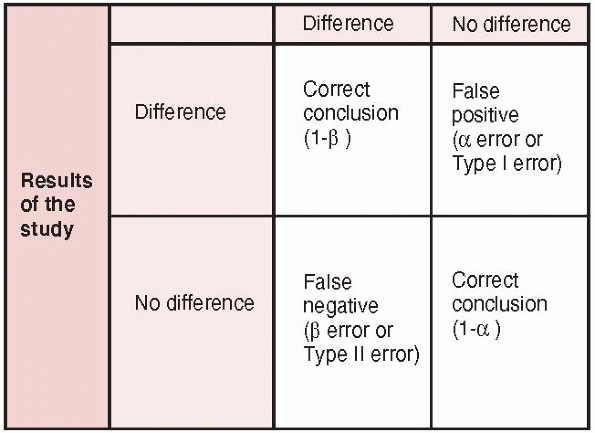 |
|
FIGURE 15-5 Errors in hypothesis testing: type I and type II errors are presented along with the power of a study (1-β).
|
sufficiently undersized to have a meaningful impact on clinical
practice. Such trials of small sample size are subject to beta errors
(Type II errors): the probability of concluding that no difference
between treatment groups exists, when, in fact, there is a difference (Fig. 15-6).
Typically, investigators will accept a beta error rate of 20% (β =
0.20), which corresponds with a study power of 80%. Most investigators
agree that beta error rates greater than 20% (study power less than
80%) are subject to unacceptably high risks of false negative results.
reviewed 117 randomized trials in trauma for type II error rates. The
mean overall study power was 24.65% (range 2%-99%). The potential type
II error rate for primary outcomes was 91%. For example, one study
demonstrated “no difference” between reamed and nonreamed tibial
intramedullary nailing; however, this study was underpowered for this
conclusion (study power = 32%). Thus, these conclusions should be
interpreted with caution.
concluding that the results of a particular study are true, when, in
fact, they are really due to chance (or random sampling error). This
erroneous false positive conclusion is designated as a type I or
α-error (see Fig. 15-6).18
By convention, most studies in orthopaedics adopt an α-error rate of
0.05. Thus, investigators can expect a false positive error about 5% of
the time. Ideally, a type I error rate is based on one comparison
between alternative treatment groups usually designated as the primary
outcome measure. In situations where no primary outcome variable has
been determined, there is a risk of conducting multiple tests of
significance on multiple outcomes measures. This form of data dredging
by investigators risks spurious false positive findings. Several
techniques are available to adjust for multiple comparisons, such as
the Bonferroni correction.
 |
|
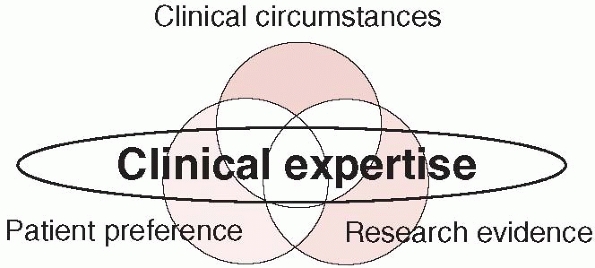
FIGURE 15-6
The current conceptual framework for evidence-based practice encompassing research findings, patients’ values and preferences, clinical circumstances, and expertise. |
<0.05) between two treatment groups. This situation typically occurs
when investigators are not sure what they are looking for and therefore
test several hypotheses hoping that one may be true. Statistical
aspects of the multiple testing issues are straightforward. If n
independent associations are examined for statistical significance, the
probability that at least one of them will be found statistically
significant is 1-(1-α)n if all n
of the individual null hypotheses are true. Therefore, it is argued
that studies that generate a large number of measures of association
have markedly greater probability of generating some false-positive
results because of random error than does the stated alpha level for
individual comparisons.
conducted a review of recently published randomized trials (within the
last 2 years) to determine the risk of type I errors among surgical
trials that did not explicitly state a primary outcome. One study
examining outcomes in two different uncemented total knee arthroplasty
designs evaluated 21 different outcome measures and found 13 outcomes
that were significantly different between groups. As there was no clear
statement about a designated primary outcome measure, the risk of a
false-positive result was 66%.18
For instance, in a study of operative versus nonoperative management of
calcaneal fractures, investigators may report no difference in the
overall outcome (patient function) but subsequently conduct a series of
comparisons across different patient subgroups (gender, disability
status, or comorbidities). Subgroup analyses are frequently post hoc
analyses that risk false-positive results (type I error) in which
ineffective (or even harmful) treatments may be deemed beneficial in a
subgroup. Conducting multiple statistical tests risks spurious
false-positive findings. Alternatively, false-negative results may
occur because negative subgroup analyses are often underpowered.
identified important errors in surgical RCTs related to subgroup
analyses. The majority of authors did not report whether subgroup
analyses were planned a priori, and these analyses often formed the
basis of the RCT conclusions. Inferences from such RCTs may be
misleading and their application to clinical practice unwarranted.43,53
other surgical subspecialties, 27 (38%) RCTs reported a total of 54
subgroup analyses with a minimum of 1 and maximum of 32
subgroup analyses per study.8
The majority of subgroup analyses 49 (91%) were performed post hoc and
not stated to be preplanned at the outset of the study nor included in
the hypothesis. The majority of investigators inappropriately used
tests of significance when comparing outcomes between subgroups of
patients (41 subgroup analyses, 76%); however, only three of the
analyses were performed using statistical tests for interaction.
Investigators reported differences between subgroups in 31 (57%) of the
analyses, all of which were featured in the summary or conclusion of
the published paper.
with caution. The validity of a subgroup analysis can be improved by
defining a few important (and biologically plausible) subgroups prior
to conducting a study and conducting statistical tests of interaction.
When faced with a subgroup analysis in a published scientific paper,
readers should ask the following questions: Is the subgroup difference
suggested by comparisons within rather than between studies? Did the
hypothesis precede rather than follow the analysis? Was the subgroup
effect one of a small number of hypothesized effects tested? Is the
magnitude of the effect large? Was the effect statistically
significant? Is the effect consistent across studies? Is there indirect
evidence that supports the hypothesized subgroup effect?
treatments may not necessarily reflect a clinically important
difference. Although it is well known that orthopaedic studies with
small sample sizes risk underpowered false negative conclusions (beta
errors), statistically significant findings in small trials can occur
at the consequence of very large differences between treatments
(treatment effect). It is not uncommon for randomized trials to report
relative risk reductions larger than 50% when comparing one treatment
with another.
conducted a comprehensive search for all RCTs between January 1, 1995,
and December 31, 2004. Eligible studies included those that focused
upon orthopaedic trauma. Baseline characteristics and treatment effects
were abstracted by two reviewers. Briefly, for continuous outcome
measures (i.e., functional scores), effect sizes (mean
difference/standard deviation) were calculated. Dichotomous variables
(i.e., infection, nonunion) were summarized as absolute risk
differences and relative risk reductions (RRR). Effect sizes >0.80
and RRRs greater than 50% were defined as large effects.
RCTs had statistically significant findings on 184 outcomes (122
continuous/62 dichotomous outcomes). The average study reported large
reductions (>50% RRR) in the risk of an adverse outcome event versus
a comparative treatment; however, almost 1 in 2 study outcomes (47%)
had RRRs less than 50%, and over 1 in 5 (23%) had RRRs less than 20%.
difference between two treatments when one actually exists. Power (1-β)
is simply the complement of the type II error (β). Thus, if we accept a
20% chance of an incorrect study conclusion (β = 0.20), we are also
accepting that we will come to the correct conclusion 80% of the time.
Study power can be used before the start of a clinical trial to assist
with sample size determination, or following the completion of study to
determine if the negative findings were true (or due to chance).
of the magnitude of the treatment effect, the designated type I error
rate (α), and the sample size (n). When designing a trial,
investigators can decide upon the desired study power (1-β) and
calculate the necessary sample to achieve this goal.26
Numerous free sample size calculators are available on the internet and
use the same principles and formulae estimating sample size in clinical
trials.
pressure, functional outcome score, time to healing). For example, in
planning a trial of alternate strategies for the treatment of humeral
shaft fractures, an investigator may identify a systematic review of
the literature that reports that time to fracture healing with
Treatment A is 110 ± 45 days, while time to healing with Treatment B
(control group) can be expected to be up to 130 ± 40 days. The expected
treatment difference is 20 days and the effect size (mean
difference/standard deviation) is 0.5 (20/40). Effect sizes can be
categorized as small (0.10), medium (0.30), and large (0.50). The
anticipated sample size for this continuous outcome measure is
determined by a standard equation.
patients in total to have sufficient power to identify a difference of
20 days between treatments, if it occurs. An investigator may then
audit his or her center’s previous year and decide if enough patients
will present to the center to meet the sample size requirements. Table 15-6
provides additional scenarios and the sample size requirements for
varying differences in healing times between treatment and control
groups. As the difference between treatments diminishes, the sample
size requirements increase (see Table 15-6).
functional outcome scores in patients with ankle fractures treated
operatively versus nonoperatively. Previous studies using the
functional outcome score have reported standard deviations for
operative and nonoperative cases of 12 points, respectively. Based upon
previous studies, we want to be able to detect a difference of 5 points
on this functional outcome score between treatments.
chapter, our proposed study will require 90 patients per treatment arm
to have adequate study power.
|
TABLE 15-6 Sample Size Requirements for Continuous Outcome (Time to Fracture Healing)
|
||||||||||||||||
|---|---|---|---|---|---|---|---|---|---|---|---|---|---|---|---|---|
|
calculated for any given sample size by transforming the above formula
and calculating the z-score:
From the above example, the z-score will be 0.84 for a sample size of
90 patients. The corresponding study power for a z-score of 0.84 is 80%.
two options (i.e., infection or not, nonunion or not, alive or dead).
Let’s assume that this same investigator chooses nonunion as the
primary outcome instead of time to union. Based upon the previous
literature, he or she believes that Treatment A will result in a 95%
union rate and Treatment B (control group) will result in a 90% union
rate. Eight hundred and sixty-nine patients are required for the study
to identify a 5% difference in nonunion rates between treatments. An
investigator may realize that this number is sufficiently large enough
to prohibit the trial being conducted at one center and may elect to
gain support at multiple sites for this trial. For example, in a
proposed trial using pulmonary embolus risk as the primary outcome, the
number of patients required may be prohibitive (Table 15-7).
assume that we wish to change our outcome measure to differences in
secondary surgical procedures between operative and nonoperatively
treated ankle fractures. A clinically important difference is
considered to be 5%. Based upon the previous literature, it is
estimated that the secondary surgical rates in operative and
nonoperative treated ankles will be 5% and 10%, respectively. The
number of patients required for our study can now be calculated from
the equation presented in the Appendix.
calculated for any given sample size by transforming the above formula
and calculating the z-score:
|
TABLE 15-7 Sample Size Requirements for Difference Baseline Risks of Pulmonary Embolus
|
||||||||||||||||
|---|---|---|---|---|---|---|---|---|---|---|---|---|---|---|---|---|
|
sample size of 433 patients. The corresponding study power for a
z-score of 0.84 is 80%.
move toward identifying patient relevant and clinically important
measures to evaluate the success (or failure) of surgical
interventions. Common to any outcome measure that gains widespread use
should be its reliability and validity. Reliability refers to the
extent to which an instrument yields the same results in repeated
applications in a population with stable health. In other words,
reliability represents the extent to which the instrument is free of
random error. Validity is an estimation of the extent to which an
instrument measures what it was intended to measure. The process of
validating an instrument involves accumulating evidence that indicates
the degree to which the measure represents what it was intended to
represent. Some of these methods include face, content, and construct
validity.6,30
of complete physical, mental, and social well-being.” Thus, when
measuring health in a clinical or research setting, questioning a
patient’s well-being within each of these domains is necessary to
comprehensively represent the concept of health. Instruments that
measure aspects of this broad concept of health are often referred to
as health-related quality of life (HRQOL) measures. These measures
encompass a broad spectrum of items including those associated with
activities of daily life, such as work, recreation, household
management, and relationships with family, friends, and social groups.
HRQOL considers not only the ability to function within these roles,
but also the degree of satisfaction derived from performing them.
status inclusive of physical symptoms, function, and emotional
dimensions of health. A disadvantage of generic instruments, however,
is that they may not be sensitive enough to be able to detect small but
important changes.26
tailored to inquire about the specific physical, mental, and social
aspects of health affected by the disease in question, allowing them to
detect small, important changes.30
Therefore, in order to provide the most comprehensive evaluation of
treatment effects, no matter the disease or intervention, investigators
often include both a disease-specific and generic health measure. In
fact, many granting agencies and ethics boards insist that a generic
instrument be included in the design of proposed clinical studies.
surgical study (i.e., quality of fracture reduction) and validated
measures of patient function and quality of life is an ideal
combination. While an intra-articular step off in a tibial plafond
fracture may be viewed as a less than satisfactory radiograph outcome,
there may be no detectable effect on patient function or quality of
life.35
measure to discriminate between patients across a spectrum of the
injury in question. Questionnaires may sometimes exhibit ceiling
and
floor effects. Ceiling effects occur when the instrument is too easy
and all respondents score the highest possible score. Alternatively,
floor effects can occur if the instrument is very difficult or tapping
into rare issues associated with the disease. Most patients will score
the lowest possible score. Miranda et al.,39
in a study of 80 patients with pelvic fractures, found that the
severity of pelvic fracture did not alter Short Form-36 and Iowa pelvic
scores.
functional outcomes remained equally poor. This was likely related to
the associated soft tissue injuries that created a “floor effect”
limiting the ability to discriminate between the orthopaedic injuries.
five-item scale that is designed to allow people to describe their
health state across five dimensions.17
There are three response categories that combine for a total of 243
possible health states. The preference weight allows a single numeric
score from slightly less than zero (theoretically worse than death) to
one (best health state). EQ-5D scores are used in economic appraisals
(such as cost utility analyses) in the construction of qualityadjusted
life years for the calculation of cost per quality of life year gained
and its comparison across interventions.
status. It is probably one of the most widely used measures. The SF-36
has 35 items that fit into one of 8 subscales. One additional item is
not used in the scores. In 1994, the developers, led by John Ware,60
produced two summary scores for the SF-36: – the physical component
score (more heavily weights dimensions of pain, physical function, and
role function physical) and the mental component score (more weight
given to mental health, vitality, etc). The two physical component
scores are standardized, so the general population (based on a U.S.
sample) will score 50 on average, with a standard deviation of 10. The
subscale scores, often presented as a profile graph, are scored on a
scale of 0-100 where 100 is a good health state.
(S-MFA) is a 46-item questionnaire that is a shortened version of
Swionkowski’s full Musculoskeletal Functional Assessment.61
The S-MFA has two main scores: the function index (items 1-34) and the
bothersome index (items 35-46). The functional index is subdivided into
4 subscales (daily activities, emotional status, arm and hand function,
and mobility). The S-MFA has been tested in patients with
musculoskeletal disorders, as this is the target population. The
psychometric properties are high, suggesting that it can be used for
monitoring individual patients. The S-MFA was designed to describe the
various levels of function in people with musculoskeletal disorders, as
well as monitor change over time. The SMFA correlates highly with the
SF-36 and use of both instruments in the same patient population is
likely redundant.
(DASH) is a 30-item questionnaire designed to measure physical function
and disability in any or all disorders of the upper limb. It is
therefore designed to be sensitive to disability and change in
disability in the hand as well as in the shoulder. In one study, it was
directly compared to a shoulder and a wrist measure, and had similar
levels of construct validity, responsiveness, and reliability. Another
study showed slightly lower properties in the DASH as compared to a
wrist specific measure in patients with wrist fracture. Like the S-MFA,
the measurement properties of the DASH are quite high (internal
consistency 0.96, test-retest 0.95, good validity and responsiveness)
suggesting it could also be used in individual patients in a clinical
setting.
(WOMAC) is a 24-item scale divided into three dimensions: function,
pain, and stiffness. The most commonly used response scale is a
fivepoint Likert; however, there is a visual analogue scale version. It
has been widely used and tested in the field of osteoarthritis and
rheumatoid arthritis and a review of its psychometric properties was
summarized by McConnell et al.37 in 2001. The WOMAC is the most commonly used and endorsed patient-based outcome after hip or knee arthroplasty.
patient-administered, 14-item questionnaire that uses a 100-point
summated rating scale. A higher score suggests better health status.
Equal weight is given to the domains of the overall impact of
arthritis, pain, walking, and function. This questionnaire is designed
to assess outcomes after total hip replacement surgery. According to
Johanson et al.,32 2-week
test-retest administrations produced a weighted Kappa score of 0.70,
and the sensitivity to change was deemed to be excellent.
clinician-administered questionnaire designed to assess patients with
traumatic arthritis of the hip.44 It
is a 10-item questionnaire that uses a 100-point summated rating scale
and takes approximately 15 to 30 minutes to administer. There are four
domains: the pain domain contributes 44 points; function, 47; range of
motion; 5; and absence of deformity, 4. The function domain is divided
into gait and activities, while deformity considers hip flexion,
adduction, internal rotation, and limb-length discrepancy and range of
motion measures.44 A higher score
suggests better health status. The HHS is the most commonly used
scoring system for evaluating hip arthroplasty. Its responsiveness has
been found to be comparable to and, in some cases, better than the
WOMAC pain and function subscales.44
items comprising three main components: basic activities of daily
living assessed by four items and contributing 44 points, instrumental
activities of daily living assessed by six items and contributing 33
points, and mobility assessed by one item and contributing 33 points.
Therefore, complete independence in basic and instrumental activities
of daily living and mobility will give a score of 100 points.54,55 It is a patient-oriented outcomes measure that is designed to assess functional recovery for ambulatory hip fracture patients.54,55 Use of the FRS can provide the means of assessing the recovery of prefracture function.54,55 The FRS has been found to be responsive to change, reliable, and has predictive validity as well as discriminant validity.55
|
TABLE 15-8 Commonly Used Outcome Measures
|
|||||||||||||||||||||||||||||||||||||||||||||||||||||||||||||||||||||||||||||||||||||||||||||||||||||||||||||||||||||||||||||||||||||||||||||||||||||||||||||||||||||
|---|---|---|---|---|---|---|---|---|---|---|---|---|---|---|---|---|---|---|---|---|---|---|---|---|---|---|---|---|---|---|---|---|---|---|---|---|---|---|---|---|---|---|---|---|---|---|---|---|---|---|---|---|---|---|---|---|---|---|---|---|---|---|---|---|---|---|---|---|---|---|---|---|---|---|---|---|---|---|---|---|---|---|---|---|---|---|---|---|---|---|---|---|---|---|---|---|---|---|---|---|---|---|---|---|---|---|---|---|---|---|---|---|---|---|---|---|---|---|---|---|---|---|---|---|---|---|---|---|---|---|---|---|---|---|---|---|---|---|---|---|---|---|---|---|---|---|---|---|---|---|---|---|---|---|---|---|---|---|---|---|---|---|---|---|---|
|
|||||||||||||||||||||||||||||||||||||||||||||||||||||||||||||||||||||||||||||||||||||||||||||||||||||||||||||||||||||||||||||||||||||||||||||||||||||||||||||||||||||
measure of balance in elderly people and is an in-person assessment.
The GUG test measures the time a person takes to get up from a chair
and walk 15.2 m (50 ft) as fast as possible along a level and
unobstructed corridor. Thus, this performance-based measure of physical
function requires the patient to be able to rise from a seated
position, walk, and maintain his or her balance.42
The scoring of this instrument is based on balance function, which is
scored on a 5-point scale, with 1 indicating normal and 5 indicating
severely abnormal. A patient with a score of 3 or more is at risk for
falling. Mathias et al.36 found that
when patients underwent laboratory tests of balance and gait, there was
good correlation between the laboratory tests and the objective
assessment.
domains: pain, mobility and walking ability. These three domains have
the same impact. The scores for pain and walking ability can be added
and subsequently classified into the grades very good, good, medium,
fair, and poor. These grades are then adjusted down by 1-2 grades to
account for the mobility score, which results in the final clinical
grade. The modified MDP is slightly different from the original in
terms of language and grading, as the modified version is calculated a
scale of 0-6 (as opposed to 1-6) and does not combine the scores to
obtain a total score.41
is designed to assess short- and long-term patient relevant outcomes
after knee injury.46 The KOOS was
designed based on the WOMAC, literature review, and an expert panel and
has been statistically validated for content validity, construct
validity, reliability, and responsiveness. The questionnaire is
composed of 42 items that are scored on a Likert scale. A higher score
indicates better health status. Subscales include pain, symptoms,
activities of daily living, sport and recreation, and knee-related
quality of life.46
This questionnaire is a modification of the Toronto Extremity Salvage
Score and has been statistically confirmed for reliability, validity,
and responsiveness. The Lower Extremity Measure is composed of 29 items
on a Likert scale and administration takes approximately 5 minutes.
This questionnaire has been designed for an elderly population, with 10
points indicating significant clinical change.31
It is composed of 9 items on a summated rating scale and has been
compared to the visual analog scale (VAS), range of motion,
osteoarthritis, and dislocation for statistical validation. A higher
score indicates better health status.40
Assessment Form is designed to assess the shoulder and elbow and is
patient- and clinician-administered.38
There is no cost to obtain this instrument. Subscales include shoulder
score index pain, instability, activities of daily living, range of
motion, signs, and strength. A higher score indicates better health
status. The instrument is a combination of VAS and Yes/No scaled
questions. Administration by the patient takes approximately 3 minutes.38
designed for use among patients with foot or ankle dysfunction. It
contains four region-specific scales, including ankle-hindfoot,
midfoot, hallux metatarsophalangeal, and lesser
metatarsophalangeal-interphalangeal scales. Patients self report
information about pain and function in each region. This scale also
incorporates physical examination results recorded by the clinician.
Although the American Orthopedic Foot and Ankle Scale has been widely
used in studies of foot and ankle surgical outcomes, limitations have
also been reported.49,50
document for applicants to the Internal Medicine residency program at
McMaster University in Ontario, Canada, which described EBM as an
attitude of enlightened skepticism toward the application of
diagnostic, therapeutic, and prognostic technologies. As outlined in
the text Clinical Epidemiology and first described in the literature in the ACP Journal Club
in 1991, the EBM approach to practicing medicine relies on an awareness
of the evidence upon which a clinician’s practice is based and the
strength of inference permitted by that evidence.27
The most sophisticated practice of EBM requires, in turn, a clear
delineation of relevant clinical questions, a thorough search of the
literature relating to the questions, a critical appraisal of available
evidence and its applicability to the clinical situation, and a
balanced application of the conclusions to the clinical problem. The
balanced application of the evidence (i.e., the clinical
decision-making) is the central point of practicing evidence-based
medicine and involves, according to EBM principles, integration of our
clinical expertise and judgment with patients’ preferences and societal
values and with the best available research evidence (see Fig. 15-6).
The EBM working group at McMaster University has proposed a working
model for evidence-based clinical practice that encompasses current
research evidence, patient preferences, clinical circumstances, and
clinical expertise. EBM is commonly misunderstood as removing clinical
expertise as a factor in patient decision-making. This is not so. The
common thread that weaves the relationships between patients,
circumstances, and research is the experience and skill of the surgeon.
the necessary skills to find the “best” evidence available to answer
clinically important questions. Reading a few articles published in
common orthopedic journals each month is insufficient preparation for
answering the questions that emerge in daily practice. There are at
least 100 orthopaedic journals indexed by MEDLINE.2
For surgeons whose principal interest is orthopaedic traumatology, the
list is even larger. Given their large clinical demands, surgeons’
evidence searches must be timeefficient. Evidence summaries (such as
those published in the Journal of Orthopaedic Trauma) and systematic reviews (comprehensive literature reviews) are useful resources for surgeons (Table 15-9).
The most efficient way to find them is by electronic searching of
databases and/or the internet. With time at a premium, it is important
to know where to look and how to develop a search strategy, or filter,
in order to identify the evidence most efficiently and effectively.
associated risks. Before implementing a new therapy, one should
ascertain the benefits and risks of the therapy, and be assured that
the resources consumed in the intervention will not be exorbitant. A
simple three-step approach can be used when reading an article from the
orthopaedic literature (Table 15-10). It is
prudent to ask whether the study can provide valid results (internal
validity), to review the results, and to consider how the results can
be applied to patient care (generalizability). Lack of randomization,
no concealment of treatment allocation, lack of blinding, and
incomplete follow-up are serious threats to the validity of a published
randomized trial. The user’s guide focuses the assessment on assuring
that investigators have considered these issues in the conduct of their
study. Understanding the language of EBM is also important. Table 15-11
provides a summary of common terms used when considering the results of
a clinical paper. While randomized trials sit atop the hierarchy of an
intervention, not all orthopaedic research questions are suitable for
randomized trials. For example, observational studies (prospective
cohorts) are more suitable designs when evaluating prognosis (or risk
factors) for outcome following a surgical procedure. However, common
problems with alternative (and accepted) surgical treatments argue
strongly in favor of randomized trials. Complex problems with
nonconsensus in surgical technique or lack of acceptance of one
approach argue in favor of observational studies to further elucidate
the technique as well as understand the indications for alternative
approaches prior to embarking on an randomized trial.
|
TABLE 15-9 Finding Current Evidence: Resources
|
|||||||||||||||||||||||||||||||||||||||||||||||||||||||||||||||||||||||||||||||||||||||||||||
|---|---|---|---|---|---|---|---|---|---|---|---|---|---|---|---|---|---|---|---|---|---|---|---|---|---|---|---|---|---|---|---|---|---|---|---|---|---|---|---|---|---|---|---|---|---|---|---|---|---|---|---|---|---|---|---|---|---|---|---|---|---|---|---|---|---|---|---|---|---|---|---|---|---|---|---|---|---|---|---|---|---|---|---|---|---|---|---|---|---|---|---|---|---|
|
|||||||||||||||||||||||||||||||||||||||||||||||||||||||||||||||||||||||||||||||||||||||||||||
medical education at a variety of levels. An analysis of the literature
related to journal clubs in residency programs in specialties other
than orthopaedic surgery reveals that the three most common goals were
to teach critical appraisal skills (67%), to have an impact on clinical
practice (59%), and to keep up with the current literature (56%).25
The implementation of the structured article review checklist has been
found to increase resident satisfaction and improve the perceived
educational value of the journal club without increasing resident
workload or decreasing attendance at the conference.
|
TABLE 15-10 User’s Guide to Orthopaedic Randomized Trials
|
||||||||||||||||||||||||||||||||||||||
|---|---|---|---|---|---|---|---|---|---|---|---|---|---|---|---|---|---|---|---|---|---|---|---|---|---|---|---|---|---|---|---|---|---|---|---|---|---|---|
|
||||||||||||||||||||||||||||||||||||||
|
TABLE 15-11 Presentation of Results
|
|||||||||||||||||||||||||||||||||||||||||||||||||||||||||||||||||||||||||||
|---|---|---|---|---|---|---|---|---|---|---|---|---|---|---|---|---|---|---|---|---|---|---|---|---|---|---|---|---|---|---|---|---|---|---|---|---|---|---|---|---|---|---|---|---|---|---|---|---|---|---|---|---|---|---|---|---|---|---|---|---|---|---|---|---|---|---|---|---|---|---|---|---|---|---|---|
|
|||||||||||||||||||||||||||||||||||||||||||||||||||||||||||||||||||||||||||
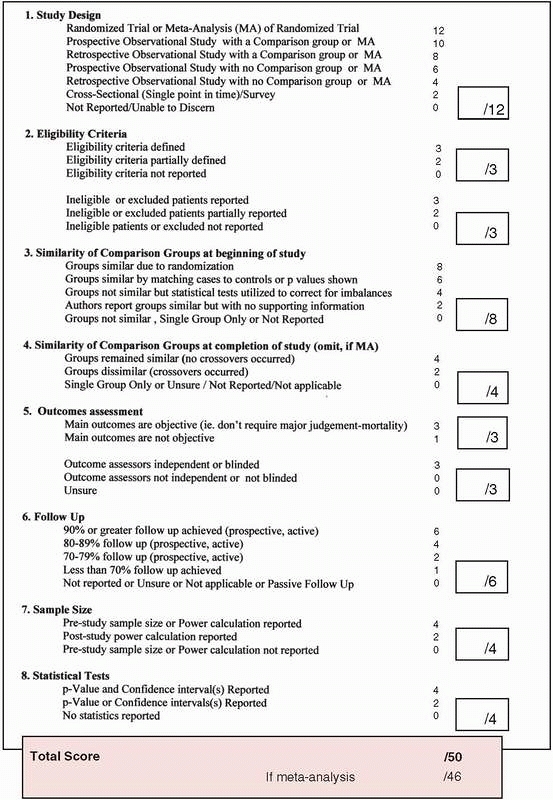
number of orthopaedic training programs; assessments of the outcomes
and effectiveness of this format for journal club are ongoing. One
example of one structured review instrument for use in orthopaedic
training programs is provided in Fig. 15-7.
proliferation of randomized trials. While the strength of evidence is
most persuasive in large, randomized trials with small CIs around their
treatment effect, this is not always feasible for many clinical
problems in orthopaedics. Indeed, only 3% (72 of 2498 studies) of
studies published in orthopaedics reflect randomized trial methodology.13
The design, conduct, and analysis of orthopaedic research has gained
widespread appreciation in surgery, particularly in orthopaedic
surgery. Still, only 14% of the original contributions in JBJS
represent Level I evidence.14 When
randomization is either not feasible or unethical, prospective
observational studies represent the best evidence. Approximately 1 in 5
scientific articles published in JBJS represent this Level II evidence.14 In a more recent review of the literature, Chan et al.21
identified 87 randomized trials in orthopaedic surgical procedures,
representing 14% of the published studies. JBJS contributed 4.1% of the
published randomized trials in this report.
base practice if we conduct RCTs whenever feasible, ensure adequate
sample size, involve biostatisticians and methodologists, collect data
meticulously, and accurately report our results using sensible outcomes
and measures of treatment effect. Limiting type II errors (beta errors)
will need multicenter initiatives.
These
larger trials have the advantage of increased generalizability of the
results and the potential for large scale and efficient recruitment
(1000 patients or more). Single center trials that may have taken a
decade to recruit enough patients can now be completed in a few years
with collaborative research trials. The obvious drawback with
multicenter initiatives is the relative complexity of the design and
the cost. It is reasonable to expect that a trial of over 1000 patients
will cost more than $3-4 million to conduct.
 |
|
FIGURE 15-7 A checklist to assess the quality of surgical therapies.
|
provide healthcare practitioners and decision-makers (physicians,
nurses, administrators, regulators) with tools that allow them to
gather, access, interpret, and summarize the evidence required to
inform their decisions and to explicitly integrate this evidence with
the values of patients. In this sense, EBM is not an end in itself, but
rather a set of principles and tools that help clinicians distinguish
ignorance of evidence from real scientific uncertainty, distinguish
evidence from unsubstantiated opinions, and ultimately provide better
patient care.
obtain 80% study power (β = 0.20) at a 0.05 alpha level of significance
is as follows:
obtain 80% study power (β = 0.20) at a 0.05 alpha level of significance
is as follows:
Medical Association. User’s guides to the medical literature: a manual
for evidence-based clinical practice. In Guyatt GH, Rennie D, eds. 2nd
ed. Chicago: American Medical Association Press, 2001.
D, Briss PA, Eccles M, et al. Systems for grading the quality of
evidence and the strength of recommendations II: pilot study of a new
system. BMC Health Serv Res 2005;5(1):25.
D, Eccles M, Flottorp S, et al. Systems for grading the quality of
evidence and the strength of recommendations I: critical appraisal of
existing approaches. The GRADE Working Group. BMC Health Serv Res
2004;4:38.
M, Devereaux PJ, Li P, et al. The misuse of baseline comparison tests
and subgroup analyses in surgical randomized controlled trials. Clin
Orthop Relat Res 2006; 447:247-251.
M, Guyatt GH, Siddiqui F, et al. Operative versus nonoperative
treatment of achilles tendon rupture—a systematic overview and
meta-analysis. Clin Orthop Relat Res 2002:400:190-200.
M, Guyatt GH, Swiontkowski MF. User’s guide to the orthopaedic
literature: how to use an article about a prognosis. J Bone Joint Surg
2001;83A:1555-1564.
M, Guyatt GH, Swiontkowski MF. User’s guide to the orthopaedic
literature: how to use an article about a surgical therapy. J Bone
Joint Surg 2001;83A:916-926.
M, Montori VM, Devereaux PJ, et al. Doubling the impact: publication of
systematic review articles in orthopaedic journals. J Bone Joint Surg
Am 2004;86:1012-1016.
M, Richards R, Schemitsch EH. The quality of randomized trials in
Journal of Bone and Joint Surgery from 1988-2000. J Bone Joint Surg Am
2002;84A:388-396.
M, Swiontkowski MF, Einhorn TA, et al. Interobserver agreement in the
application of levels of evidence to scientific papers in the American
volume of the Journal of Bone and Joint Surgery. J Bone Joint Surg Am
2004;86A:1717-1720.
M, Tornetta III P. Issues in the hierarchy of study design, hypothesis
testing, and presentation of results. Tech Orthop 2004:19:57-65.
M, Tornetta P III, Ellis T, et al. Hierarchy of evidence: differences
in results between nonrandomized studies and randomized trials in
patients with femoral neck fractures. Arch Orthop Trauma Surg
2004;124(1):10-16.
M, Whang W, Kuo JC, et al. The risk of false-positive results in
orthopaedic surgical trials. Clin Orthop 2003;413:63-69.
M, Zlowodzki M, Cole PA. From eminence-based practice to evidence-based
practice: a paradigm shift. Minn Med 2004;4:51-54.
B, Bhandari M, Tornetta P III, et al. Hierarchy of evidence: from case
reports to randomized controlled trials. Clin Orthop 2003;413:19-24.
S, Bhandari M. The quality of reporting of orthopaedic randomized
trials with use of a checklist for nonpharmacological therapies. J Bone
Joint Surg Am 2007;89:1970-1978.
J, Shah N, Horwitz RI. Randomized, controlled trials, observational
studies, and the hierarchy of research designs. N Engl J Med
2000;342:1887-1894.
PJ, Manns BJ, Ghali W, et al. In the dark: physician interpretations
and textbook definitions of blinding terminology in randomized
controlled trials. JAMA 2001;285:2000-2003.
DR, Tornetta P III, Bhandari M. Designing, conducting, and evaluating
journal clubs in orthopaedic surgery. Clin Orthop 2003;413:146-157.
EC/IC Bypass Study Group. Failure of extracranial-intracranial arterial
bypass to reduce the risk of ischemic stroke: results of an
international randomized trial. N Engl J Med 1985;313:1191-1200.
P, Autier P, Boonen S. Clinical risk factors for hip fracture in
elderly women: a case-control study. J Orthop Trauma 2002;6:379-385.
JP, Haidich AB, Pappa M, et al. Comparison of evidence of treatment
effects in randomized and nonrandomized studies. JAMA 2001;286:821-830.
S, Lakhani Z, Schatzker J. Reliability, validity, and responsiveness of
the lower extremity measure for patients with a hip fracture. J Bone
Joint Surg Am 2000;82-A:955-962.
NA, Charlson ME, Szatrowske TP, et al. A self-administered hip-rating
questionnaire for the assessment of outcome after total hip
replacement. J Bone Joint Surg Am 1992;74:587-597.
R, Oxman AD. The unpredictability paradox: review of empirical
comparisons of randomized and nonrandomized clinical trials. BMJ
1998;317:1185-1190.
H, Bhandari M, Tornetta P III. Type II error rates (beta errors) in
randomized trials in orthopaedic trauma. J Bone Joint Surg
2002;83A:1650-1655.
JL, Weigel DP, Dirschl DR. Tibial plafond fractures. How do these
ankles function over time? J Bone Joint Surg Am 2003;85A:287-295.
S, Kolopack P, Davis AM. The Western Ontario and McMaster Universities
Osteoarthritis Index (WOMAC): a review of its utility and measurement
properties. Arthritis Rheum 2001;45:453-461.
LA, McClure PW, Sennett BJ. American Shoulder and Elbow Surgeons
Standardized Shoulder Assessment Form patient self-report section:
reliability, validity, and responsiveness. J Shoulder Elbow Surg
2002;11:587-594.
MA, Riemer BL, Butterfield SL, et al. Pelvic ring injuries. A long-term
functional outcome study. Clin Orthop Relat Res 1996;329:152-159.
S, Sandvik L, Madsen JE, et al. Comparison of distribution, agreement,
and correlation between the original and modified Merle
d’Aubigné-Postel Score and the Harris Hip Score after acetabular
fracture treatment: moderate-agreement, high-ceiling effect and
excellent correlation in 450 patients. Acta Orthop Scand
2005;76:796-802.
SR, Fitzgerald GK, Irrgang JJ, et al. Get-up-and-go test in patients
with knee osteoarthritis. Arch Phys Med Rehabil 2004;85:284-289.
S, Assman S, Enos L, et al. Subgroup analysis, covariate adjustment,
and baseline comparisons in clinical trial reporting: current practice
and problems. Stats Med 2002; 21:2917-2930.
M, Fairbank J. The Roland-Morris disability questionnaire and the
Oswestry disability questionnaire. Spine 2000;25:3115-3124.
EM, Toksvig-Larsen S. Knee injury and Osteoarthritis Outcome Score
(KOOS)— validation and comparison to the WOMAC in total knee
replacement. Health Qual Life Outcomes 2003;1:17.
DL, Haynes RB, Guyatt GH, et al. Clinical Epidemiology: A Basic Science
for Clinical Medicine. Boston: Little Brown, 1991.
DL, Richardson WS, Rosenberg WM, et al. Evidence-Based Medicine: How to
Practice and Teach EBM. New York: Churchill Livingstone, 1997
CL, Domsic RT, Baumhauer JF. Foot and ankle research priority: report
from the Research Council of the American Orthopaedic Foot and Ankle
Society. Foot Ankle Int 1997;18:447-448.
NF, Shuler M, Fleming LL. Evaluation of the validity of the AOFAS
Clinical Rating Systems by correlation to the SF-36. Foot Ankle Int
2003;24:50-55.
J, Siegel J, Tornetta P III et al. The orthopaedic trauma literature:
an evaluation of statistically significant findings in orthopaedic
trauma randomized trials. BMC Musculoskelet Disord 2008;29(9):14.
S, Wittes J, Probstfield J, et al. Analysis and interpretation of
treatment effects in subgroups of patients in randomized clinical
trials. JAMA 1991;266:93-98.
JD, Koval KJ, Aharonoff GB, et al. A functional recovery score for
elderly hip patients: I. Development. J Orthop Trauma 2000:14:20-25.
JD, Koval KJ, Aharonoff GB, et al. A functional recovery score for
elderly hip patients: II. Validity and reliability. J Orthop Trauma
2000:14:26-30.
RB, Mukherjee J, Sackett D, et al. Functional status changes following
medical or surgical treatment for cerebral ischemia: results in the
EC/IC, Bypass Study. JAMA 1987;257:2043-2046.
Investigators, Bhandari M, Guyatt G, et al. Study to prospectively
evaluate reamed intramedullary nails in patients with tibial fractures
(SPRINT): study rationale and design. BMC Musculoskeletal Discord
2008;9:91.
Investigators, Bhandari M, Guyatt G, et al. Randomized trial of reamed
and unreamed intramedullary nailing of tibial shaft fractures. J Bone
Joint Surg Am 2008;90:2567-2578.