
factors affecting health and disease in populations. As such,
epidemiology is the cornerstone of an evidence-based approach to
preventing disease and to optimizing treatment strategies. The term
“epidemiology” is derived from the Greek roots epi = upon, demos = people, logos
= study, meaning “the study of what is upon the people.” An
understanding of the epidemiology of pediatric trauma is a prerequisite
for the timely evolution of optimal care strategies and for the
development of effective prevention strategies.
children, pediatric trauma presents one of the largest challenges to
the health of children, as well as a great opportunity for positive
impact. It is estimated that more than 11 million hospitalizations and
15,000 deaths result from childhood injury every year. While children
more often survive significant injury than adults, survivors of
significant trauma may be left with long-term functional problems.1
an injury every year, with 10% to 25% of these injuries consisting of a
fracture. In fact, on both the outpatient and inpatient sides,
musculoskeletal trauma makes up the largest share of pediatric injuries.106
is among the highest in the developing world, reflecting the realities
of urban violence, firearms, and the dangers of a highly mechanized
society. Given the wide-reaching impact that pediatric musculoskeletal
injury has on public health, an understanding of the epidemiology of
pediatric fractures provides an opportunity to maximize efforts aimed
at prevention and optimal treatment. In the years since the production
of the first edition of Fractures in Children, there have been many changes in the incidence, etiology, and philosophy of management of children’s fractures.
role for operative management for many children’s fractures. In most
instances, operative management produces better results than
nonoperative treatment, but this shift in treatment has not been
without some controversy.
the changes in the previous editions of this textbook. In the first
edition,100 very little mention was
made regarding intramedullary (IM) fixation of either femoral or radial
and ulnar shaft fractures. There was an extensive discussion of methods
of traction for femoral shaft fractures and supracondylar fractures. In
the fifth edition,10 the reverse was true. There was considerable discussion of IM fixation and very little mention of traction techniques.
the result of four factors: (i) improvements in technology, (ii) rapid
healing that allows minimal and temporary fixation, (iii) financial and
social pressures to limit the hospitalization of children, and (iv) an
expectation by the public for a “perfect outcome” in every case.
the ease of reducing and internally stabilizing fractures with
percutaneous methods. Other technical advances, such as widespread
access to computed tomography (CT) and magnetic resonance imaging
(MRI), have expanded the ability to better define the fracture
patterns. The use of powered instruments and cannulated implants,
coupled with the use of radiographic real time images, has greatly
facilitated the accuracy of applying fixation devices with percutaneous
techniques.
fixation devices often need to be used for only a short time. Children
tolerate all types of casts well for short periods of time, which
allows a minimally stabilized fracture to be immobilized with a cast
until there is sufficient internal callous to supplement the limited
internal fixation.
to mobilize children to an outpatient setting as soon as possible. This
is reinforced by the fact that in two thirds of the families in the
United States, both parents are wage earners. There are both social and
financial pressures to mobilize the child early. The trend now is to
surgically stabilize these fractures so that the patient can be
discharged early. The shift away from traction and toward IM fixation
for femoral fractures in intermediate aged children is but one example
of this dynamic at work.
often expect a perfect outcome for their child. They inspect the
radiographs, question the alignment, and expect the alignment to be
perfect. These pressures often direct the treating physician toward
operative intervention to obtain a perfect alignment.
such as Supracondylar Humeral Fractures. The superiority of operative
treatment of supracondylar fractures of the distal humerus was clearly
demonstrated in a report published in 1988 from Toronto, Canada, in
which treatment in traction, treatment with a cast alone, and treatment
with percutaneous pin fixation were compared.92
The worst results were in patients treated with only a cast. The best
results were achieved in those stabilized with percutaneous pin
fixation. The universal acceptance of percutaneous pin fixation of
these fractures is evidence of the superiority of operative management.
their hospital in Southampton, England, found a high incidence of
secondary hospital treatment for fractures initially managed
nonoperatively.28 There was a 12%
readmission rate to correct late displacement of fractures of the
radius and distal humerus. In addition, 24% of their internal fixation
procedures were to salvage unacceptable results of nonoperative
management. They concluded that more selective initial operative
intervention in radial and distal humeral fractures could decrease the
incidence of costly readmissions to the hospital.
with a midshaft fracture of the femur may have had the same excellent
bony alignment and healing when treated with 6 weeks of skeletal
traction as when treated with IM fixation. However, quality of life
during treatment, burden of care on the family, and costs are markedly
different in these two scenarios.
of iatrogenic problems that result in less favorable outcomes for some
children. Some of the specific problems that have occurred over the
years are: (i) ulnar nerve injury with medial pin fixation of
supracondylar fractures,67 (ii) high refracture rate with external fixation of femoral shaft fractures,94 and (iii) osteonecrosis of the femoral head following the use of interlocking IM nails inserted through the piriformis fossa.9,77
is an initial wave of enthusiasm. However, with more widespread use,
problems become more apparent and modifications are made to the
original technique. Thus, it takes time before the technique becomes
relatively complication free.
most children’s fractures can be managed by nonoperative techniques has
become obscured. As a result, many recent orthopaedic trainees are less
exposed to and less comfortable with nonoperative technical skills.
results of treating children’s fractures by focusing on improvements in
nonoperative methods, “pleading for conservatism.”47 Chess et al.23 showed that when properly applied, a well-molded short-arm
cast provides just as good a result as a long-arm cast in treating
displaced fractures of the distal radial metaphysis. These authors
believed the key to success in using a short-arm cast is in a careful
molding of the cast at the fracture site so there is the proper cast
index of 0.7 or less. Walker and Rang challenged traditional thinking
by demonstrating that unstable fractures of the radius and ulna could
be treated with a lower frequency of remanipulation if immobilized in
elbow extension rather than flexion.127
of pediatric fractures, there are still significant gaps in our
knowledge base, and there is much work to be done. There are several
challenges to gathering appropriate data in this area: risk factors for
pediatric injury are diverse and heterogenous, practice patterns vary
across countries and even within countries, and the available
infrastructure to support data collection for pediatric trauma is far
from ideal.
cultural settings. For instance, Cheng and Shen studied children in
Hong Kong who lived in confined high-rise apartments.22
Their risk of exposure to injury differed from the study by Reed of
children living in the rural environment of Winnipeg, Canada.97 Two separate reviews by Laffoy55 and Westfelt86
found that children in a poor social environment (as defined by a lower
social class or by dependence on public assistance) had more frequent
accidents than more affluent children. In England, children from
single-parent families were found to have higher accident and infection
rates than children from two parent families.36
the relationship of affluence to the incidence of fractures in
children. Lyons et al.68 found no
difference in the fracture rates of children in affluent population
groups compared to those of children in nonaffluent families. On the
other hand, Stark et al.119 in
Scotland found that the fracture rates in children from nonaffluent
social groups was significantly higher than those in affluent families.
colder climates, with ice and snow, are exposed to risks different from
those of children living in warmer climates. The exposure time to
outdoor activities may be greater for children who live in warmer
climates. For example, the incidence of chronic overuse elbow injuries
in young baseball players (Little League elbow) is far greater in the
southern United States than in the northern part of the country.
there are direct and predictable relationships between exposure and
incidence.
information about how we define and classify a given disease state.
This is a challenge in pediatric trauma, making it difficult to compare
studies. Some studies extend the pediatric age group to only 16 years,
for example, while others include patients up to 21 years of age.
Moreover, it is particularly difficult to examine injuries that only
sometimes result in admission. Many studies17,66,110
are limited to injuries that require hospital admission, despite the
fact that most injuries in children do not. Reports vary in the
precision of their defined types of fracture patterns. In the older
series, reports were only of the long bone involved, such as the
radius. Series that are more recent have emphasized a more specific
location, separating the radius, for example, into physeal, distal,
shaft, and proximal fracture types.
pediatric fractures, it is difficult to compare series because of
cultural, environmental, and age differences. In the following
synopsis, these differences were considered in grouping the results and
producing average figures. These data are presented in an attempt to
provide a reasonable and accurate reflection of the overall incidence
of injuries and fractures in all children.
regional data have recently become available providing significantly
improved investigation into various areas within pediatric trauma. The
Healthcare Cost and Utilization Project (HCUP) is a family of databases
including the State Inpatient Databases (SID), the Nationwide Inpatient
Sample (NIS), and the Kids’ Inpatient Database (KID). While
administrative data may lack clinical detail for certain purposes,
these datasets provide a comprehensive overview of healthcare
utilization in the United States and are available without purchase
(http://www.ahrq.gov/data/hcup/hcupnet.htm).120
The KID database has been increasingly used to examine the incidence of
pediatric trauma as well as practice patterns in pediatric trauma. Data
for KIDS are collected and published every 3 years, with data currently
available for 1997, 2000, 2003, and 2006. KIDS is “nationally
representatative,” meaning that the database contains a large but
incomplete sample of the hospital discharge records (3.1 million in
2006), which are then statisticaly weighted upward to reflect the
complete population of pediatric discharges (7.6 million in 2006).
Several other databases including the National Electronic Injury
Surveillance System (http://www.cpsc.gov/library/neiss.html) have also
been useful in providing information about the epidemiology of
pediatric trauma.
detail, limiting broader utility as a source of health outcomes data in
the field. Constructed in an attempt to fill such a role, the National
Pediatric Trauma Registry (NPTR) is a multi-institutional database
designed to provide a snapshot of physiological and clinical
information. The NPTR was functional for about 15 years and provided a
source of important data in the realm of pediatric trauma.122
The NPTR is currently being redesigned into an even more powerful
database that will be called the National Trauma Registry for Children,
which should serve as a powerful reference for contributors to future
editions of this book.
fracture healing in children. In 1941, Beekman and Sullivan published
an extensive review of the incidence of children’s fractures.11
Their pioneering work—still quoted today—included a study of 2094 long
bone fractures seen over a 10-year period at Bellevue Hospital in New
York City. The major purpose of their study was to develop basic
principles for treating children’s fractures.
confirmed the findings of the previous studies with regard to the
general incidence of children’s long bone fractures and their ability
to heal and readily remodel. These initial reviews were mainly
statistical analyses and did not delve deeply into the true
epidemiology of children’s fractures. In 1965, Wong explored the effect
of cultural factors on the incidence of fractures by comparing Indian,
Malay, and Swedish children.133 In the 1970s, two other studies, one by Iqbal44 and another by Reed,97 added more statistics regarding the incidence of the various long bone fractures.
He reviewed the data on all fractures in children that occurred in
Malmo, Sweden, over 30 years and examined the factors affecting the
incidence of children’s fractures. By studying two populations, 30
years apart, he determined that fracture patterns were changing and
suggested reasons for such changes. His initial goal was to establish
data for preventive programs, so he focused on fractures that produced
clean, concise, concrete data.
He suggested that the twofold increase in fracture rate during the 30
years from 1950 to 1979 in Malmo was due mainly to an increased
participation in sports. In 1999, in cooperation with Tiderius and
Duppe, Landin123 studied the
incidence in the same age group again in Malmo and found that the rate
had actually declined by 9% in 1993 and 1994. The only exception was an
increase of distal forearm fractures in girls, which he attributed to
their increased participation in sporting events.
their 1993 study from Hong Kong, also set out to define children’s
fractures by separating the incidences into age groups. They tried to
gather epidemiologic data on which to build preventive programs. In
1999, this study was expanded to include almost 6500 fractures in
children 16 and younger over a 10-year period.21
The fracture patterns changed little over those 10 years. What did
change was the increased frequency of closed reduction and percutaneous
pin fixation of fractures, with a corresponding decrease in open
reductions. There also was a marked decrease in the hospital stay of
their patients.
examined the face of pediatric inpatient trauma in 1997. They estimated
that roughly 84,000 children were admitted for fracture care which
resulted in about 1 billion dollars in hospital charges. Of some
interest, more than 70% of children were treated at non-children’s
hospitals.
child sustaining a fracture during childhood (birth to age 16) was 42%
for boys and 27% for girls.58 When
considered on an annual basis, 2.1% of all the children (2.6% for boys;
1.7% for girls) sustained at least one fracture each year. These
figures were for all fracture types and included those treated on an
inpatient basis and an outpatient basis. The overall chance of fracture
per year was 1.6% for both girls and boys in a study from England of
both outpatients and inpatients by Worlock and Stower.134
The chance of a child sustaining a fracture severe enough to require
inpatient treatment during the first 16 years of life is 6.8%.22
Thus, on an annual basis, 0.43% of the children in an average community
will be admitted for a fracture-related problem during the year.
there was an almost 10% decrease in the incidence of fractures in the
0- to 16-year age group. They attributed this to less physical activity
on the part of modern-day children coupled with better protective
sports equipment and increased traffic safety (e.g., stronger cars and
use of auto restraint systems). The overall incidence of children’s
fractures is summarized in Table 1-1.
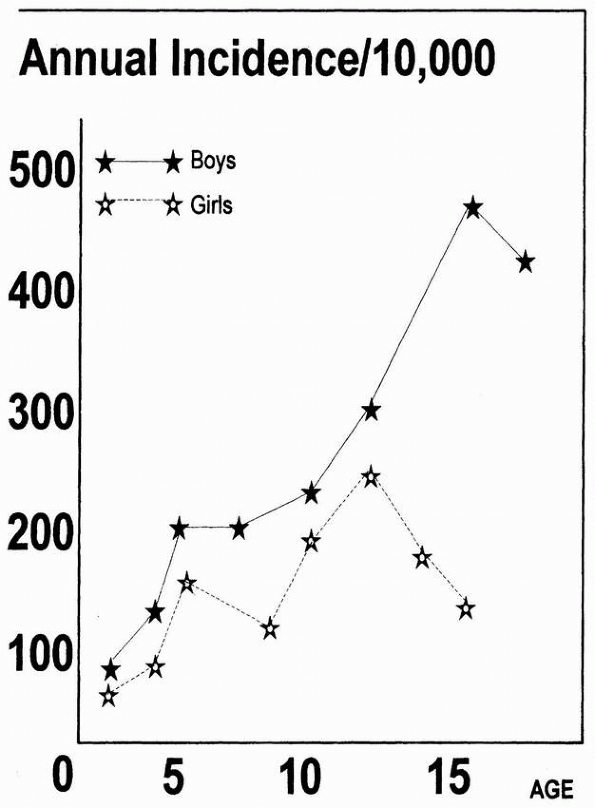
birth and extending to age 12, all the major series that segregated
patients by age have demonstrated a linear increase in the annual
incidence of fractures with age (Fig. 1-1).16,21,22,44,58,134
Most injuries in children of this age are nonorthopaedic entities such
as head injuries, lacerations, and abrasions. In fact, the incidence of
lacerations in both sexes peaks at this age.99
called attention to the frequency of fractures and other injuries in
young children that were due to nonaccidental trauma. They termed these
injuries part of the
battered child syndrome. Arkbania et al.2
later defined the specific fracture patterns seen in victims of child
abuse. The high rate of fractures from nonaccidental trauma has been
shown to extend to age 3.52
|
TABLE 1-1 Overall Frequency of Fractures*
|
||||
|---|---|---|---|---|
|
 |
|
FIGURE 1-1
Incidence of fractures by age. Boys peak at 15 years while girls peak earlier, at 12 years, and then decline. (Reprinted from Landin LA. Fracture patterns in children. Acta Orthop Scand 1983;202:13; with permission.) |
attributed to abuse. In a review of fractures occurring in the first
year of life, McClelland and Heiple found that fully 44% were from
documented accidental and nonabusive etiologies.74
They also noted that 23% of these patients had generalized conditions
that predisposed them to fractures. Thus, although nonaccidental trauma
remains the leading cause of fractures during the first year of life,
other general and metabolic conditions may predispose children to
fractures from accidental causes.
about half of abused hospitalized children older than 3 years of age
have concomitant psychiatric or neurological conditions, reminding
caretakers to maintain vigilance in this at risk population.65
For example, a nonambulatory child with cerebral palsy is expected to
have osteopenia and be at increasd risk for fracture. The orthopaedic
surgeon should not fall into the trap, however, of assuming that all
fractures in children with cerebral palsy are accidents, because
children with cerebral palsy also are at an increased risk of child
abuse.
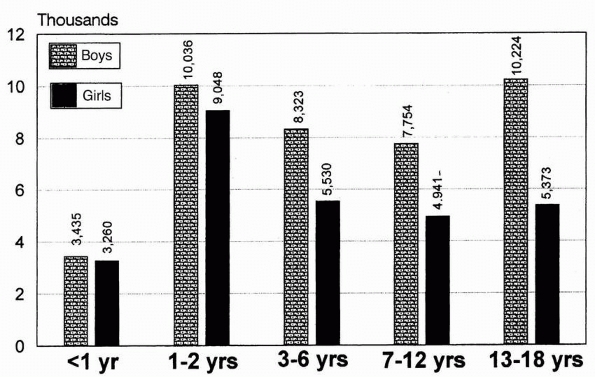
the male incidence in the 12- to 16-year age group was 83%. The
incidence of fractures in girls steadily declined from their peak in
the birth to 3-year age group.
 |
|
FIGURE 1-2
Injuries per 100,000 children per year. Estimated US injury rates in children by age and sex, 1978. (Reprinted from Rivara FP, Bergman AB, LoGerfo JP, et al. Epidemiology of childhood injuries. Am J Dis Child 1982;136:503; with permission.) |
incidence of fractures between boys and girls. For example, during the
first 2 years of life, the overall incidence of injuries and fractures
in both genders is nearly equal. During these first 2 years, the injury
rates for foreign body ingestion, poisons, and burns have no
significant gender differences. With activities in which there is a
male difference in participation, such as with sports equipment and
bicycles, there is a marked increase in the incidence of injuries in
boys.21,99
the rate of exposure alone; behavior may be a major factor. For
example, one study found that the incidence of auto/pedestrian
childhood injuries peaks in both sexes at ages 5 to 8.104
When the total number of street crossings per day was studied, both
sexes did so equally. Despite this equal exposure, boys had a higher
number of injuries. Thus, the difference in the rate between the sexes
begins to develop a male predominance when behaviors change. The
difference in the injury rate between the genders may change in the
future as more girls participate in activities with increased physical
risk.21,99
The ratio of left to right overall averages 1.3:1. In some fractures,
however, especially those of supracondylar bones, lateral condyles, and
the distal radius, the incidence is far greater, increasing to as much
as 2.3:1 for the lateral condyle. In the lower extremity, the incidence
of injury on the right side is slightly increased.41,58
speculated that the right upper extremity is often being used actively
during the injury, so the left assumes the role of protection. In a
study examining the left-sided predominance in the upper extremity,
Mortensson and Thonell80 questioned
patients and their parents on arrival to the emergency department about
which arm was used for protection and the position of the fractured
extremity at the time of the accident. They
found
two trends: regardless of handedness, the left arm was used more often
to break the fall, and when exposed to trauma, the left arm was more
likely to be fractured.
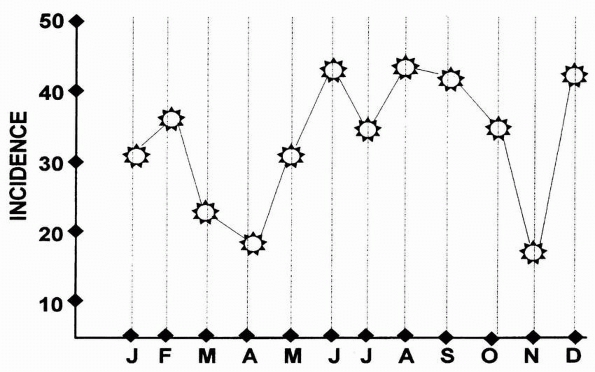
the summer, when children are out of school and exposed to more
vigorous physical activities (Fig. 1-3). Five studies from the northern hemisphere have confirmed this summertime increase.21,22,102,129,134
in a study from Ireland, found a strong positive correlation between
monthly sunshine hours and monthly fracture admissions. There was also
a weak negative correlation with monthly rainfall. Overall, the average
number of fractures in the summer was 2.5 times that in the winter. In
days with more sunshine hours than average, the average fracture
admission rate was 2.31 per day; on days with fewer sunshine hours than
average, the admission rate was 1.07 per day.
a bimodal pattern that seemed to be influenced by cultural traditions.
In two large series of both accidents and fractures in Sweden by
Westfelt86 and Landin,58
the researchers noticed increases in May and September and significant
decreases in June, July, and August. Both writers attributed this to
the fact that children in their region left the cities to spend the
summer in the countryside. Thus, the decrease in the overall fracture
rate was probably due to a decrease in the number of children at risk
remaining in the city.
speculated that because the rate of growth increases during the summer,
the number of physeal fractures should also increase, as the physes
would be weaker during this time. For example, the incidence of slipped
capital femoral epiphysis, which is related to physeal weakness,
increases during the summer.7
However, Landin, in his study of more than 8000 fractures of all types,
found the overall seasonal incidence of physeal injuries to be exactly
the same as nonphyseal injuries.58
 |
|
FIGURE 1-3
Distribution of children’s fractures on a monthly basis. Note the general increase from May to October. (Reprinted from Reed MH. Fractures and dislocations of the extremities in children. J Trauma 1977; 17:353; with permission.) |
climate, especially in areas where there are definite seasonal
variations, influences the incidence of fractures in all children,
especially in older children. However, in small children and infants,
whose activities are not seasonally dependent, there appears to be no
significant seasonal influence.
to correlate with the peak time for fracture occurrence. In Sweden, the
incidence peaked between 2 and 3 PM.86
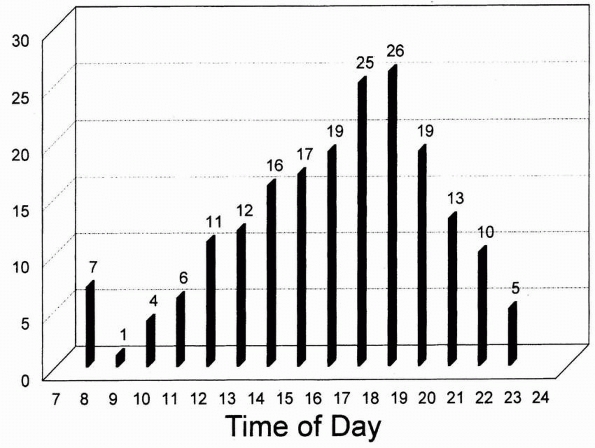
In a well-documented study from Texas by Shank et al.,110 the hourly
incidence of fractures formed a well-defined bell curve peaking at
about 6 PM (Fig. 1-4).
that has compared the changes over a significant time span: his data
were collected over 30 years.58 He
classified the degree of trauma as slight, moderate, or severe. The
incidence of all trauma in both boys and girls increased significantly
over the 30-year study period, but the incidence of severe trauma
increased only slightly. The greatest increase was in the “slight”
category. Landin attributed the increase in this category to the
introduction of subsidized medical care. Because expense was not a
factor, parents were more inclined in the later years of the study to
seek medical attention for relatively minor complaints. Physicians,
likewise, were more inclined to order radiographs. Thus, many of the
minor injuries, such as torus fractures, which were often ignored in
the earlier years, were seen more often at medical facilities during
the later years.
over this period was that of the femoral shaft. This increase was
thought to be influenced by new types of play activities and increased
participation in sports.
 |
|
FIGURE 1-4
Incidence of children’s fractures per time of day. There is an almost bell-shaped curve with a peak at around 6 PM. (Reprinted from Shank LP, Bagg RJ, Wagnon J. Etiology of pediatric fractures: the fatigue factors in children’s fractures. Presented at the National Conference on Pediatric Trauma, Indianapolis, 1992; with permission.) |
nonaccidental causes (child abuse) has risen consistently in the past
decades. In the study of fractures in children ages birth to 3 years
old by Kowal-Vern et al.,52 the
number of fractures due to abuse increased almost 150 times from 1984
to 1989. This increase was attributed to a combination of improved
recognition, better social resources, and a true increase in the number
of cases of child abuse.
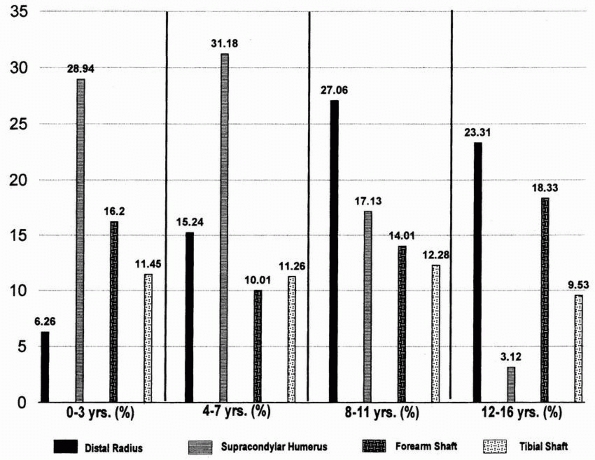
same in the major series, but these rates change with age. For example,
supracondylar fractures of the humerus are most common in the first
decade, with a peak at age 7. Fractures of the femur are most common in
children ages 0 to 3. Fractures of the physis are more common just
before skeletal maturity. This variation is best illustrated in Cheng
and Shen’s data (Fig. 1-5).22
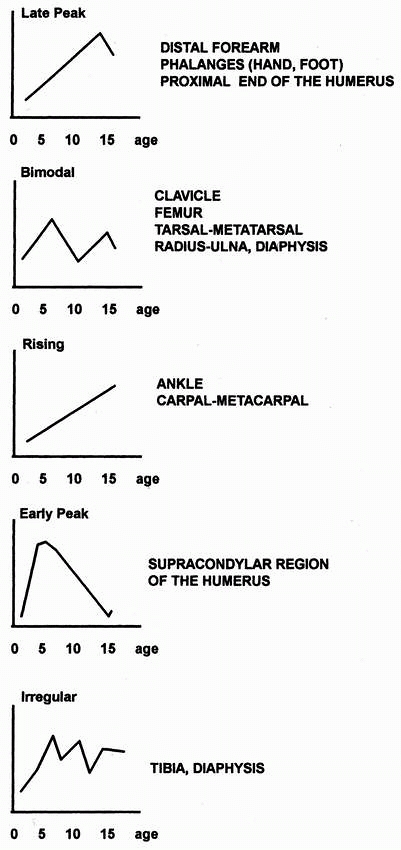
When he compared these variability patterns with the common etiologies,
he found some correlation. For example, late-peak fractures (distal
forearm, phalanges, proximal humerus) were closely correlated with
sports and equipment etiologies. Bimodal pattern fractures (clavicle,
femur, radus and ulna, diaphyses) showed an early increase from lower
energy trauma, then a late peak in incidence due to injury from high-
or moderate-energy trauma. Early peak fractures (supracondylar humeral
fractures are a classic example) were due mainly to falls from high
levels.
play activity in the home environment increases with age. Only 15%
occur in toddlers, but 56% occur during older years.134
fractured together, and fractures were reported only as to the long
bone involved (e.g., radius, humerus, femur).11,41,44,62,66
More recent reports have split fractures into the more specific areas
of the long bone involved (e.g., the distal radius, the radial neck,
the supracondylar area of the humerus).22,44,58,97,134
 |
|
FIGURE 1-5
The frequency of occurrence of the most common fracture areas in children. The frequency of each fracture pattern differs with the various age groups. The figures express the percentage of total fractures for that age group and represent boys and girls combined. (Reprinted from Cheng JC, Shen WY. Limb fracture pattern in different pediatric age groups: a study of 3350 children. J Orthop Trauma 1993;7:17; with permission.) |
Overall, the radius is the most commonly fractured long bone, followed
by the humerus. In the lower extremity, the tibia is more commonly
fractured than the femur (Table 1-2).
somewhat differently, it is somewhat of a challenge to distill detailed
and accurate prevalence data for specific fractures In trying do so, we
have identified areas common to a number of recent reports,22,44,58,97,134
but have taken some liberties in doing so. For example, distal radial
metaphyseal and physeal fractures were combined as the distal radial
fractures. Likewise, the carpals, metacarpals, and phalanges were
combined to form the region of the hand and wrist. All the fractures
around the elbow, from those of the radial neck to supracondylar
fractures, were grouped as elbow fractures. This grouping allows
comparison of the regional incidence of specific fracture types in
children (Table 1-3).
fractured was the distal radius. The next most common area, however,
varied from the hand in Landin’s series58 to the elbow (mainly supracondylar fractures) in Cheng and Shen’s series.21,22
producing an average overall incidence of 21.7% for physeal fractures (Table 1-4).
 |
|
FIGURE 1-6
Patterns of fracture: variations with age. The peak ages for the various fracture types occur in one of five patterns. (Reprinted from Landin LA. Fracture patterns in children. Acta Orthop Scand 1983;202: 73; with permission.) |
|
TABLE 1-2 Incidence of Fractures in Long Bones*
|
||||||||||||||
|---|---|---|---|---|---|---|---|---|---|---|---|---|---|---|
|
||||||||||||||
|
TABLE 1-3 Incidence of Specific Fracture Types*
|
||||||||||||||||||||||||||
|---|---|---|---|---|---|---|---|---|---|---|---|---|---|---|---|---|---|---|---|---|---|---|---|---|---|---|
|
||||||||||||||||||||||||||
consistent. The data were combined from the four reports in which the
incidence of open fractures was reported.22,41,72,134
The incidence in these reports varied from 1.5% to 2.6%. Combined,
these reports represented a total of 8367 fractures with 246 open
fractures, resulting in an average incidence of 2.9% (Table 1-5).
more severe trauma, so there may be a higher incidence of open
fractures in these patients. The incidence of open fractures was 9% in
a report of patients admitted to the trauma center of the Children’s
National Medical Center, Washington, DC.17
incidence ranges in the various series from 1.7% to as much as 9.7%. In
four major reports totaling 5262 patients, 192 patients had more than
one fracture (Table 1-6).22,41,44,134 The incidence in these multiple series was 3.6%.
dysplasias and metabolic diseases that produce osteopenia (such as
osteogenesis imperfecta) are expected to have recurrent fractures.
In
these patients, the etiology is understandable and predictable.
However, some children with normal osseous structures are prone to
recurrent fractures for reasons that remain unclear. The incidence of
recurrent fractures in children is about 1%.32
|
TABLE 1-4 Incidence of Physeal Fractures*
|
||||
|---|---|---|---|---|
|
|
TABLE 1-5 Incidence of Open Fractures*
|
||||
|---|---|---|---|---|
|
found that children who sustained fractures with relatively little
trauma had a lower mineral content in their forearms, but they could
not correlate this finding with subsequent fractures. Thus, in children
who seem to be structurally normal, there does not appear to be a
physical reason for their recurrent fractures.
shifts the focus to a psychological or social cause. The one common
factor in accident repeaters has been a high incidence of dysfunctional
families.46 In Sweden, Westfelt
found that children who were accident repeaters came from “socially
handicapped” families (i.e., those on public assistance or those with a
caregiver who was an alcoholic).86
Thus, repeat fractures are probably due more to behavioral or social
causes than physical causes. Landin, in his follow-up article,57
followed children with repeat fractures (four or more) into adolescence
and adulthood. He found these children had a significantly increased
incidence of convictions for serious criminal offenses when compared
with children with only one lifetime fracture.
important to focus on the etiology of fractures and the settings in
which they occur. Fractures do not occur in a vacuum, and
wellresearched studies that analyze the physical and social environment
in which they occur are extremely valuable. Efforts can be made toward
creating a safer environment for play and recreation. Studies that
identify risky patterns of use or unsafe playground behavior can
significantly influence preventive health measures. Recommendations can
be made to manufacturers regarding modification of a product, and
education can be imparted to parents, school authorities, healthcare
professionals, physical trainers, and children.
|
TABLE 1-6 Incidence of Multiple Fractures*
|
||||
|---|---|---|---|---|
|
accidental trauma, (ii) nonaccidental trauma (child abuse), and (iii)
pathologic conditions. Accidental trauma forms the largest etiologic
group. Nonaccidental trauma and fractures resulting from pathologic
conditions are discussed in later chapters of this book.
some often overlapping others. However, for purposes of simplicity,
fractures can be considered to occur in the following five
environments: (i) home environment, (ii) school environment, (iii) play
and recreational activities, (iv) motor vehicle and road accidents, and
(v) uncommon situations involving such causes as ice cream trucks,
water tubing, and gunshot and missile injuries.
as those that occur in the house and surrounding vicinity. These
generally occur in a fairly supervised environment and are mainly due
to falls from furniture, stairs, fences, and trees.
simple fall while running to a fall of great magnitude, such as from a
third story window. In falling from heights, adults often land on their
lower extremities, accounting for the high number of lower extremity
fractures, especially the calcaneus. Children tend to fall head first,
using the upper extremities to break the fall. This accounts for the
larger number of skull and radial fractures in children. Femoral
fractures also are common in children falling from great heights. In
contrast to adults, spinal fractures are rare in children who fall from
great heights.8,76,114,117
In one study, children falling three stories or less all survived.
Falls from the fifth or sixth floor resulted in a 50% mortality rate.8
showed that an increased incidence of fractures in a home environment
did not necessarily correlate with the physical attributes or poor
safety precautions of the house. Rather, it appears that a disruption
of the family structure and presence of social handicaps (alcoholism,
welfare recipients, etc.) is an important risk factor for pediatric
fracture.
safe, and the overall annual rate of injury (total percentage of
children injured in a single year) in the school environment ranges
from 2.8% to 9.2%.15,60,86,112
True rates may be higher because of inaccurate reporting, especially of
mild injuries. In one series, the official rate was 5.6%, but when the
parents were closely questioned, the incidence of unreported, trivial
injuries was as much as 15%.34 The
annual fracture rate of school injuries is low. Of all injuries
sustained by children at school in a year, only 5% to 10% involved
fractures.34,60,112 In Worlock and
Stower’s series of children’s fractures from England,134 only 20% occurred at school. Most injuries (53%) occurring in school are related to athletics and sporting events,60
and injuries are highest in the middle-school children. The peak time
of day for injuries at school is in the morning, which differs from the
injury patterns of children in general.60
child’s life. It enhances physical development and fosters social
interaction. Unfortunately, unsupervised or careless use of some play
equipment can endanger life and limb. When Mott et al.81
studied the incidence and pattern of injuries to children using public
playgrounds, they found that approximately 1% of children using
playgrounds sustained injuries. Swings, climbers, and slides are the
pieces of playground equipment associated with 88% of the playground
injuries.69
found that most injuries occurred in boys (56%) with a peak incidence
in the summer months. Fractures accounted for 61% of these injuries,
90% of which involved the upper extremity and were sustained in falls
from playground equipment such as monkey bars and climbing frames.
Younger children (1 to 4 years old) were more likely to sustain
fractures than older children.
in which upper extremity injuries, especially fractures, accounted for
most of hospitalizations resulting from injuries on playground
equipment. Older children sustained more injuries on climbing
apparatus, whereas younger children sustained more injuries on slides.
utlilized the National Electronic Injury Surveillance System (NEISS)
dataset to explore the demographics of playground equipment injuries in
children. Monkey bars were the most common cause of fractures. In
another study looking specifically at injuries from monkey bars, the
peak age group was the 5- to 12-year-old group, with supracondylar
humeral fractures being the most common fracture sustained.70
Changing playground surfaces from concrete to more impact-absorbing
surfaces such as bark reduced the incidence and severity of head injury
but increased the tendency for long bone fractures (40%), bruises, and
sprains. Chalmers et al.19 determined that the height of the equipment was just as great a risk factor as the surface composition.
injuries than private playgrounds because they usually have harder
surfaces and higher pieces of equipment,90 although playground injury was most likely to occur at school compared to home, public, and other locations.91
studied the profile of pediatric bicycle injuries in a sample of 211
children who were treated for bicycle-related injury at their trauma
center over a 4-year period. They found that bicycle injuries accounted
for 18% of all pediatric trauma patients. Bicycle/motor vehicle
collisions caused 86% of injuries. Sixty-seven percent had head
injuries and 29% sustained fractures. More than half of the incidents
occurred on the weekend. Sixteen percent were injured by ejection from
a bicycle after losing control, hitting a pothole, or colliding with a
fixed object or another bicycle. Fractures mainly involved the lower
extremity, upper extremity, skull, ribs, and pelvis in decreasing order
of incidence.
that the use of safety helmets was disturbingly low (<2%). Other
studies confirm the observation that fewer than 13% to 15% of children
wear helmets while riding bicycles.35,101 The Year 2000 Health Objectives called for helmet use by 50% of bicyclists.95 Even as recently as 2003, the use of bicycle helmets was still below 20%.42
Research has shown that legislation, combined with education and helmet
subsidies, is the most effective strategy to increase use of safety
helmets in child bicyclists.18 As
public awareness of both the severity and preventability of
bicycle-related injuries grows, the goal of safer bicycling practices
and lower injury rates can be achieved.96
bars also are responsible for many fractures and soft tissue injuries
in children. D’Souza et al.29 and Segers et al.109
found that bicycle spoke injuries are typically sustained when the
child’s foot is caught in the spokes of the rotating wheel. Of 130
children with bicycle spoke injuries, 29 children sustained fractures
of the tibia, fibula, or foot bone. Several had lacerations and soft
tissue defects. D’Souza et al.29
suggested that a mesh cover to prevent the toes from entering between
the spokes and a plastic shield to bridge the gap between the fork and
horizontal upright could substantially decrease the incidence of these
injuries.
experienced a renewed surge in popularity over the past three decades.
With the increasing number of participants, high-tech equipment
development, and vigorous advertising, skateboard and skating injuries
are expected to increase. There was an initial increase in the early
1980s, with a decrease after 1993. Since 1998, there has been an
increase in the number of skateboard injuries.75
Because the nature of skateboarding encompasses both high speed and
extreme maneuvers, high-energy fractures and other injuries can occur,
as highlighted by several studies.37,88,93
Studies have shown that skateboarding-related injuries are more severe
and have more serious consequences than roller-skating or in-line
skating injuries.88 In a study of skateboarding injuries, Fountain et al.37
found that fractures of the upper or lower extremity accounted for 50%
of all skateboarding injuries. Interestingly, more than one third of
those injured sustained injuries within the first week of
skateboarding. Most injuries occurred in preadolescent boys (75%) 10 to
16 years of age; 65% sustained injuries on public roads, footpaths, and
parking lots. Several reports37,108
have recommended safety guidelines and precautions such as use of
helmets, knee and elbow pads, and wrist guards, but such regulations
seldom are enforced.
that in a group of 1036 skaters, 60% had sustained injuries. Eight
percent of these were fractures, mostly involving the elbow, forearm,
wrist, and fingers (78%). Fewer than 20% used protective devices, and
most lacked knowledge of the basic techniques of skating, braking, and
falling. In a larger study of 60,730 skating injuries in children,
Powell and Tanz93
found that 68% of the children were preadolescent boys with a mean age
of 11.8 years. Fractures were the most common injury (65%) and two
thirds of these involved the distal forearm. Two and a half percent
required hospital admissions; 90% of these admissions were for a
fracture. Similarly, Mitts and Hennrikus78
found that 75% of in-line skating fractures in children occurred in the
distal forearm as a result of falls on the out-stretched hand. One in
eight children sustained a fracture during the first attempt at the
sport. The orthopaedic community has an obligation to educate the
public on the need for wearing wrist guards when using in-line skates
or roller skates.
thought that formal skate parks could decrease the injury rate.
However, a study by Sheehan et al.111
demonstrated that dedicated skate parks led to an increase in pediatric
fractures referred to the hospital. The authors suggested that there
should be closer supervision and training of children and more emphasis
on limb protective gear.
injuries related to nonmotorized scooters (kickboards) has been
observed among children. Most of the scooter-related accidents were
caused by the wheels of the scooter getting caught by uneven ground,
whereas most skateboard accidents occurred during attempted trick
maneuvers. Protective gear was seldom used.20,71,105 Scooters seem to have a high incidence of collisions with motor vehicles.71 The recent motorizing of the scooters will only increase the severity of the injuries sustained.
increasing popularity in the 1990s and are a significant cause of
morbidity in children. Several studies have noted a dramatic increase
in the number of pediatric trampoline injuries during the past 10
years, rightfully deeming it as a “national epidemic.”39,115
in a retrospective study over a 7-year period, found that the annual
number of pediatric tramopoline injuries tripled between 1990 and 1997.
In contrast to other recreational activities in which boys constitute
the population at risk, patients with pediatric tramopoline injuries
were predominantly girls, with a median age of 7 years. Nearly a third
of the injuries resulted from falling off the trampoline. Fractures of
the upper and lower extremities occurred in 45% and were more
frequently associated with falls off the trampoline. In another
excellent study on pediatric tramopoline injuries, Smith115
found that there was virtually a 100% increase in injuries from 1990 to
1995, with an average of more than 60,000 injuries per year. Younger
children had a higher incidence of upper extremity fractures and other
injuries. In a later study, Smith and Shields116
reported that fractures, especially involving the upper extremity,
accounted for 35% of all injuries. Interestingly, more than 50% of the
injuries occurred under direct adult supervision. More disturbingly,
73% of the parents were aware of the potential dangers of trampolines,
and 96% of the injuries occurred in the home backyard. These
researchers, along with others,39
rightly concluded that use of warning labels, public education, and
even direct adult supervision were inadequate in preventing these
injuries and have called for a total ban on the recreational, school,
and competitive use of trampolines by children.115,116
found more than 90% of injured children were boys 5 to 18 years of age.
Sixty percent of the accidents occurred in collisions with stationary
objects such as trees, poles, and stakes. Most injuries occurred in the
afternoon, among beginners, and in the first week of skiing season.
Fractures accounted for one third of the total injuries sustained. The
two main factors implicated in skiing injuries are excessive speed and
loss of control; effective prevention efforts should target both of
these factors.
found that approximately 60% of snowboarding injuries involved the
lower limbs and occurred in novices. The most common injuries were
sprains (53%) and fractures (26%). Compared with skiers, snowboarders
had 2½ times as many fractures, particularly to the upper limb, as well
as more ankle injuries and higher rates of head injury. The absence of
ski poles and the fixed position of the feet on the snowboard mean that
the upper limbs absorb the full impact of any fall. Wrist braces can
decrease the incidence of wrist injuries in snowboarding.103
Of some concern, a recent study has shown that rates of snowboard
injuries seem to be rising, while rates of ski injuries have been flat.43
vehicle accidents differ from those of adults. In all types of motor
vehicle accidents for all ages, children constitute a little over 10%
of the total number of patients injured.58,105
Of all the persons injured as motor vehicle occupants, only about 17%
to 18% are children. Of the victims of vehicle-versus-pedestrian
accidents, about 29% are children. Of the total number of children
involved in motor vehicle accidents, 56.4% were vehicle-pedestrian
accidents, and 19.6% were vehicle-bicycle accidents.31
is less than that of adults. Of the total number of vehicle-pedestrian
accidents, about 22% of the children sustained fractures; 40% of the
adults sustained fractures in the same type of accident. This has been
attributed to the fact that children are more likely to “bounce” when
hit.31
femoral fracture when struck by an automobile; in adults, tibial and
knee injuries are more common in the same type of accident. This seems
to be related to where the car’s bumper strikes the victim.17,124 Motor vehicle accidents do produce a high proportion of spinal and pelvic injuries.17
a new cause of serious pediatric injury. Using the KID dataset,
Killingsworth et al.50 showed that 5292 children were admitted to a hospital in 1997 and 2000 (the two years for which KID
data was available) resulting in 74 million dollars in hospital
charges, with rates of hospitalization increasing 80% between these 2
years. In fact, using the Oregon state database, Mullins et al.85
showed that the number of patients who sought tertiary care for severe
injuries caused by off-road vehicles doubled over a period of 4 years.
In contrast to other etiologies of injury, children who sustained
ATV-related fractures had more severe injuries and a higher percentage
of significant head trauma, with 1% of these injuries resulting in
in-hospital death. These statisitics point to the failure of voluntary
safety efforts to date and argue for much stronger regulatory control.
injuries in children younger than 16 years requiring emergency room
treatment rose from 146,000 in 2006 to 150,900 in 2007. In their
11-year review of ATV injuries treated at al level 1 pediatric trauma
center, Kute et al.53 determined
that ATV accident-related admissions increased almost five times and
overall fracture number increased four times over the study period; 63%
of the 238 patients sustatined at least one fracture.
noted age-related patterns of injury. Younger children (≤12 years) were
more likely to sustain an isolated fracture and were more likely to
sustain a lower extremity fracture, specifically a femoral fracture,
than older children. Older children were more likely to sustain a
pelvic fracture. Kirkpatrick et al.51
expressed concern about the frequency and severity of fractures about
the elbow in their 73 patients injured in ATV accidents between 2001
and 2007: all six open fractures involving the upper extremity involved
the elbow.
increasingly common in children in the United States.130
In a sad reflection of the changing times and the newly pervasive gun
culture, firearms are determined to be second only to motor vehicles as
the leading cause of death in youths. In considering the prevalence of
firearms in the United States, it has been estimated that there are
about 200 million privately owned guns in the United States and that
approximately 40% of US households contain firearms of some type.26
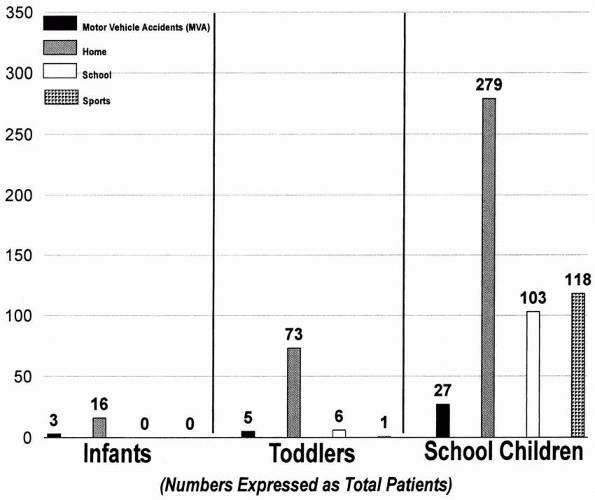 |
|
FIGURE 1-7
The incidence of fractures in children expressed as the four common etiologic categories. Most fractures occur at home. The numbers are expressed as total patients per each age category. (Reprinted from Worlock P, Stower M. Fracture patterns in Nottingham children. J Pediatr Orthop 1986;6:656; with permission.) |
|
TABLE 1-7 Summary of Etiologic Factors in Children’s Fractures
|
||||||||||||||||||||||||||||||||||||||||
|---|---|---|---|---|---|---|---|---|---|---|---|---|---|---|---|---|---|---|---|---|---|---|---|---|---|---|---|---|---|---|---|---|---|---|---|---|---|---|---|---|
|
||||||||||||||||||||||||||||||||||||||||
the United States in the 1990s, most injuries resulted from random
violence to innocent bystanders; the prime example was “drive-by
shootings.”121,130
Few were self-inflicted, either voluntarily or accidentally. In a 1976
report on patients in a relatively rural setting in Canada, almost all
the missile injuries were accidental, having been caused by the patient
or a close friend or relative.61
The firepower of these weapons has changed over the years. In one urban
hospital reporting gunshot wounds from 1973 to 1983, most of the
injuries were from .32- or .38-caliber weapons; only 5% were
high-caliber or high-velocity weapons.87
In a later study of gunshot wounds from the same institution from 1991
to 1994, the incidence of injuries from high-caliber and high-velocity
weapons (e.g., .357 magnum, AK-47, and other assault rifles) had
increased to 35%.113
complications were growth arrest and infection. Other complications
included delayed union and malunion. Considering the magnitude of many
of these injuries, the infection rate for extremity wounds was low
(about 7.3%). The type of missile did not seem to have any relation to
the development of an infection.130
In a third of their patients, the missile was only in close proximity
to the physis, but still appeared to cause a growth disturbance. In a
1995 report by Washington et al.,130
the incidence of missiles’ growth arrest was exactly the same; however,
all were a result of a direct injury to the physis by the missile. None
of their patients with growth arrest had proximity missile wounds. The
higher incidence of growth abnormalities in the 1976 series was due to
the larger number of shotgun and hunting rifle injuries, which
dissipate more of their energy peripheral to the missile track.
found in their review of children and adolescents who required
hospitalization for gunshot wounds that almost half of them were
discharged with disabilities.
analyzed the magnitude and implications of the increasing incidence of
firearm-related injuries in children. They suggested a product-oriented
approach, focusing on the gun, in an attempt to provide an efficient
strategy of gun control and hence reduce the disturbing trend of
firearm-related injuries and death among youths. Rather than modifying
behavioral or environmental issues, which are more complex, they
suggested focusing primarily on strategies that offset the
accessibility and design of firearms. In brief, these strategies
included reducing the number of guns in the environment through
restrictive legislation, gun buy-back programs, gun taxes, physician
counseling, and modifying the design of guns to make them more
child-proof and prevent unauthorized and unintended use.
in fracture rates was found when cities with a high calcium content in
their water were compared with those with a lower calcium content. With
all other factors being equal (e.g., fluoride content, socioeconomic
background), children who lived in the cities with a lower calcium
content had a higher fracture rate.126
has been shown to produce an increased incidence of fractures in
adolescents.135
found that the mineral content of the forearms was lower in children
who sustained fractures from mild trauma than in children who had never
sustained fractures. It was not significantly different, however, in
those sustaining fractures from severe trauma. This study used
measurements of bone density of the cortical bone in the forearms. Cook
et al.,27 using measurements of bone
density obtained from trabecular bone in the spine and femoral neck,
found no difference between children who had sustained fractures and
those who had not.
in 1% to 2% of low-birth-weight or premature infants during their stay
in a neonatal intensive care unit.6
A combination of clinical history, radiographic appearance, and
laboratory data has shown evidence of bone loss from inadequate calcium
and phosphorus intake in these infants. Correcting the metabolic status
of these low-birth-weight infants, with special emphasis on calcium and
phosphorus intake, appears to decrease the incidence of repeat
fractures and to improve the radiographic appearance of their bony
tissues. Once the metabolic abnormalities are corrected, this temporary
deficiency seems to have no long-term effects. When premature infants
were followed into later years, there was no difference in their
fracture rate compared with that of children of normal birth weight.30
fractures is to identify problem areas. It is hoped that by targeting
these areas, programs can be designed to decrease the risk factors.
programs. The foremost is the American Academy of Pediatrics, which has
committees on accident and poisoning prevention, and has produced
guidelines for athletics,5 playgrounds,98,132 trampolines,3,4 ATVs, and skateboards.25
The American Academy of Orthopaedic Surgeons has produced a program
designed to decrease the incidence of playground injuries. These
programs offer background data and guidelines for various activities,
but their effectiveness has not been fully studied.
local participation and cooperation. They must be broad-based, and they
require considerable effort by members of the local community. In the
United States, one effective program is the New York Health
Department’s “Kids Can’t Fly” campaign, developed in response to the
large number of injuries and deaths from children falling out of
apartment house windows in the 1970s.118
This extensive program consisted of a good reporting system from
hospital emergency rooms, with follow-up by public health personnel; a
strong media campaign to educate the public; a door-to-door hazard
identification program; and the distribution of low- or no-cost, easily
installed window guards to families in high-rise apartments. The city
required property owners to provide window guards in apartments where
children 10 years or younger lived. The success of this program was
demonstrated by a 50% decrease in reported falls after 3 years and a
96% decrease after 7 years.8,118
broaderbased, community-oriented programs to decrease the incidence of
all types of childhood injuries.12
The development of these pilot programs has been relatively easy in a
country like Sweden because the population is homogeneous, the
incidence of poverty is low, and the government is stable. The Swedish
program had a three-pronged approach: injury surveillance and
prevention research; establishment of a safer environment for children
through legislative regulation; and a broad-based safety education
campaign. These programs have produced positive results. Schelp
demonstrated a 27% reduction in home accidents in the municipality of
Falkoping only 3 years after the establishment of a community-wide
campaign.107
participation and education. All the articles, lectures, and pamphlets
in the world cannot help unless local communities make the necessary
changes to decrease accident risks.
ME, Jaffe KM, DiScala C, et al. Functional outcome in children with
multiple trauma without significant head injury. Arch Phys Med Rehabil
1999;80(8):889-895.
Academy of Pediatrics. Committee on Pediatric Aspects of Physical
Fitness, Recreation, and Sports. Competitive athletics for children of
elementary school age. Pediatrics 1981:67(6):927-928.
Academy of Pediatrics, Committee on Accident and Poison Prevention and
Committee on Pediatric Aspects of Physical Fitness, Recreation, and
Sports. Trampolines II. Pediatrics 1981; 67:438-439.
L, Borgstrom KE. Seasonal variation of epiphysiolysis of the hip and
possibility of causal factor. Acta Orthop Scand 1958;28(1):22-26.
B, Niemirska M, Gandhi RP, et al. Ten years of experience with falls
from a height in children. J Pediatr Surg 1983;18(4):509-511.
JH, Austin SM, Warner WC, et al. Interlocking intramedullary nailing of
femoral shaft fractures in adolescents: preliminary results and
complications. J Pediatr Orthop 1994;14(2):178-183.
JH, Kasser JR, eds. Rockwood & Wilkins fractures in children. 5th
ed. Philadelphia: Lippincott Williams & Wilkins, 2001.
C, Giddings P, Robinson M. Australian snowboard injury data base study.
A 4-year prospective study. Am J Sports Med 1993;21(5):701-704.
WT, Sprunger LW, Sobolewski S, et al. Epidemiology of injuries in a
large, urban school district. Pediatrics 1984;74(3):342-349.
MR, O’Connor DP. The incidence of fractures and dislocations referred
for orthopaedic services in a capitated population. J Bone Joint Surg
Am 2004;86-A(2): 290-297.
SL, Gotschall C, Robertson W Jr, et al. The relationships of skeletal
injuries with trauma score, injury severity score, length of hospital
stay, hospital charges, and mortality in children admitted to a
regional pediatric trauma center. J Pediatr Orthop 1994;14(4):449-453.
M, Vulcan AP, Finch CF, et al. Mandatory bicycle helmet use following a
decade of helmet promotion in Victoria, Australia—an evaluation. Accid
Anal Prev 1996;26(3):325-337.
DJ, Marshall SW, Langley JD, et al. Height and surfacing as risk
factors for injury in falls from playground equipment: a case-control
study. Inj Prev 1996;2(2): 98-104.
JC, Ng BK, Ying SY, et al. A 10-year study of the changes in the
pattern and treatment of 6493 fractures. J Pediatr Orthop
1999;19:344-350.
JC, Shen WY. Limb fracture pattern in different pediatric age groups: a
study of 3350 children. J Orthop Trauma 1993;7(1):15-22.
DG, Hyndman JC, Leahey JL, et al. Short-arm plaster for pediatric
distal forearm fractures. J Pediatr Orthop 1994;14(2):211-213.
PJ, Ludwig J. Guns in America: Results of a Comprehensive National
Survey on Firearms Ownership and Use. Washington, DC: Police
Foundation, 1996.
SD, Harding AF, Morgan EL, et al. Association of bone mineral density
and pediatric fractures. J Pediatr Orthop 1987;7(4):424-427.
PJ, Clarke NM. Improving the outcome of paediatric orthopaedic trauma:
an audit of inpatient management in Southampton. Ann R Coll Surg Engl
1997;79(6):441-446.
SL, Bishop NJ, Lucas A. Are preterm infants at risk for subsequent
fractures? Arch Dis Child 1989;64(10 Spec No):1384-1385.
C, Sege R. Outcomes in children and young adults who are hospitalized
for firearms-related injuries. Pediatrics 2004;113(5):1306-1312.
W, Woodward CA, Hodgson C, et al. Prospective study of school injuries:
incidence, types, related factors, and initial management. Can Med
Assoc J 1983; 129(12):1279-1283.
KA, Strother RT, Mohtadi N. The effect of bicycling helmets in
preventing significant bicycle-related injuries in children. Clin J
Sport Med 1996;6(2):102-107.
DM, Charlton JR. Morbidity and healthcare utilization of children in
households with one adult: comparative observational study. BMJ
1988;316(7144): 1572-1576.
LH, Vernick JS, Hargarten SW. Prevention of firearm-related injuries
and deaths among youth. A product-oriented approach. Pediatr Clin North
Am 1998;45(2): 427-438.
GJ, Vitale MA, Kessler MW, et al. The most frequent traumatic
orthopaedic injuries from a national pediatric inpatient population. J
Pediatr Orthop 2005;25(1): 39-44.
J, Heidjann J, Thorwesten L, et al. Injury patterns in acceptance of
passive and active injury prophylaxis for inline skating. Knee Surg
Sports Traumatol Arthrosc 1998; 6(1):44-49.
K, Weiner DS. The management of forearm fractures in children: a plea
for conservatism. J Pediatr Orthop 1999;19(6):811-815.
E, Creek A, Dawkins R, et al. Age-related patterns of injury in
children involved in all-terrain vehicle accidents. J Peditr Orthop
2008;28:854-858.
JB, Tilford JM, Parker JG, et al. National hospitalization impact of
pediatric all-terrain vehicle injuries. Pediatrics
2005;115(3):e316-e321.
B, Nyland JA, Roberts CS, et al. Recreational all-terrain vehicle
injuries among children: an 11-year review of a Central Kentucky level
1 pediatric trauma center database. J Pediatr Orthop 2007;27:851-855.
SB, Nance ML, Rutherford GW Jr, et al. Skateboard-associated injuries:
participation-based estimates and injury characteristics. J Trauma
2002;53(4):686-690.
S, Robitaille Y, Lesage D, et al. Playground injuries: surface
characteristics, equipment height, and the occurrence and severity of
playground injuries. Inj Prev 2001;7(1):35-40.
LA. Fracture patterns in children. Analysis of 8682 fractures with
special reference to incidence, etiology, and secular changes in a
Swedish urban population 1950-1979. Acta Orthop Scand Suppl
1983;64(suppl 202):1-109.
DD, Ambler AG, Beaudoin DE. The epidemiology of school-related
injuries: new perspectives. Am J Prev Med 1992;8(3):193-198.
RT, Feinberg JR. Orthopaedic injuries in children with nonaccidental
trauma: demographics and incidence from the 2000 kids’ inpatient
database. J Pediatr Orthop 2007;27(4):421-6.
AA, Rennie TF. A survey of accidents to children aged under 15 years
seen at a district hospital in Sydney in 1 year. Med J Aust
1969;1(16):806-809.
JP, Ashley E, Hoffer M. Ulnar nerve palsies after percutaneous
cross-pinning of supracondylar fractures in children’s elbows. J
Pediatr Orthop 1998;18(1):43-45.
RA, Delahunty AM, Heaven M, et al. Incidence of fractures in affluent
and deprived areas population based study. BMJ 2000;320(7228):149.
MG, Hudson S, Thompson D. A descriptive analysis of children’s
playground injuries in the United States 1990-1994. Inj Prev
1997;3(2):100-103.
A, Soon MY, Lam KS. Monkey bars are for monkeys: a study on playground
equipment-related extremity fractures in Singapore. Singapore Med J
2004;45(1):9-13.
AB, Mendoza-Sagaon M, Cardinaux C, et al. Evaluation of scooter-related
injuries in children. J Pediatr Surg 2002;37(5):755-759.
DC, Rajmaira S. Distribution of physeal and nonphyseal fractures in
2650 long-bone fractures in children aged 0-16 years. J Pediatr Orthop
1990;10(6):713-716.
RA, Garvin KL, Huurman WW. Avascular necrosis of the femoral head after
closed intramedullary shortening in an adolescent. J Pediatr Orthop
1995;15(1):24-26.
T, Benson WM, Foster BK, et al. Statistical analysis of the incidence
of physeal injuries. J Pediatr Orthop 1987;7(5):518-523.
DL, Wang F, Pickett W, et al. A case-control study of risk factors for
playground injuries among children in Kingston and area. Inj Prev
1998;4(1):39-43.
RJ, Brand D, Lenfesty B, et al. Statewide assessment of injury and
death rates among riders of off-road vehicles treated at trauma
centers. J Am Coll Surg 2007; 204(2):216-224.
JS, Schneps SC, Di Scala C, et al. Skateboarding: more dangerous than
roller skating or inline skating. Arch Pediatr Adolesc Med
1998;152(10):985-991.
E, Sibert J, Dedoukou X, et al. Injuries in public and private
playgrounds: the relative contribution of structural, equipment, and
human factors. Acta Paediatr 2002;91(6):691-697.
KJ, Khoury J, Kalkwarf HJ, et al. Trends and patterns of playground
injuries in United States children and adolescents. Ambul Pediatr
2001;1(4):227-233.
AM, Graham HK, Krajbich JI. Management of displaced extension-type
supracondylar fractures of the humerus in children. J Bone Joint Surg
Am 1988;70(5): 641-650.
R, Lindsey RW, Hadley NA, et al. Refracture of adolescent femoral shaft
fractures: a complication of external fixation: a report of two cases.
J Pediatr Orthop 1993;13(1): 102-105.
Health Service. Healthy people 2000: national health promotion and
disease prevention objectives. Washington, DC: US Department of Health
and Human Services, Public Health Service, 1990; DHHS publication no.
(PHS)90-50212.
FP, Bergman AB, LoGerfo JP, et al. Epidemiology of childhood injuries.
II. Sex differences in injury rates. Am J Dis Child 1982;136(6):502-506.
R, Rønning I, Gerner T, et al. The efficacy of wrist protectors in
preventing snowboarding injuries. Am J Sports Med 2001;29(5):581-585.
DA, Repett-Wright R, Howarth CI. The exposure of young children to
accident risk as pedestrians. Ergonomics 1974;17(4):457-480.
J, Sarkola T, Nietosvaara Y. Injuries in children associated with the
use of nonmotorized scooters. J Pediatr Surg 2003;38(11):1612-1615.
PC, Harel Y, Trumble AC, et al. The epidemiology of nonfatal injuries
among US children and youth. Am J Public Health 1995;85(7):932-938.
L. The role of organizations in community participation-prevention of
accidental injuries in a rural Swedish municipality. Soc Sci Med
1988;26(11):1087-1093.
LP, Bagg RJ, Wagnon J. Etiology of pediatric fractures: the fatigue
factors in children’s fractures. Presented at National Conference on
Pediatric Trauma, Indianapolis, 1992.
E, Mulhall KJ, Kearns S, et al. Impact of dedicated skate parks on the
severity and incidence of skateboard- and rollerblade-related pediatric
fractures. J Pediatr Orthop 2003;23(4):440-442.
SB, Evans GD. Epidemiology of school injuries: a 2-year experience in a
municipal health department. Pediatrics 1987;79(1):69-75.
GA. Injuries to children in the United States related to trampolines,
1990-1995: a national epidemic. Pediatrics 1998;101(3 Pt 1):406-412.
MD, Burrington JD, Woolf AD. Injuries in children sustained in free
falls: an analysis of 66 cases. J Trauma 1975;15(11):987-991.
CN, Lindaman FC. Children can’t fly: a program to prevent childhood
morbidity and mortality from window falls. Am J Public Health
1977;67(12):1143-1147.
AD, Bennet GC, Stone DH, et al. Association between childhood fractures
and poverty: population-based study. BMJ 2002;324(7335):457.
JJ 3rd. The national pediatric trauma registry: a legacy of commitment
to control of childhood injury. Semin Pediatr Surg 2004;13(2):126-132.
CJ, Landin L, Duppe H. Decreasing incidence of fractures in children—an
epidemiological analysis of 1673 fractures in Malmö, Sweden, 1993-1994.
Acta Orthop Scand 1999;70(6):622-626.
T, et al. Motor vehicle injuries in pediatric trauma patients.
Presented at the American Academy of Orthopaedic Surgeons Annual
Meeting, Orlando, 1995.
Vallespir S, Domínguez Sánchez J, González Quintial M, et al.
Association between calcium content of drinking water and fractures in
children. (Article in Spanish) An Esp Pediatr 1992;37(6):461-465.
K, Johansen A, Stone MD, et al. Seasonal variation in the incidence of
wrist and forearm fractures, and its consequences. Injury
2003;34(3):219-222.
ER, Lee WA, Ross WA Jr. Gunshot wounds to the extremities in children
and adolescents. Orthop Clin North Am 1995;26(1):19-28.
PCN. A comparative epidemiologic study of fractures among Indian,
Malay, and Swedish children. Med J Malaya 1965;20(2):132-143.
G, Frisch RE. Carbonated beverages, dietary calcium, the dietary
calcium/phosphorus ratio, and bone fractures in girls and boys. J
Adolesc Health 1994;15(3): 210-215.