
Editors: Berquist, Thomas H.
Title: Musculoskeletal Imaging Companion, 2nd Edition
Copyright ©2007 Lippincott Williams & Wilkins
> Table of Contents > Chapter 5 – Knee
Chapter 5
Knee
Thomas H. Berquist
Protocols
-
Radiographs or computed radiography images
-
Routine images
-
Anteroposterior (AP) and lateral (minimum two views)
-
Trauma
-
AP, lateral (cross-table preferred to detect lipohemarthrosis), both obliques
-
Patella
-
Lateral and tangential (sunrise) views
-
Orthopedic series
-
AP standing, AP standing with flexion, lateral, and patellar views
-
Additional techniques
-
Notch views
-
Stress views (varus, valgus, AP)
-
-
-
Computed tomography (CT)
-
Helical CT images at 1-mm thick sections at 0.5-mm intervals (can be reformatted in the coronal and sagittal planes)
-
Bone and soft tissue window settings
-
-
Magnetic resonance imaging (MRI) (Table 5-1)
-
Extremity coil, knee slightly flexed (5 to 10 degrees)
-
P.211
|
TABLE 5-1 MAGNETIC RESONANCE SCREENING EXAMINATION OF THE KNEE
|
||||||||||||||||||||||||||||||||||||||||||
|---|---|---|---|---|---|---|---|---|---|---|---|---|---|---|---|---|---|---|---|---|---|---|---|---|---|---|---|---|---|---|---|---|---|---|---|---|---|---|---|---|---|---|
|
Skeletal Trauma: Osteochondral Fractures
Key Facts
-
Fractures involving the joint surface result from direct blows or shearing forces.
-
Fractures may be subtle, requiring CT or MRI for detection.
-
Osteochondral patellar fractures are commonly associated with dislocation.
-
Associated soft tissue injury is common.
P.212
 |
|
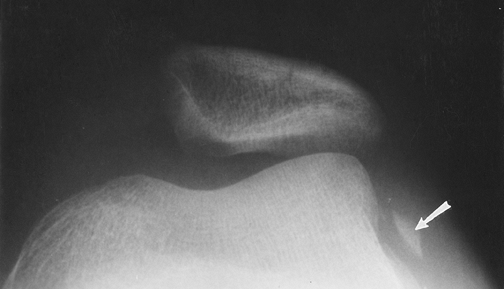
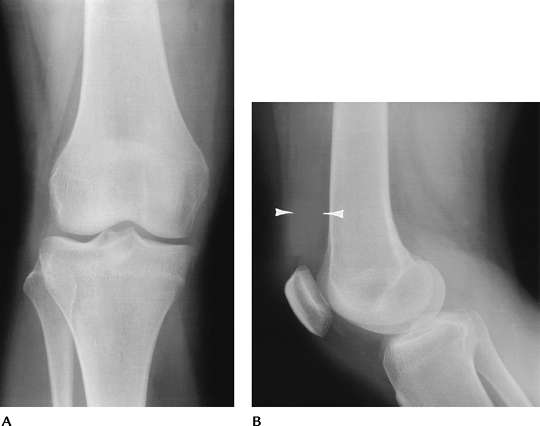
FIGURE 5-1
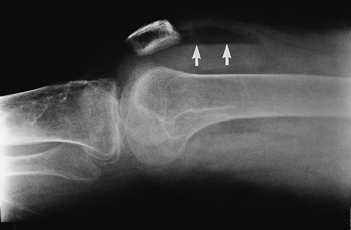
Patellar view demonstrating subluxation after reduction of a patellar dislocation. There is a displaced osteochondral fragment (arrow) laterally. |
Suggested Reading
Capps GW, Hayes CW. Easily missed injuries about the knee. Radiographics 1994;14:1191–1210.
Dezell PB, Schils JP, Recht MP. Subtle fractures about the knee: Innocuous appearing yet indicative of internal derangement. AJR Am J Roentgenol 1996;167:699–703.
P.213
Skeletal Trauma: Patellar Fractures
Key Facts
-
Patellar fractures account for 1% of all skeletal fractures.
-
The mechanism of injury is direct trauma
(motor vehicle accidents 28%, falls 68%) or indirect trauma (4%), such
as quadriceps contraction. -
Types of patellar fracture: transverse or oblique 34%; comminuted 16%; longitudinal 28%; apical or basal 28%.
-
A bipartite patella involves the upper outer quadrant. It usually is bilateral and should not be confused with a fracture.
-
Routine radiographs (AP, lateral, patellar views) usually are diagnostic.
-
Treatment includes reduction with
internal fixation for displaced fractures. Fractures with less than 2
to 3 mm of displacement and articular surface congruency can be treated
conservatively (casting). Badly comminuted fractures may require
partial or complete patellectomy. -
Complications
-
Osteoarthritis
-
Nonunion
-
 |
|
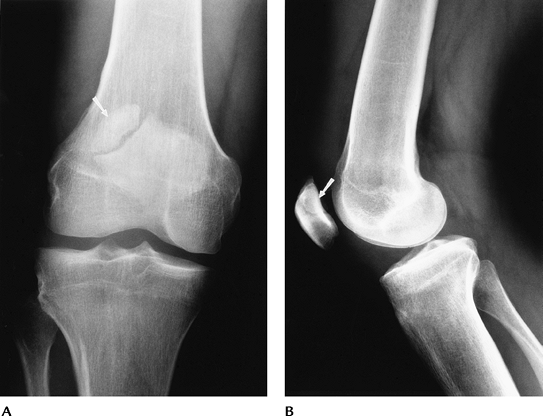
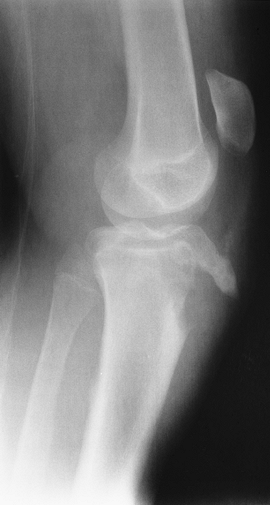
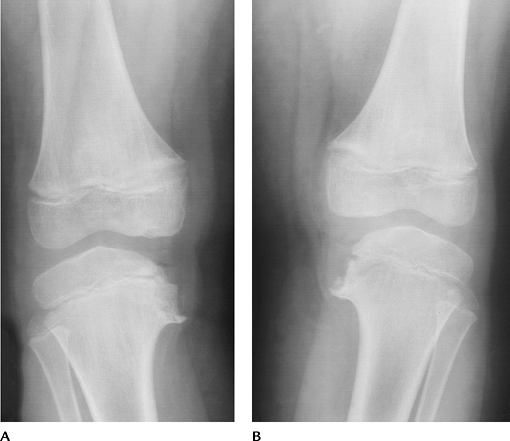
FIGURE 5-2 AP (A) and lateral (B) radiographs of a bipartite patella (arrow).
|
P.214
 |
|
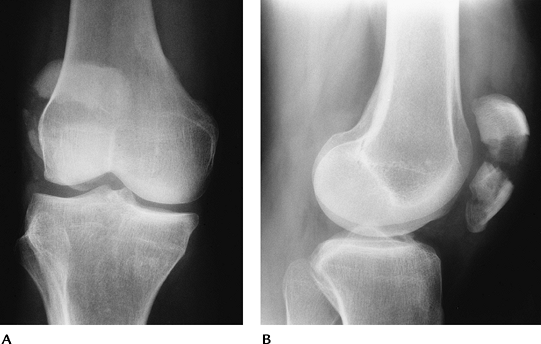
FIGURE 5-3 AP (A) and lateral (B) radiographs of a comminuted displaced patellar fracture.
|
P.215
 |
|
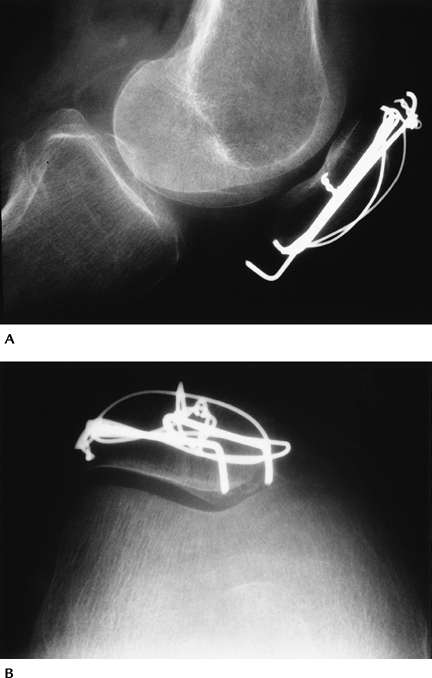
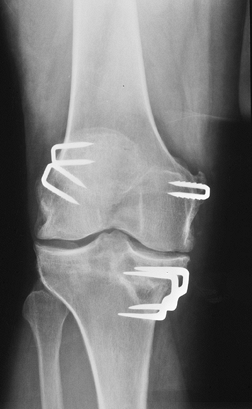
FIGURE 5-4 Lateral (A) and patellar (B) views after reduction with K-wires and tension band. The articular surface is reduced.
|
Suggested Reading
Bostrom A. Fracture of the patella. Acta Orthop Scand Suppl 1972;143:1–80.
P.216
Skeletal Trauma: Supracondylar Fractures
Key Facts
-
Supracondylar fractures involve the
distal 9 cm of the femur. Fractures of the distal femur account for 7%
of all femoral fractures. Open injuries account for 5% to 10%. -
Intra-articular extension is common. These complex fractures are difficult to manage.
-
Associated tibial plateau fractures are common.
-
Mechanisms of injury include minor trauma
to the flexed knee in elderly patients and high-velocity forces applied
to the anterolateral, lateral, or medial aspect of the knee. -
Routine radiographs (AP and lateral) are diagnostic.
-
Treatment may be conservative (casting or traction) or operative to reduce and achieve restoration of the joint and leg length.
-
Complications:
| Early | Late |
|---|---|
| Vascular injury | Infection |
| Infection | Nonunion |
| 1% of closed | Malunion |
| 20% of open | Osteoarthritis |
| Failed reduction |
P.217
P.218
 |
|
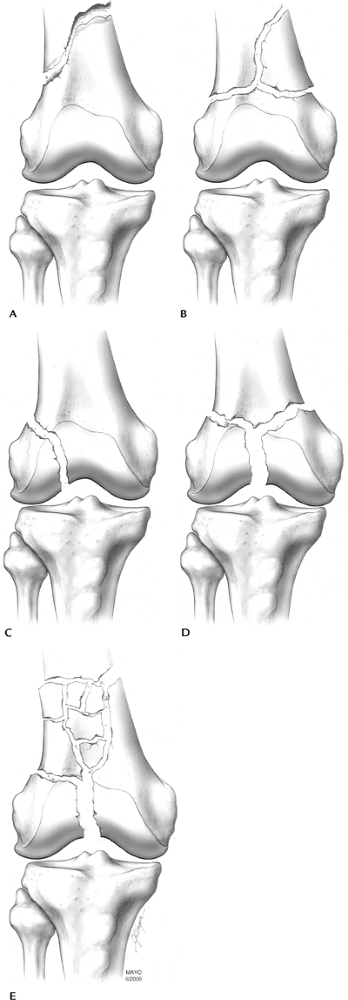
FIGURE 5-5 Orthopedic Trauma Association Classification. Type A: extra-articular, simple (A) or comminuted (B) Type B: partial articular, one condyle involved (C) Type C: complete articular, both condyles involved with “Y” pattern (D) or (E).
|
P.219
 |
|
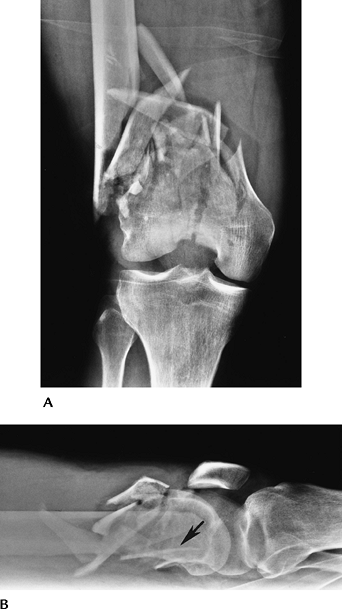
FIGURE 5-6 AP (A) and lateral (B) radiographs of a severely comminuted complete articular fracture. Note the loss of length and posterior rotation (arrow) of the distal fragment in (B).
|
P.220
 |
|
FIGURE 5-7
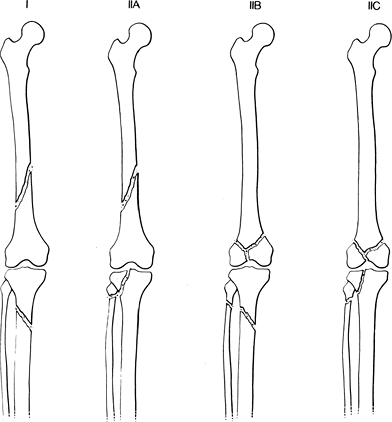
Ipsilateral fractures of the tibia, fibula, and femur. Type I: tibial and femoral fractures without knee involvement (71% of cases). Type IIA: femoral fracture with tibial articular involvement (16.5% of cases). Type IIB: femoral articular involvement and proximal tibia and fibular fractures. Type IIC: both articular surfaces involved (8% of cases). |
Suggested Reading
Fraser RD, Hunter GA, Waddle JP. Ipsilateral fractures of the femur and tibia. J Bone Joint Surg 1978;60B:510–515.
O’Brien P, Meek RN, Blachut PA, et al. Fractures of the distal femur. In: Bucholz RW, Heckman JD, eds. Rockwood and Green’s fractures in adults. 5th ed. Philadelphia: Lippincott Williams & Wilkins; 2001:1731–1773.
Orthopedic Trauma Association Committee on Coding and Classifications. Fractures and dislocations compendium. J Orthop Trauma 1996;10(suppl):41–45.
P.221
Skeletal Trauma: Proximal Tibial Fractures
Key Facts
-
Proximal tibial fractures may be extra-articular or articular (tibial plateau or condylar fractures).
-
Tibial plateau (condyle) fractures
account for 1% of all fractures and 8% of fractures in the elderly. The
majority (55%–70%) of plateau fractures involve the lateral plateau.
Isolated medial plateau factures occur in 10% to 23% of cases, and
medial and lateral fractures occur in 10% to 30% of cases. -
Mechanism of injury is motor vehicle
accidents (54%) or falls (46%) leading to vertical compression (T and Y
fractures) varus and valgus forces (medial and lateral plateau
fractures, respectively). -
Ligament and meniscal injuries are common with varus, valgus, or twisting forces.
-
AP and lateral radiographs usually are diagnostic for displaced fractures.
-
CT and MRI frequently are indicated to evaluate fragment position and soft tissue injury.
-
Management is based on four key factors:
degree of articular depression, degree of fragment separation, degree
of comminution, and extent of soft tissue injury. -
Depression of 4 to 8 mm and separation of fragments 4 mm or more generally indicate a need for internal fixation.
-
Complications include infection, nonunion, and arthropathy.
-
Ipsilateral, femoral, and tibial condylar fractures are not uncommon and have the following significant associated injuries:
-
Abdominal and chest injuries 20%
-
Open injury to leg 60%
-
Neurovascular injury 7%
-
 |
|
FIGURE 5-8
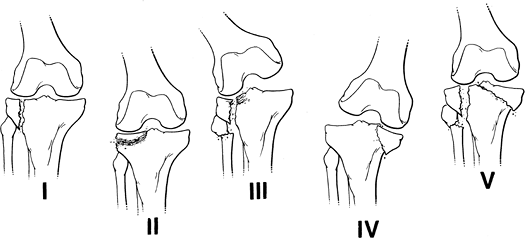
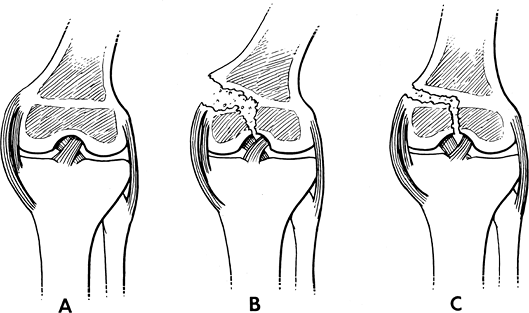
Hohl classification of tibial plateau fractures: I, undisplaced fracture (24%); II, central depression (26%); III, split compression, usually with fibular fracture (29%); IV, total condylar depression (11%); V, comminuted bicondylar fractures (10%). |
P.222
 |
|
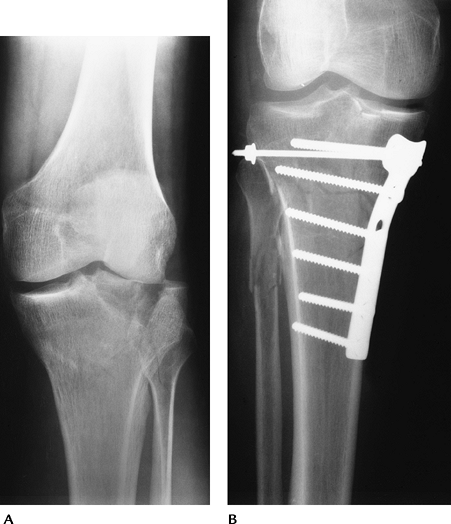
FIGURE 5-9 (A) Tibial plateau fracture with splitting and separation laterally. (B) Tibial plateau fracture reduced with buttress plate and screws to restore joint congruency.
|
P.223
 |
|
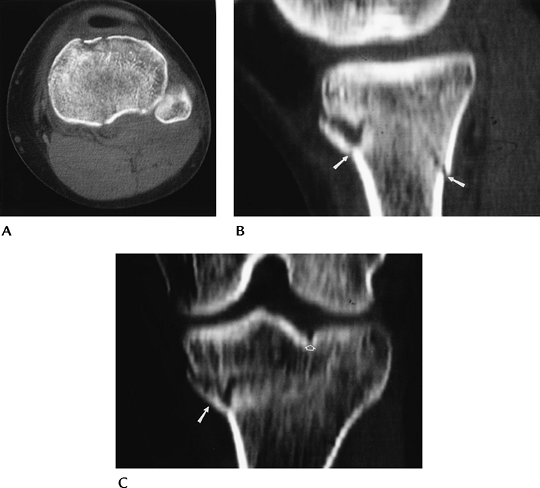
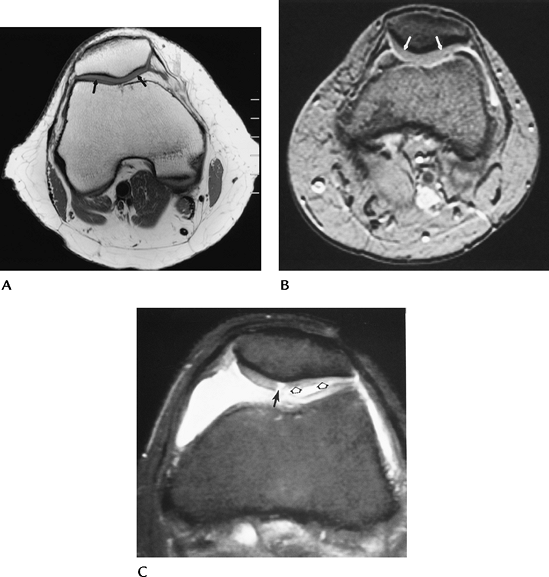
FIGURE 5-10 CT images in the axial (A), sagittal (B), and coronal (C) planes demonstrating a minimally depressed fracture (arrows) with minimal articular displacement (open arrow).
|
Suggested Reading
Hohl M. Tibial condylar fractures. J Bone Joint Surg 1967;49A:1455–1467.
P.224
Skeletal Trauma: Miscellaneous Fractures
Key Facts
-
Other tibial and femoral fractures
include avulsion fractures, tibial spine fractures, tuberosity
fractures, physeal fractures, stress fractures, and bone bruises. -
Subtle osseous injury may be initially detected by the presence of a lipohemarthrosis on cross-table lateral radiographs.
-
Physeal fractures about the knee account
for only 0.5% to 3% of physeal injuries. Femoral physeal fractures are
more common because of the ligament support of the knee. Most injuries
are Salter-Harris Types I and IV. -
The second fracture is an avulsion injury
at the insertion of the middle third of the capsular ligament on the
upper lateral tibia. Anterior cruciate ligament (ACL) tears are
associated in 75% to 100% of cases. -
Stress fractures of the tibia and femur
are subtle early radiographically. MRI has replaced radionuclide scans
for more effective and specific early diagnosis. -
Bone bruises usually are not evident on
radiographs but easily detected with MRI. Associated meniscal and/or
ligament injuries are common and also easily appreciated on magnetic
resonance (MR) images.
 |
|
FIGURE 5-11 Ligament support about the knee. (A) The tibial physis is within the ligament support, and the femoral physis is proximal resulting in greater risk for fracture (B,C).
|
P.225
 |
|
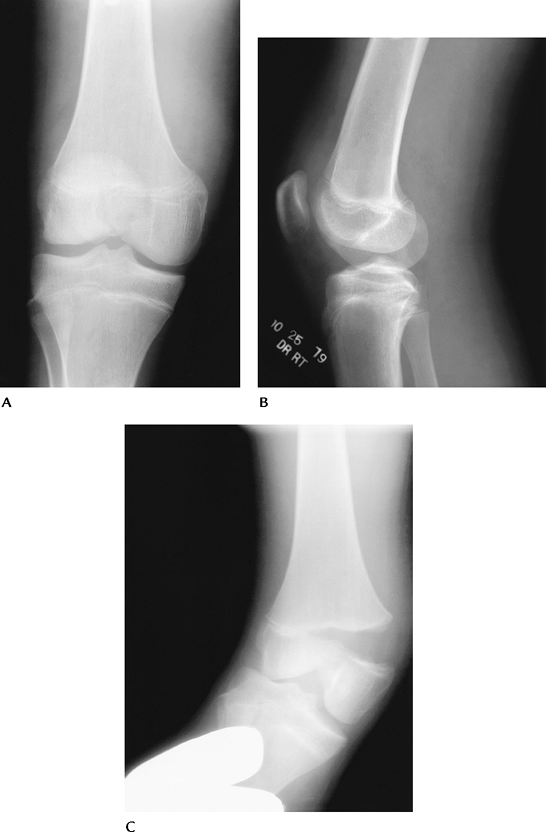
FIGURE 5-12 AP (A), lateral (B), and stress views (C) of a Salter-Harris III femoral fracture.
|
P.226
 |
|
FIGURE 5-13 AP radiograph of a Segond fracture (arrow).
|
P.227
 |
|
FIGURE 5-14 Lateral radiograph of a tibial tuberosity avulsion.
|
P.228
 |
|
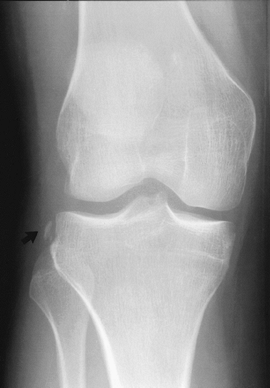
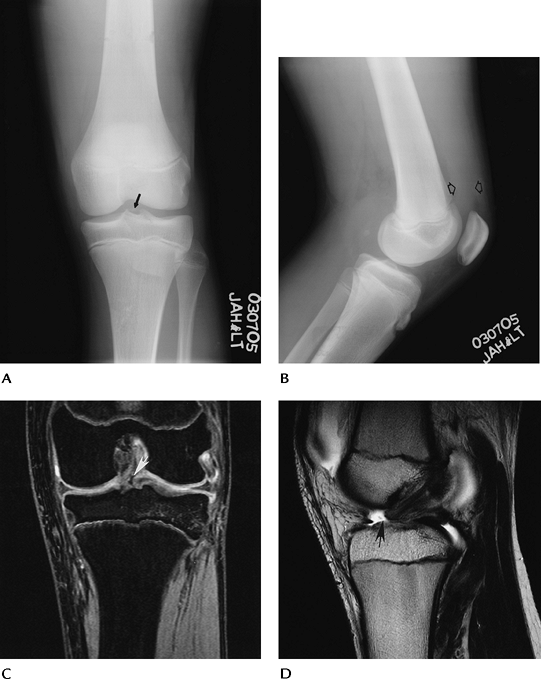
FIGURE 5-15 Tibial spine–ACL avulsion. AP (A) and lateral (B) radiographs demonstrate a joint effusion (open arrows) and subtle bone fragment (arrow) in the joint space. Coronal double-echo steady state (C) and sagittal T2-weighted (D) MR images demonstrate the ACL avulsion (arrow).
|
P.229
 |
|
FIGURE 5-16 Cross-table lateral radiograph demonstrating a lipohemarthrosis (arrows) indicating an intra-articular fracture.
|
 |
|
FIGURE 5-17 (A) AP radiograph is normal. (B) Coronal T1-weighted image clearly demonstrates the stress fracture (arrow).
|
P.230
 |
|
FIGURE 5-18 Bone bruise (arrow) clearly demonstrated on the sagittal T2-weighted (A) and coronal T1-weighted (B) MR images. Note the abnormal medial collateral ligament (MCL) (white arrow in B) resulting from valgus injury.
|
Suggested Reading
Dezell PB, Schils JP, Recht MP. Subtle fractures about the knee: Innocuous-appearing yet indicative of internal derangement. AJR Am J Roentgenol 1996;167:699–703.
P.231
Meniscal Lesions: Meniscal Tears
Key Facts
-
Meniscal tears are the most common cause of knee pain and instability.
-
Patients present with pain, locking, or “giving way.”
-
Tears may be the result of acute trauma or repetitive trauma with progressive degeneration.
-
The lateral meniscus is C-shaped and less
firmly attached to the capsule (separated posteriorly by popliteus
tendon sheath). The medial meniscus is more firmly attached, and the
posterior horn is larger (Fig. 5-19). -
MRI has replaced other imaging techniques
for diagnosis of meniscal tears. Tears are most easily identified on
spin-echo proton density images. Conventional spin-echo sequences are
93% sensitive compared with 80% for fast spin-echo sequences. Sagittal,
coronal, and axial image planes should all be evaluated to properly
characterize the type of tear. -
Meniscal tears are described by configuration and location. The posterior horn is most commonly involved.
-
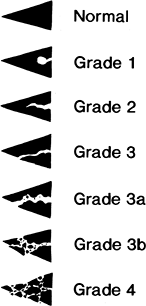
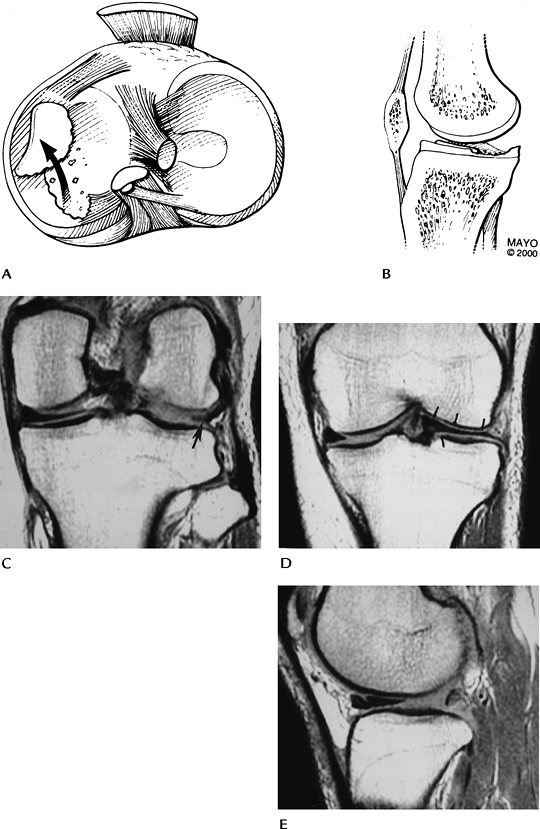
MR criteria for classifying meniscal tears have been clearly defined (Fig. 5-21).
-
Treatment depends on the location
(peripheral vs. central) and type of tear. Peripheral tears may heal or
be repaired as in the vascular zone. Displaced fragments may be removed
arthroscopically. Allograft replacement is an evolving technique.
P.232
 |
|
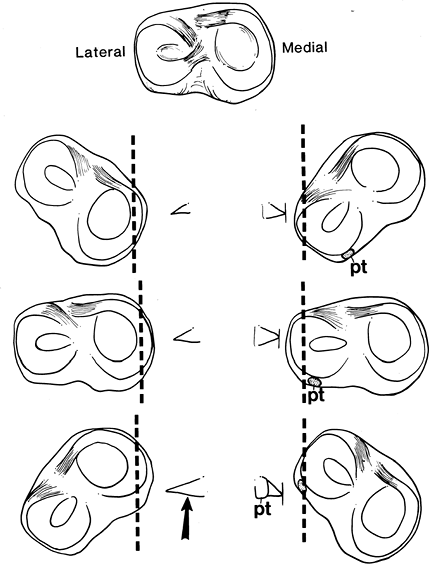
FIGURE 5-19
Meniscal appearance (medial and lateral) with the knee in different degrees of rotation. Note the posterior horn of the medial meniscus (arrow) is larger. The popliteus tendon sheath (pt) separates the lateral meniscus from the capsule posteriorly. |
P.233
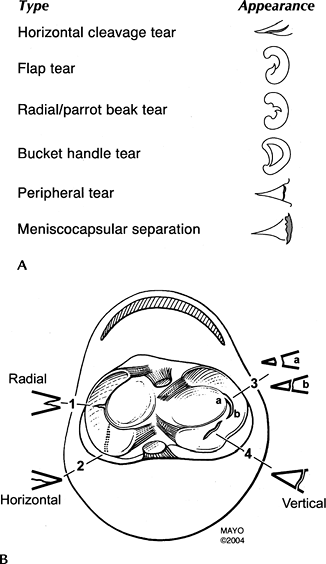 |
|
FIGURE 5-20 (A) Types and appearances of meniscal tears. (B) Meniscal tears seen in the axial and coronal planes.
|
P.234
 |
|
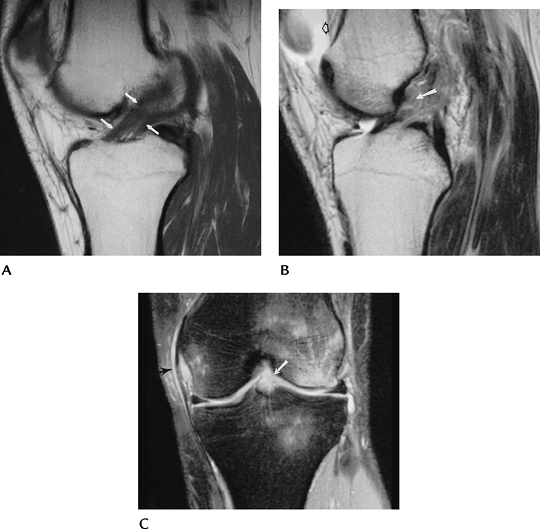
FIGURE 5-21
MR classification of meniscal tears. Normal-low signal intensity. Grade 1: globular increased signal intensity that does not communicate with the articular surface. Grade 2: linear increased signal intensity that does not communicate with the articular surface. Grade 3: linear increased signal intensity that communicates with the articular surface, a true tear. Grade 3a and b: more extensive articular involvement. Grade 4: complex tears with distortion of the meniscus. |
 |
|
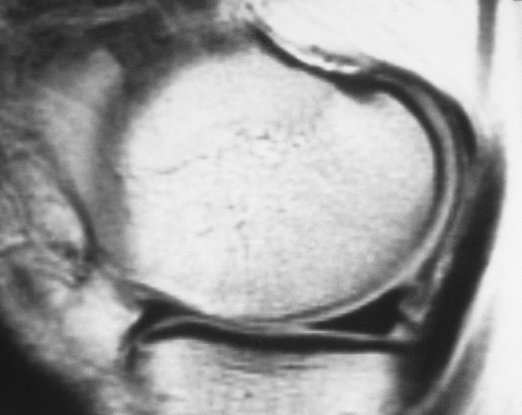
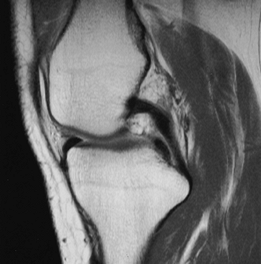
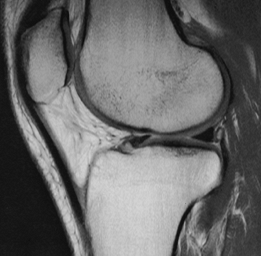
FIGURE 5-22 Sagittal proton density-weighted image of a normal low-intensity meniscus.
|
P.235
 |
|
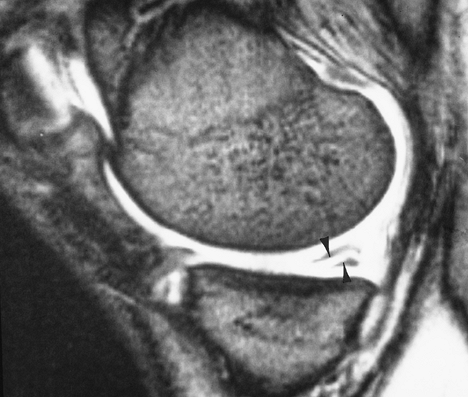
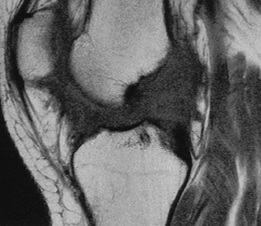
FIGURE 5-23 Gradient-echo sagittal image of a linear tear (arrowheads) in the posterior medial meniscus.
|
P.236
 |
|
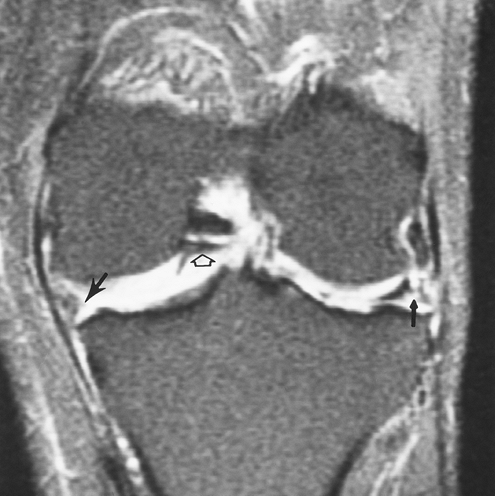
FIGURE 5-24 Coronal fat-suppressed T2-weighted image of a bucket-handle tear of the medial meniscus. Note truncated meniscus (arrow) and displaced fragment (open arrow) giving a “double posterior cruciate ligament (PCL)” sign. There is also a complex tear of the lateral meniscus (small arrow).
|
P.237
 |
|
FIGURE 5-25 Axial (A) and sagittal (B) illustrations of a flipped meniscal fragment. Posterior (C) and anterior (D) coronal proton density-weighted images demonstrate a small posterior meniscal remnant (arrow) and a large meniscus anteriorly (arrows). Compare with the normal medial meniscus. Sagittal image (E) shows a large anterior horn and no posterior horn.
|
P.238
Suggested Reading
Blackman
GB, Majors NM, Helms CA. Comparison of fast spin-echo versus
conventional spin-echo MRI for evaluation of meniscal tears. AJR Am J Roentgenol 2005;184:1740–1743.
GB, Majors NM, Helms CA. Comparison of fast spin-echo versus
conventional spin-echo MRI for evaluation of meniscal tears. AJR Am J Roentgenol 2005;184:1740–1743.
Crues JV III, Murk J, Levy TL, et al. Meniscal tears of the knee: Accuracy of MR imaging. Radiology 1987;164:445–448.
Harper KW, Helms CA, Lambert HS III, et al. Radial meniscal tears: Significance, incidence, and MR appearance. AJR Am J Roentgenol 2005;185:1429–1434.
Wright
DH, Desmet AA, Norres M. Bucket-handle tears of the medial and lateral
menisci of the knee: Value of MR imaging in detecting displaced
fragments. AJR Am J Roentgenol 1995;165:621–625.
DH, Desmet AA, Norres M. Bucket-handle tears of the medial and lateral
menisci of the knee: Value of MR imaging in detecting displaced
fragments. AJR Am J Roentgenol 1995;165:621–625.
P.239
Meniscal Lesions: Postoperative Meniscus
Key Facts
-
Menisci may be partially or completely resected or repaired.
-
Image features applied to diagnosis of
meniscal tears (increased signal intensity extending to the articular
surface and displaced fragments) can be applied after repair. -
Intra-articular gadolinium may improve
accuracy for evaluating the postoperative meniscus. Intra-articular
gadolinium is 92% accurate for detection of retear. -
Arthroscopy is most useful in complex or equivocal cases.
 |
|
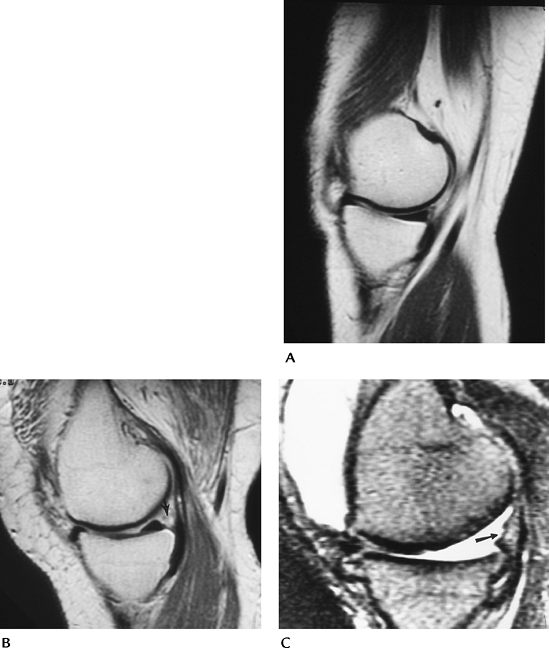
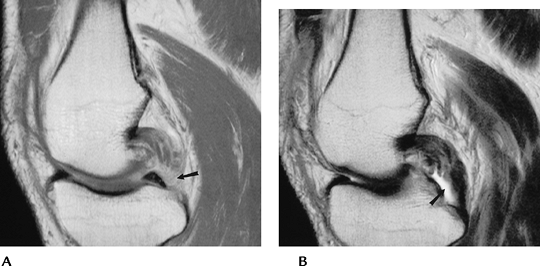
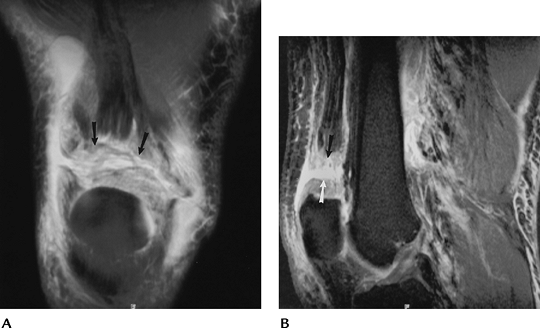
FIGURE 5-26 (A) Sagittal MR image of a normal medial meniscus. (B) Partial meniscectomy and peripheral repair. There is increased signal in the region of the repair (arrow). The central meniscus appears normal. (C) Sagittal T2-weighted image after complete meniscectomy (arrow).
|
P.240
Suggested Reading
Lum PS, Schweitzer ME, Bhatea M, et al. Repeat tear of postoperative meniscus: Potential MR imaging signs. Radiology 1999;210:183–188.
Magee TH, Shapiro M, Rodriguez J, et al. MR arthrography of the postoperative knee: For which patients is it useful? Radiology 2003;229:159–163.
P.241
Meniscal Lesions: Meniscal Cysts
Key Facts
-
Meniscal cysts are reported in 1% of patients undergoing meniscectomy.
-
They are most common anterolaterally but can occur medially.
-
Meniscal tears usually are present and may be the basis for cyst formation.
-
Patients present with tenderness and joint-line swelling.
-
Meniscal cysts can be diagnosed with arthrography, but MRI is preferred.
-
Treatment requires decompression of the cyst and meniscal repair.
-
MR features include
-
Well-defined high-signal intensity lesion adjacent to or partially including the meniscus on T2-weighted sequences.
-
Cysts may be septated (47%) and up to 5 cm in size.
-
-
Ganglion cysts and cruciate ligament cysts may be confused with meniscal cysts.
 |
|
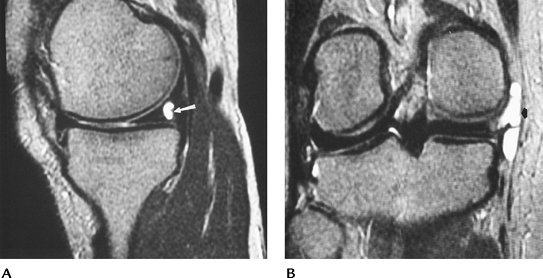
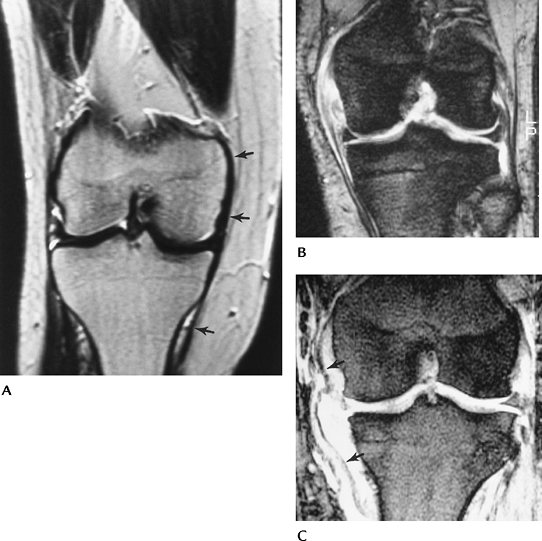
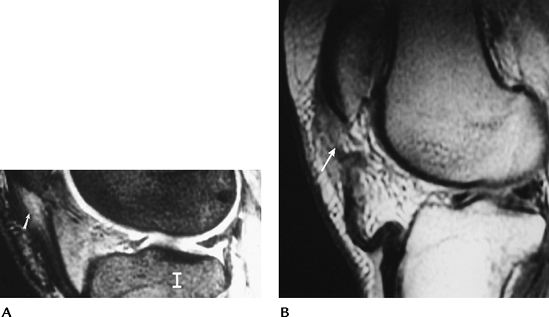
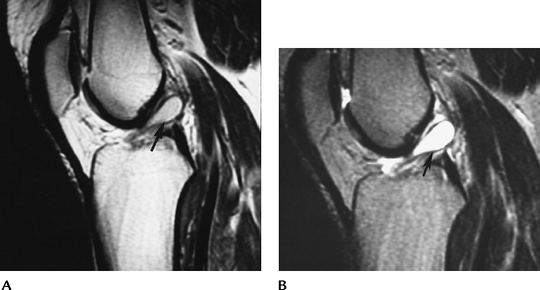
FIGURE 5-27 Meniscal cysts. (A) Small posteromedial meniscal cyst (arrow) seen on a sagittal T2-weighted image. The meniscal tear is not well seen on this sequence. (B) Coronal T2-weighted image demonstrating a large septated meniscal cyst (arrow).
|
Suggested Reading
Burk DL, Dalinka MK, Kanal E, et al. Meniscal and ganglion cysts of the knee. MR evaluation. AJR Am J Roentgenol 1988;150:331–336.
Campbell SE, Sanders TG, Morrison WB. MR imaging of meniscal cysts: Incidence, location, and clinical significance. AJR Am J Roentgenol 2001;177:409–413.
P.242
Meniscal Lesions: Discoid Menisci
Key Facts
-
Discoid menisci are reported in 1.5% to 15.5% of lateral and 0.1% to 0.3% of medial menisci.
-
Discoid menisci are broad and disk shaped
and more prone to meniscal tears. Meniscal tears are more difficult to
evaluate with discoid menisci because of degeneration and the high
incidence of multiple tears. -
The transverse diameter of a normal
meniscus is 10 to 11 mm. A discoid meniscus projects farther into the
joint and therefore appears larger on coronal and sagittal MR images
(visible on three or more 4-mm-thick sagittal images).
P.243
 |
|
FIGURE 5-28
Discoid meniscus. Sagittal proton density-weighted images using 4-mm–thick sections demonstrate meniscus on four contiguous images (A–D). Coronal image (E) shows the meniscus extending into the joint (arrow) near the tibial spine. |
P.244
Suggested Reading
Ryu KN, Kim IS, Kun EJ, et al. MR imaging of tears of discoid menisci. AJR Am J Roentgenol 1998;171:963–967.
P.245
Ligament and Tendon Injuries: Basic Concepts
Key Facts
-
Complete evaluation of the ligaments,
tendons, and capsule is difficult with conventional techniques,
including CT and arthrography. -
MRI offers the ability to evaluate all supporting structures of the knee.
-
Key anatomic structures for image evaluation include
-
Anterior cruciate ligament (ACL): oblique
course with anteromedial and posterolateral bands. Extends from the
lateral femoral condyle to the tibial plateau. -
Posterior cruciate ligament (PCL):
thicker than ACL. Extends from medial femoral condyle to posterior
intercondylar region of the tibia. -
Medial collateral ligament (MCL): three
layers. The first layer is composed of fascia covering the quadriceps,
the second layer includes the MCL, and the third layer is the capsular
ligament. The MCL extends from the medial femoral condyle to attach on
the tibia approximately 5 cm below the joint line. -
Lateral collateral ligament (LCL): extends from lateral femoral condyle to the fibular head. Separate from capsule.
-
Quadriceps tendon: formed by four muscles of quadriceps group, resulting in layers until it attaches to the patella.
-
Patellar tendon: extends from the patella to the tibial tuberosity.
-
Popliteus tendon: extends from the
lateral femoral condyle passing between the lateral meniscus and
capsule to join the muscle origin on the posterior tibia.
-
P.246
P.247
 |
|
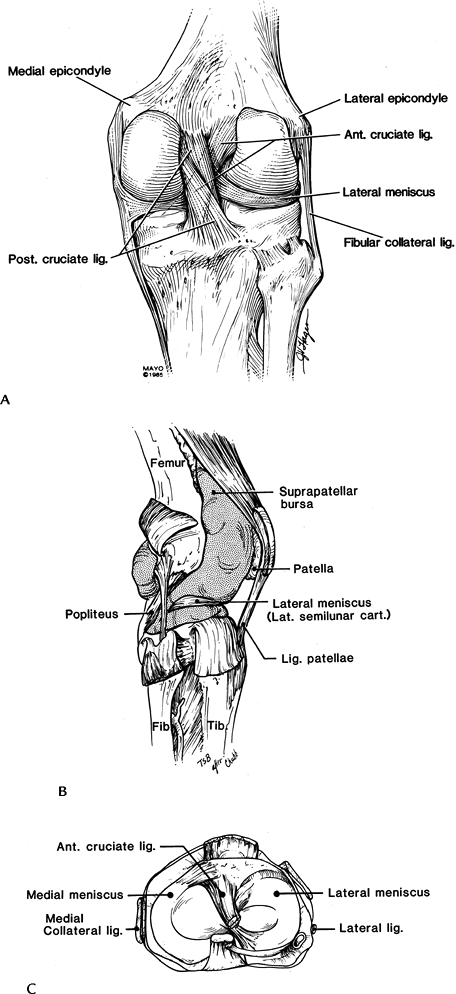
FIGURE 5-29 Ligament and tendon anatomy of the knee seen from posterior (A), lateral (B), and axial (C) planes.
|
Suggested Reading
Berquist TH. MRI of the musculoskeletal system. 5th ed. Philadelphia: Lippincott Williams & Wilkins; 2006:303–429.
P.248
Ligament and Tendon Injuries: Anterior Cruciate Ligament—Acute (Primary Features)
Key Facts
-
ACL is the most frequently injured ligament.
-
Up to 70% have associated injuries of the
meniscus (usually posteromedial) and MCL (O’Donoghue’s triad: ACL tear,
MCL tear, medial meniscal tear). -
Patients usually describe a twisting injury and a loud pop, and they are unable to bear weight on the injured knee.
-
MRI is the most effective imaging
technique for evaluating the cruciate ligaments and associated
injuries. T2-weighted sequences are most useful. Sagittal, coronal, and
axial images should all be evaluated. -
Primary features of acute ACL tears:
-
Acute—complete tear
-
Discontinuity with increased signal intensity between segments or at tibial or femoral attachment
-
Flat or horizontal distal segment with high-signal intensity near femoral attachment
-
Complete absence of ligament with high-signal intensity in the midjoint space
-
Wavy ligament
-
Acute—incomplete tear
-
Increased signal intensity (T2-weighted sequence) with thickening and normal course
-
-
P.249
 |
|
FIGURE 5-30 (A) Sagittal proton density-weighted image demonstrating the normal low-signal intensity of the ACL (arrows). (B) Acute ACL tear. Sagittal proton density-weighted image demonstrates an ACL tear (arrow). There is a joint effusion (open arrow) that is almost always present with an acute injury. Coronal fast spin-echo T2-weighted image (C) shows no visualized ACL (arrow), marrow edema in the lateral femoral condyle and tibia, and high-signal intensity along the MCL (arrow) caused by ligament sprain.
|
Suggested Reading
Barry KP, Mesgarzadeh M, Triolo J, et al. Accuracy of MRI patterns in evaluating anterior cruciate ligament tears. Skel Radiol 1996;25:365–370.
Tung GA, Davis LM, Wiggins ME, et al. Tears of the anterior cruciate ligament: Primary and secondary signs at MR imaging. Radiology 1993;188:661–667.
P.250
Ligament and Tendon Injuries: Anterior Cruciate Ligament—Acute (Secondary Features)
Key Facts
-
Numerous secondary signs have been described to improve accuracy and fully evaluate ACL injuries:
-
Joint effusion
-
Angulation of PCL—acute angle in upper PCL forming “?”
-
Abnormal PCL angle—normal 113 to 114 degrees; less than 105 degrees 86% specific for ACL tear
-
Anterior subluxation
-
Bone bruise—lateral compartment 97% specific
-
Second fractures (Fig. 5-13)
-
Deep femoral notch (>1.5 mm)
-
MCL tear
-
Meniscal tears
-
P.251
 |
|
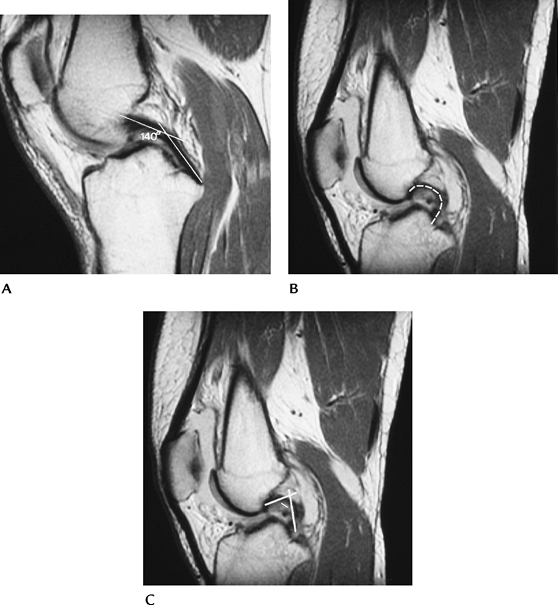
FIGURE 5-31 (A) Normal PCL with an angle (lines) of 140 degrees. Normal greater than 113 to 114 degrees. (B) ACL tear with hooked PCL (broken line). (C) ACL tear with hooked PCL and angle (lines) of less than 90 degrees.
|
P.252
 |
|
FIGURE 5-32 Sagittal T2-weighted (A) and axial fat-suppressed fast spin-echo T2-weighted image (B) of a lateral compartment bone bruise (arrow) in a patient with an ACL tear.
|
Suggested Reading
Mccauley
TR, Moses M, Kier R, et al. MR diagnosis of tears of the anterior
cruciate ligament of the knee: Importance of ancillary findings. AJR Am J Roentgenol 1994;162:115–119.
TR, Moses M, Kier R, et al. MR diagnosis of tears of the anterior
cruciate ligament of the knee: Importance of ancillary findings. AJR Am J Roentgenol 1994;162:115–119.
P.253
Ligament and Tendon Injuries: Anterior Cruciate Ligament—Chronic Tears
Key Facts
-
Chronic ACL injuries usually are partial tears, or overlooked or untreated tears.
-
Patients present with instability. A
small joint effusion may be present when symptoms are active. Large
effusions seen with acute tears are unusual. -
MR image features include
-
Small or no joint effusion
-
Ligament laxity, thickening, and intermediate signal intensity on T2-weighted images
-
Ligament atrophy
-
 |
|
FIGURE 5-33 Old partial ACL tear with intermediate signal intensity and horizontal distal remnant (arrow). There is no joint effusion.
|
 |
|
FIGURE 5-34
Sagittal T1-weighted images with thickening and intermediate signal intensity in the region of the ACL but no visible fibers. There is no joint effusion, and the femur is shifted posteriorly on the tibia. |
P.254
Suggested Reading
Umans
H, Winpfheimer O, Havamati N, et al. Diagnosis of partial tears of the
anterior cruciate ligament of the knee. Value of MR imaging. AJR Am J Roentgenol 1995;165:893–897.
H, Winpfheimer O, Havamati N, et al. Diagnosis of partial tears of the
anterior cruciate ligament of the knee. Value of MR imaging. AJR Am J Roentgenol 1995;165:893–897.
P.255
Ligament and Tendon Injuries: Posterior Cruciate Ligament
Key Facts
-
PCL is thicker and more easily included on a single sagittal section.
-
Most PCL tears involve the midsubstance; 19% are proximal, and the remainder are distal.
-
PCL tears are less common than ACL tears. Both ligaments may be torn simultaneously.
-
MR features of PCL tears are the same as described for ACL tears.
 |
|
FIGURE 5-35 Sagittal proton density-weighted image demonstrating a normal PCL.
|
 |
|
FIGURE 5-36 PCL tear. Sagittal proton-density (A) and T2-weighted (B) images demonstrate thickening and increased signal intensity in the PCL with avulsion from the tibial attachment (arrow).
|
P.256
Suggested Reading
Uppal
A, Disler DG, Short WB, et al. Internal derangements of the knee: Rates
of occurrence at MR imaging in patients referred to orthopedic surgeons
compared with rates in patients referred by physicians who are not
orthopedic surgeons. Radiology 1998;207:633–636.
A, Disler DG, Short WB, et al. Internal derangements of the knee: Rates
of occurrence at MR imaging in patients referred to orthopedic surgeons
compared with rates in patients referred by physicians who are not
orthopedic surgeons. Radiology 1998;207:633–636.
P.257
Ligament and Tendon Injuries: Medial And Lateral Collateral Ligaments
Key Facts
-
MCL injuries are far more common than LCL
injuries. MCL injuries usually are the result of valgus stress, whereas
lateral injuries are the result of varus stress or internal torsion
injuries. -
MCL injuries commonly are associated with capsular and meniscal injury. Tears of the ACL are evident in 30%.
-
O’Donoghue’s triad (ACL, MCL, and meniscal tears) is a common injury pattern.
-
Associated bone bruises are common.
-
MR imaging using conventional or fast
spin-echo T2- or T2-weighted images in the axial and coronal planes
allows detection and classification of collateral ligament injuries. -
Image features are similar to those described for ACL tears.
P.258
 |
|
FIGURE 5-37 (A) Coronal MR image of a normal low signal intensity MCL (arrows). T2 gradient-recalled echo images of a high-grade (B) and complete MCL tear (C). Note the wavy, lax appearance of the ligament (arrows) in (C).
|
Suggested Reading
Yao L, Dungan D, Seeger LC. MR Imaging of tibial collateral ligament injury. Comparison with clinical examination. Skel Radiol 1994;23:521–524.
P.259
Ligament and Tendon Injuries: Quadriceps Tendon
Key Facts
-
The quadriceps tendon is formed by slips
of four muscles (rectus femoris, vastus lateralis, intermedius, and
medialis), resulting in a layered appearance on axial and sagittal MR
images. -
Quadriceps rupture may be the result of acute or repetitive trauma.
-
Quadriceps tears are more common in
elderly patients with rheumatoid arthritis, systemic lupus
erythematosus, or metabolic disease. -
Most tears occur just above the patella.
-
MR images in the sagittal and axial
planes using T2-weighted sequences show thickening and increased signal
intensity for partial tears and separation with fluid (increased
signal) between segments with complete tears. The patella may be
inferiorly displaced. -
Ultrasound also may be used to evaluate the quadriceps tendon.
 |
|
FIGURE 5-38 Coronal (A) and sagittal (B) fast spin-echo T2-weighted images with fat suppression demonstrate a complete quadriceps tear at the patellar attachment (arrows).
|
Suggested Reading
Yu JS, Petersilge C, Sartoris DJ, et al. MR imaging of injuries of the extensor mechanism. Radiographics 1994;14:541–551
Staeubli
HU, Bollmann C, Kreutz R, et al. Quantification of intact quadriceps
tendon, quadriceps tendon insertion and suprapatellar fat pad: MR
arthrography, anatomy, and cryosection in the sagittal plane. AJR Am J Roentgenol 1999;173:691–698.
HU, Bollmann C, Kreutz R, et al. Quantification of intact quadriceps
tendon, quadriceps tendon insertion and suprapatellar fat pad: MR
arthrography, anatomy, and cryosection in the sagittal plane. AJR Am J Roentgenol 1999;173:691–698.
P.260
Ligament and Tendon Injuries: Patellar Tendon
Key Facts
-
Patellar tendon injuries include tendinitis, tendinosis, tendon tears, and chronic overuse syndromes.
-
Patellar tendon tears may be partial or complete. Signal intensity changes on MR images are similar to those for ACL tears.
-
Jumper’s knee—tendinosis caused by
repetitive microtrauma in athletes involved in running and jumping
sports. There is increased risk for tendon rupture. -
Imaging of patellar tendon abnormalities
is accomplished most easily with conventional or fast spin-echo
T2-weighted images in the axial and sagittal planes. -
Ultrasound also may be used to evaluate the patellar tendon.
 |
|
FIGURE 5-39 Sagittal proton density-weighted image of a normal patellar tendon.
|
P.261
 |
|
FIGURE 5-40 Patellar tendon disorders. (A) Sagittal T2-weighted image shows thickening and increased signal intensity at the patellar attachment (arrow) resulting from “Jumper’s knee.” (B) Sagittal T1-weighted image demonstrating a complete tear of the tendon (arrow) with a wavy appearance distally.
|
Suggested Reading
Yu JS, Petersilge C, Sortores DJ, et al. MR imaging of injuries of the extensor mechanism. Radiographics 1994;14:541–551.
P.262
Ligament and Tendon Reconstruction
Key Facts
-
Ligament and tendon reconstruction can be accomplished using tendon grafts, allografts, or synthetic materials.
-
Routine radiographs and MRI are important to evaluate results and potential complications.
-
Complications include
-
Improper tunnel position
-
Hardware failure
-
Bone plug fracture
-
Patellar fracture (stress riser from donor site)
-
Graft (tendon) failure
-
Graft impingement
-
Anterior arthrofibrosis (cyclops lesion)
-
Postoperative infection
-
-
Routine radiographs should include AP,
patellar, notch, and cross-table lateral views. The latter is obtained
with the knee extended to evaluate graft impingement. -
MR images are obtained using routine knee
protocols, except sagittal images should be obtained with the knee
extended to evaluate for impingement.
P.263
 |
|
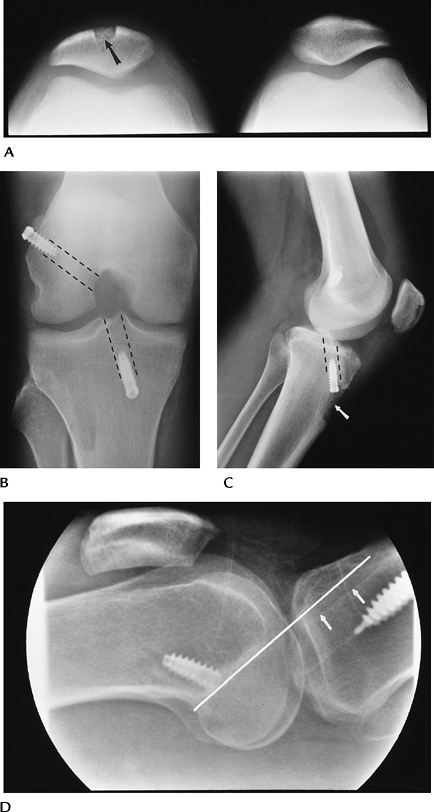
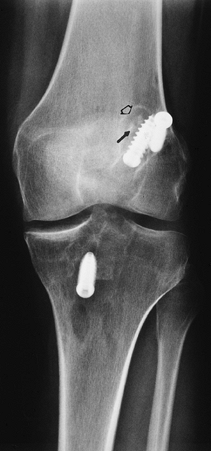
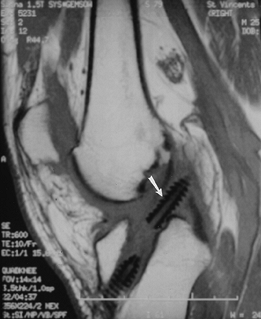
FIGURE 5-41 ACL repair with patellar tendon graft. (A) Patellar view showing bone donor site (arrow). (B) Notch view showing interference screws fixing the bone plugs. Graft tunnel positions (broken lines). (C) Lateral view demonstrating the tibial tunnel (broken lines) and tuberosity donor sight (arrow). (D) Cross-table lateral with extension showing the tibial tunnel (arrows) in proper position posterior to intercondylar roof (white line).
|
P.264
 |
|
FIGURE 5-42 AP radiograph after ACL and MCL repairs. Staples fix the ends of the tendon grafts.
|
P.265
 |
|
FIGURE 5-43 AP radiograph after ACL repair with fracture of the bone plug (arrow) and lucency about the screws (open arrow) caused by loosening.
|
 |
|
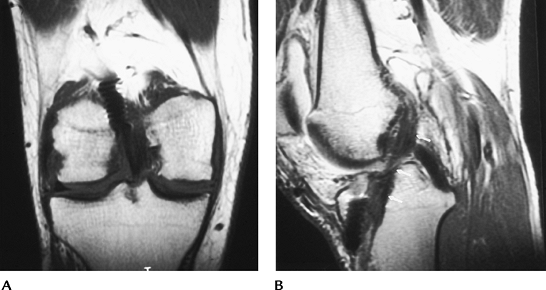
FIGURE 5-44 Coronal (A) and sagittal (B) MR images of an intact tendon graft. Note normal low signal intensity of the tendon (arrows in B). There is some artifact from the screws.
|
P.266
 |
|
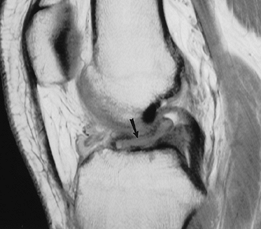
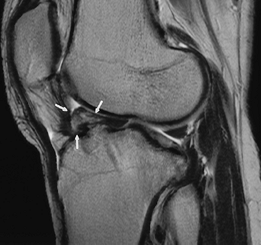
FIGURE 5-45 Sagittal T2-weighted image demonstrating a large “cyclops” lesion (arrows) in the anterior fat.
|
 |
|
FIGURE 5-46 Sagittal T1-weighted image after ACL repair showing displacement of the interference screw (arrow) into the joint.
|
Suggested Reading
Tomzak
RT, Hebl G, Mergo PJ, et al. Tunnel placement in anterior cruciate
ligament reconstruction: MR analysis as an important factor in the
radiological report. Skel Radiol 1997;26:409–413.
RT, Hebl G, Mergo PJ, et al. Tunnel placement in anterior cruciate
ligament reconstruction: MR analysis as an important factor in the
radiological report. Skel Radiol 1997;26:409–413.
White LM, Kramer J, Recht MP. MR imaging evaluation of the postoperative knee: Ligaments, menisci, and articular cartilage. Skel Radiol 2005;34:431–452.
P.267
Plicae
Key Facts
-
Plicae are embryonic synovial remnants that may be present in asymptomatic knees.
-
Plicae are noted in approximately 20% of patients.
-
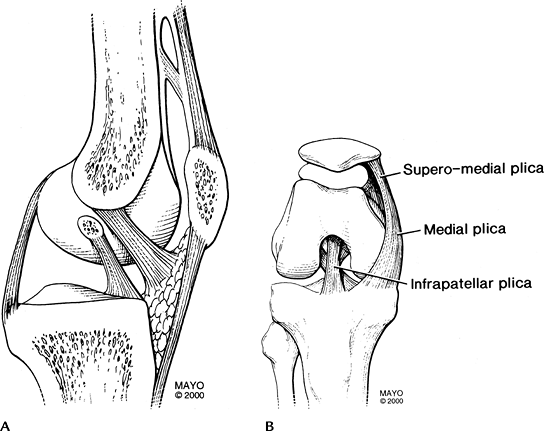
The three most common plicae are suprapatellar, mediopatellar, and infrapatellar.
-
Suprapatellar plica—remnant separating suprapatellar bursa from medial and lateral compartments
-
Mediopatellar plica—extends from above
the patella to insert on the synovium of the infrapatellar fat pad.
This plica is most often symptomatic. -
Infrapatellar plica—courses along the upper margin of the ACL
-
-
Chronic inflammation causes thickening of the plicae, which results in pain and snapping.
-
Similar symptoms may be found with loose bodies, patellar tracking disorders, meniscal tears, and jumper’s knee.
-
Plicae are evaluated most easily on axial and sagittal T2-weighted MR images.
 |
|
FIGURE 5-47 Plicae of the knee in the sagittal (A) and frontal plane with the knee flexed (B).
|
P.268
 |
|
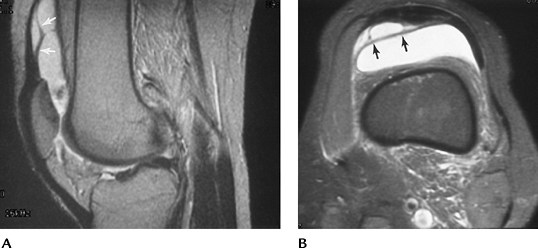
FIGURE 5-48 Sagittal (A) and axial (B) T2-weighted images of a complex, thickened suprapatellar plica (arrows).
|
Suggested Reading
Johnson DP, Eastwood DM, Witherow PJ. Symptomatic synovial plicae of the knee. J Bone Joint Surg 1993;75A:1485–1495.
P.269
Patellar Disorders: Patellofemoral Relationships
Key Facts
-
Patellar configuration and articular
relationship to the femoral condyles are important when evaluating
tracking disorders and patellofemoral pain syndromes. -
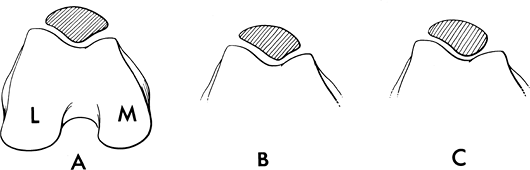
Patellar configurations were described by
Wiberg: Type I, medial and lateral facets are equal; Type II, lateral
facet larger than medial (most common); Type III, small medial facet
and hypoplastic medial femoral condyle. -
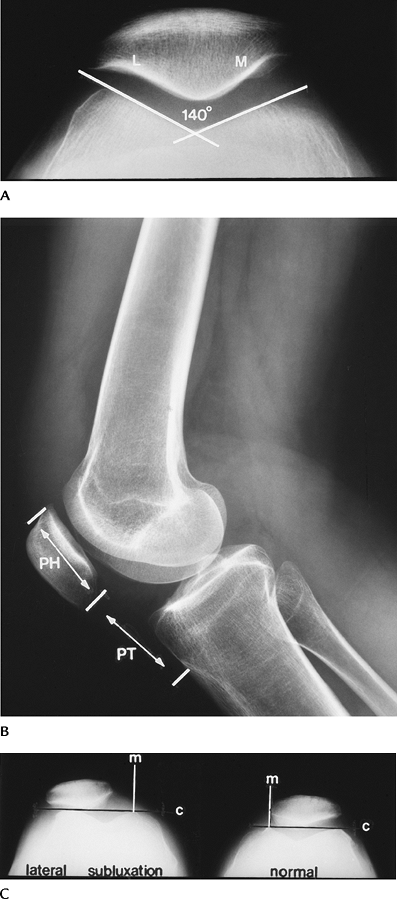
On a lateral radiograph taken with 30
degrees of flexion, the ratio of patellar tendon length to patellar
height should be 1.02 ± 0.13. -
On patellar views or axial MR images, the
sulcus angle formed by lines along the femoral condyle should be 138 to
142 degrees. An increased angle is seen with dysplasias and leads to
subluxation. -
The patella normally should be at or just
medial to the medial articular margin line, which is drawn
perpendicular to a line along the condylar margins.
 |
|
FIGURE 5-49 Wiberg patellar configurations. (A) Medial and lateral facets equal in size: Type I. (B) Lateral facet larger than medial: Type II. (C) Small medial facet with dysplastic condyle: Type III.
|
P.270
P.271
 |
|
FIGURE 5-50 Normal radiographic relationships. (A) Sulcus angle formed by lines along the femoral condyles is normally 138 to 142 degrees. (B)
Lateral radiograph with the knee flexed 30 degrees. The patellar tendon (PT) length over the patellar height (PH) = 1.02 ± 0.13. (C) The medial patellar edge should be at or just medial to a line (M) perpendicular to a line (C) along the condylar margins. |
Suggested Reading
Laurin CA, Dussault R, Levesquelt P. The tangential x-ray investigation of the patellofemoral joint. Clin Orthop 1979;144:16–26.
P.272
Patellar Disorders: Patellar Tracking And Instability
Key Facts
-
Position of the patella in relation to
the condyles of the femur varies with position, so flexion and
extension studies are required. -
Conditions include
-
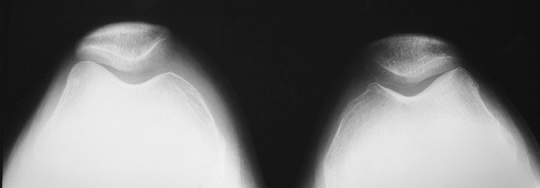
Lateral subluxation—lateral translation of the patella so the facet extends beyond the articular margin of the condyles
-
Excessive lateral pressure syndrome—lateral facet joint narrowed or patella tilted without subluxation
-
Medial subluxation—medial translation of the patella so the facet extends beyond the medial condyle
-
Lateral-medial subluxation—patella starts in lateral subluxation and shifts to medial during knee flexion
-
Dislocation—complete loss of articular interfaces
-
-
Imaging can be accomplished with axial
patellar radiographs in differing degrees of flexion or using fast CT
or MR techniques to image the patellofemoral relationships through
flexion and extension.
 |
|
FIGURE 5-51 Patellar views of both knees showing lateral tilt without subluxation because of lateral pressure syndrome.
|
P.273
 |
|
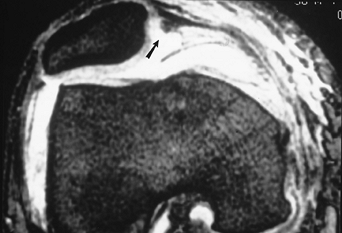
FIGURE 5-52 Axial gradient echo image demonstrating lateral subluxation and a tear (arrow) of the medial retinaculum.
|
 |
|
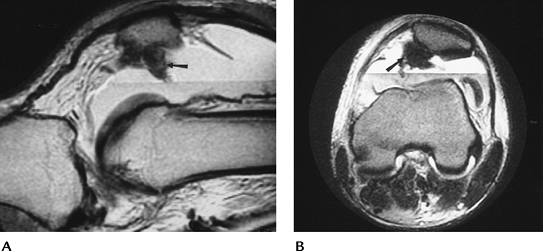
FIGURE 5-53 Sagittal (A) and axial (B)
T2-weighted MR images after patellar dislocation with fluid–fluid levels, retinacular tear, and shaving of the patellar articular cartilage (arrow). |
Suggested Reading
Kirsh MD, Fitzgerald SW, Friedman H, et al. Transient lateral-patellar dislocation: Diagnosis with MR imaging. AJR Am J Roentgenol 1993;161:109–113.
P.274
Patellar Disorders: Chondromalacia Patella
Key Facts
-
Patellar articular damage may result from subluxation, fracture, or repetitive microtrauma.
-
Chondromalacia affects older men and
younger females more often than young males. It more often involves the
lateral facet and mid- and lower patella. -
MRI with or without gadolinium provides a method to more accurately image articular changes in the patella.
-
MRI features correlate with arthroscopic findings in chondromalacia (Table 5-2).
-
Routine radiographs are normal until
changes in bone occur in late stages of chondromalacia. MR images in
the axial and sagittal planes are most useful. Numerous pulse sequences
have been used to study articular cartilage. We prefer a fat-suppressed
proton density-weighted fast spin echo or double-echo steady state
sequences.
|
TABLE 5-2 ARTHROSCOPIC AND MAGNETIC RESONANCE CLASSIFICATION OF CHONDROMALACIA PATELLAE
|
||||||||||||
|---|---|---|---|---|---|---|---|---|---|---|---|---|
|
||||||||||||
P.275
 |
|
FIGURE 5-54 Normal articular cartilage (arrows) seen on T1- (A) and proton density fat-suppressed (B) images. (C) Fat-suppressed fast spin-echo image shows a full-thickness defect (Stage 4, arrow) and increased signal intensity and irregularity (open arrow) caused by chondromalacia.
|
Suggested Reading
Rose PM, Demlow TA, Szumowski J, et al. Chondromalacia patellae: Fat-suppressed MR imaging. Radiology 1994;193:437–440.
P.276
Loose Bodies
Key Facts
-
Loose bodies may develop in patients
after fracture or meniscal tears, or in patients with
osteochondromatosis, synovial chondromatosis, or osteochondritis
dissecans. -
Loose bodies may be osseous, cartilaginous, fibrous, or a combination, depending on the etiology.
-
Calcified or ossified bodies can be
identified on routine radiographs. Fibrous or cartilaginous lesions
require MRI, arthrography, or arthroscopy for detection. -
Technically, a loose body should move in the joint and not be attached to an intra-articular structure.
-
In the knee, loose bodies are located
most commonly in the intercondylar region, near the tibial attachment
of the ACL or posteriorly above and below the joint line.
P.277
 |
|
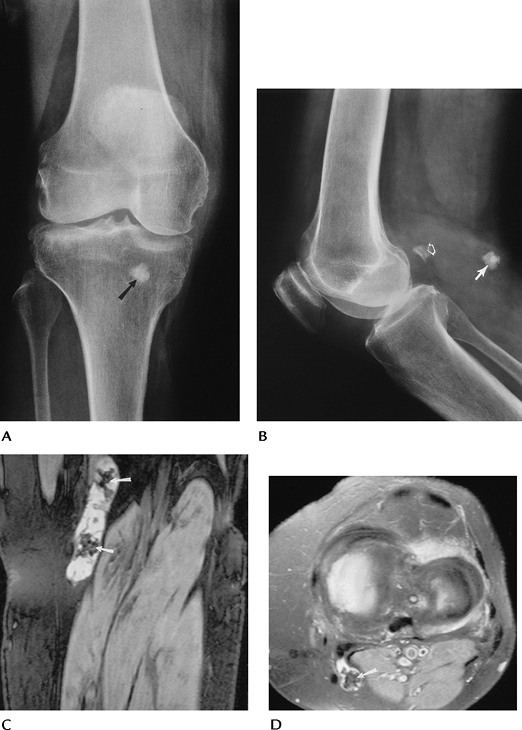
FIGURE 5-55 AP (A) and lateral (B) radiographs of an ossified loose body posteriorly (arrow). Note the normal fabella (open arrow), which should not be confused with a loose body. Coronal double-echo steady state (C) and fat-suppressed proton density axial (D) images demonstrate loose bodies (arrows) in a popliteal cyst.
|
Suggested Reading
Brossmann
J, Preidler KW, Daener B, et al. Imaging of osseous and cartilaginous
intra-articular bodies of the knee: Comparison with MR imaging, and MR
arthrography with CT and CT arthrography in cadavers. Radiology 1996;200:509–517.
J, Preidler KW, Daener B, et al. Imaging of osseous and cartilaginous
intra-articular bodies of the knee: Comparison with MR imaging, and MR
arthrography with CT and CT arthrography in cadavers. Radiology 1996;200:509–517.
P.278
Osteochondritis Dissecans
Key Facts
-
Osteochondritis dissecans is a disease of teenagers. Average age of onset usually is 15 years. Males outnumber females 3:1.
-
Lesions in the knee most often involve
the lateral aspect of the medial femoral condyle, but other regions,
such as the patella, also may be involved. The condition is bilateral
in 25%. -
Cause is repetitive trauma and/or ischemia.
-
Detection of osteochondritis dissecans
generally is possible with routine radiographs. The notch view is
particularly useful for femoral condyle lesions. Appropriate
classification of lesions requires conventional or CT arthrography,
MRI, or MR arthrography (Table 5-3). -
T2-weighted MR images are 97% sensitive and 100% specific. A high–signal intensity line around the lesion indicates instability.
-
Unstable lesions may require surgical or
arthroscopic treatment. Stable or minimally symptomatic lesions are
treated conservatively.
|
TABLE 5-3 OSTEOCHONDRITIS DISSECANS
|
||||||||||||||||||||||||
|---|---|---|---|---|---|---|---|---|---|---|---|---|---|---|---|---|---|---|---|---|---|---|---|---|
|
||||||||||||||||||||||||
P.279
 |
|
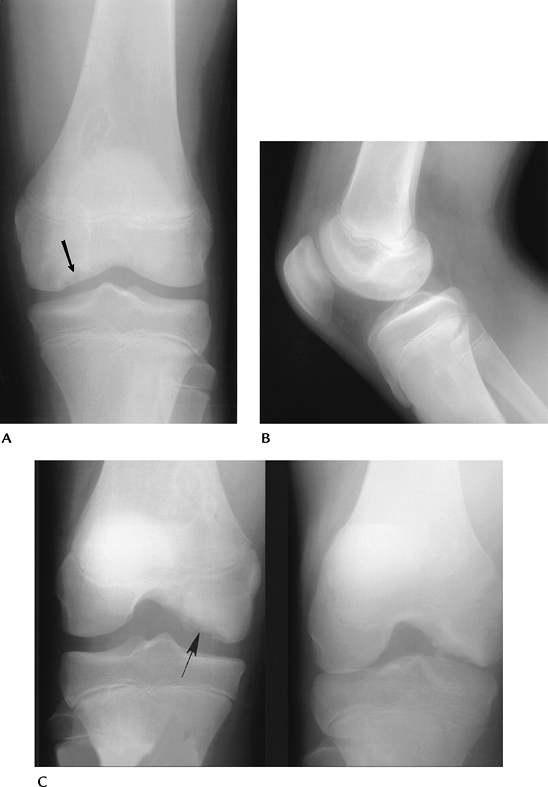
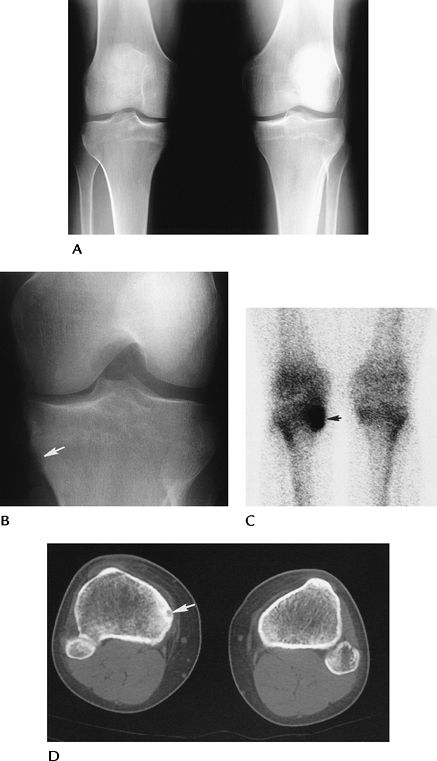
FIGURE 5-56 AP (A), lateral (B), and notch views (C) demonstrating characteristic appearance and location of osteochondritis dissecans (arrow). Note the lesion is most easily appreciated on the notch view.
|
P.280
 |
|
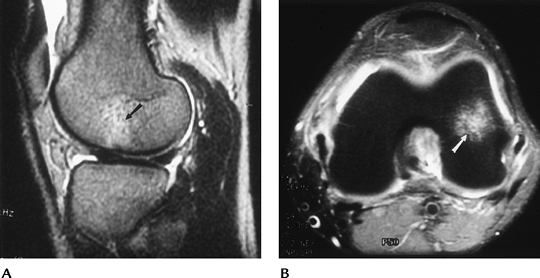
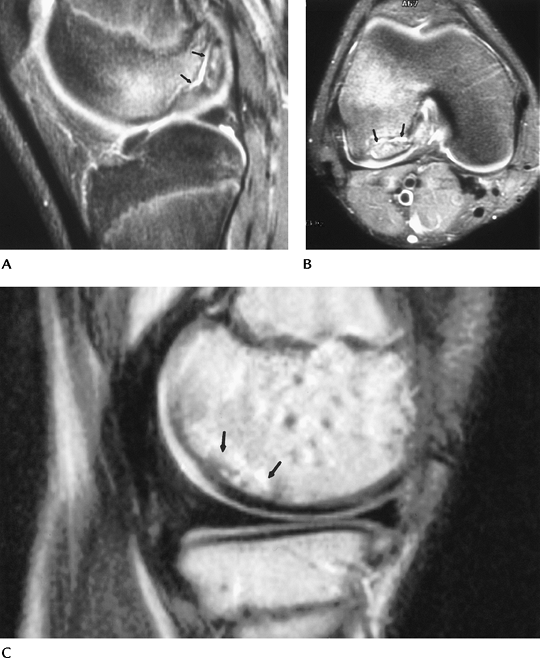
FIGURE 5-57
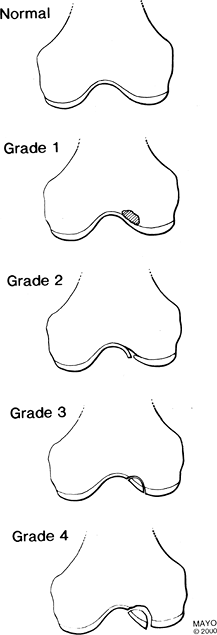
MR features of osteochondritis dissecans. Grade 1 = abnormal signal intensity, Grade 2 = linear defect in the cartilage, Grade 3 = abnormal signal intensity (↑ T2, ↓ T1-weighted image) around the fragment, Grade 4 = fragment has abnormal signal intensity surrounding it, and it may be loose. |
P.281
 |
|
FIGURE 5-58 MR images of osteochondritis dissecans in two different patients. T2-weighted sagittal (A) and axial (B) images showing a large defect with high-intensity fluid (arrows) separating the fragment from the condyle. This is an unstable lesion. (C) Sagittal T2-weighted image in a different patient showing abnormal signal intensity (arrows), no fluid line around the lesion, and intact cartilage. This is a stable lesion.
|
Suggested Reading
Aicroth P. Osteochondritis dissecans of the knee: A clinical survey. J Bone Joint Surg 1971;53B:440–447.
DeSmet AA, Ilahi O, Graf BK. Reassessment of MR criteria for osteochondritis dissecans of the knee and ankle. Skel Radiol 1996;25:159–163.
P.282
Osteonecrosis
Key Facts
-
Osteonecrosis (bone death) in the knee
may involve the epiphysis (avascular necrosis) or diaphysis and
metaphysis (bone infarct). -
Most cases are the result of systemic diseases, bone marrow disorders, or steroid therapy.
-
Spontaneous osteonecrosis of the knee is
a condition affecting the weight-bearing surface of the femoral condyle
(usually medial) that occurs in elderly or middle-aged patients,
especially women. -
Features of spontaneous osteonecrosis:
-
Pain, tenderness
-
Involves weight-bearing surface, unlike osteochondritis dissecans
-
Cause is likely related to subchondral insufficiency fracture
-
Leads to degenerative arthritis, loose bodies
-
-
Image features
-
Radiographs: osteonecrosis—subchondral sclerosis, fracture, articular collapse; infarction—peripheral calcification
-
Radionuclide scans: increased tracer
-
MRI: osteonecrosis—geographic zone of
demarcation, bone marrow edema, articular collapse;
infarction—serpiginous zone demarcating the margins of infarction
-
 |
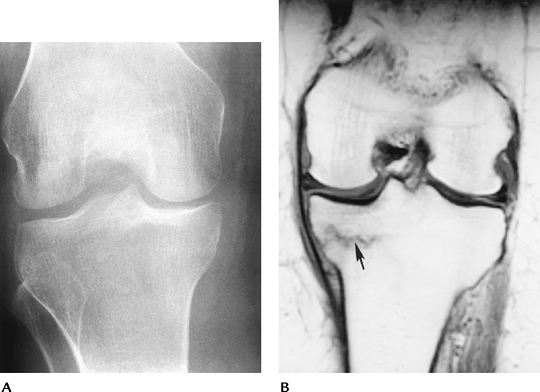
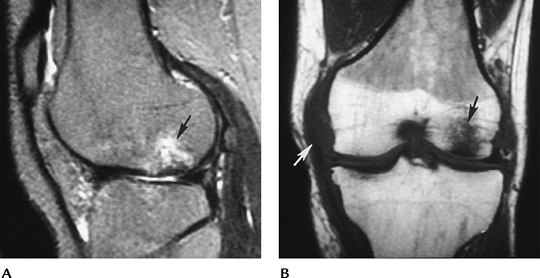
|
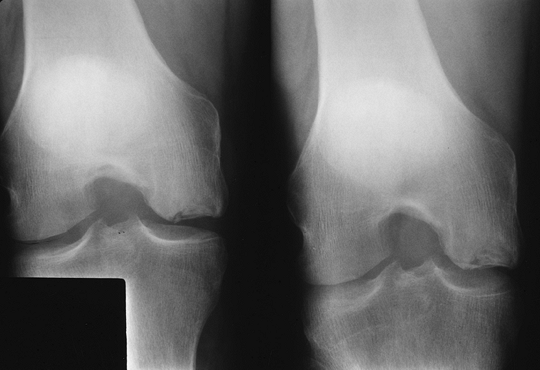
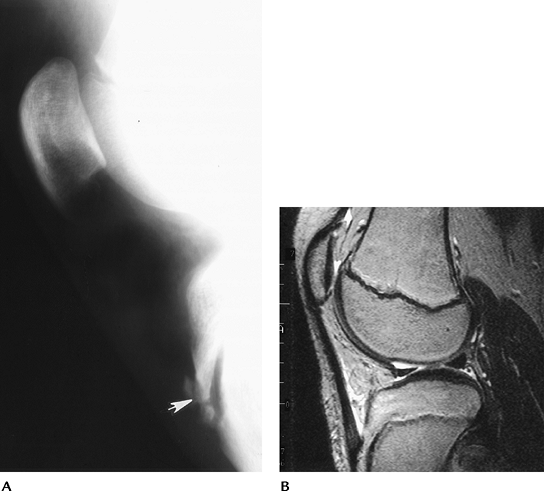
FIGURE 5-59
Spontaneous osteonecrosis. Notch view of the knee demonstrating subchondral fracture and collapse of the medial femoral condyle. |
P.283
 |
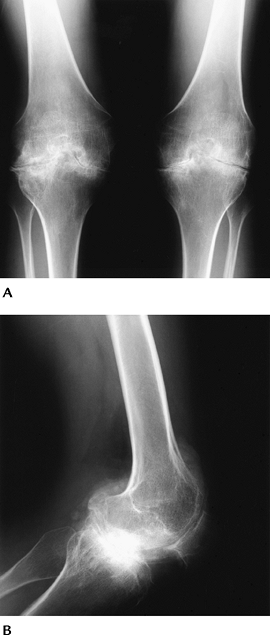
|
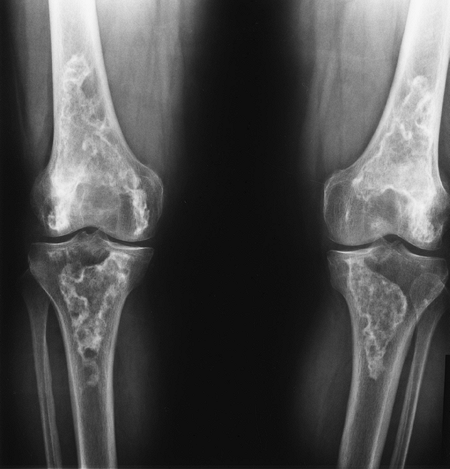
FIGURE 5-60 Standing views of the knees demonstrating bilateral bone infarcts with dense ossification or calcification along the margins.
|
P.284
 |
|
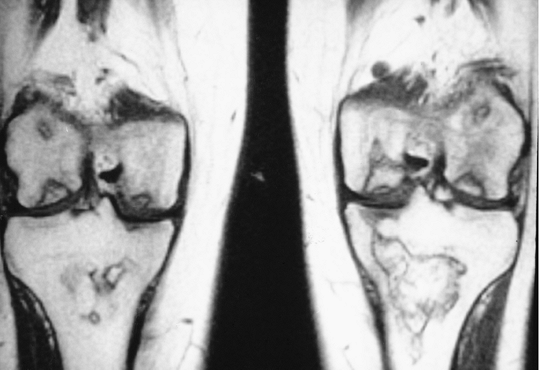
FIGURE 5-61 Coronal T1-weighted images of the knees with avascular necrosis in both femoral condyles and tibial and femoral bone infarcts.
|
Suggested Reading
Yamamoto T, Bullough PG. Spontaneous osteonecrosis of the knee: The result of subchondral insufficiency fracture. J Bone Joint Surg 2000;82A:858–869.
P.285
Osteochondroses
Key Facts
-
Osteochondroses include a variety of disorders involving epiphyseal or apophyseal centers of the immature skeleton.
-
Osteochondroses about the knee include Osgood-Schlatter disease, Blount disease, and Sinding-Larsen-Johansson disease.
-
Osgood-Schlatter disease
-
Tibial tuberosity affected in 11- to 15-year-olds.
-
Males outnumber females 2:1; bilateral in 25%.
-
Patients present with local pain and swelling.
-
Radiographs show swelling and fragmentation of the tuberosity.
-
Diagnosis is clinical, and other imaging studies usually are not indicated.
-
-
Blount disease
-
Growth disturbance of the medial tibial epiphysis
-
Infantile—appears in first years after birth
-
Adolescent—appears at ages 8 to 15 years
-
Radiographs show fragmentation of the epiphysis, and deformity and depression of the metaphysis.
-
-
Sinding-Larsen-Johansson disease
-
Tenderness and swelling over lower patella
-
Appears in 10- to 14-year-olds.
-
Radiographs show fragmentation of the lower pole of the patella.
-
P.286
 |
|
FIGURE 5-62 Blount disease. AP radiographs of both knees (A,B) showing metaphyseal and epiphyseal deformities medially with genu varum deformities of the knees.
|
P.287
 |
|
FIGURE 5-63 Osgood-Schlatter disease. (A) Lateral radiograph demonstrates swelling and fragmentation (arrow) of the tibial tuberosity. (B)
Sagittal T2-weighted MR image in a different patient shows increased signal intensity and fluid along the tendon at the level of the tibial tuberosity. |
Suggested Reading
Craig JG, van Holsbeeck M, Zaltz I. The utility of MR in assessing Blount disease. Skel Radiol 2002;31:208–213.
Resnick D. Osteochondrosis. In: Resnick D, ed. Bone and joint imaging, 2nd ed. Philadelphia: WB Saunders; 1996:960–978.
P.288
Arthropathies
Key Facts
-
Numerous arthropathies can involve the
knee. The most common are primary osteoarthritis followed by calcium
pyrophosphate deposition disease. -
Arthropathies may involve one or all
compartments. Distribution and involvement of one or both knees are
useful for radiographic diagnosis. -
The condition and image features of common arthropathies of the knee are summarized as follows:
| Condition | Radiographic Features |
|---|---|
| Osteoarthritis | Primarily medial and patellofemoral involvement Joint space narrowing, osteophytes, increased bone density |
| CPPD | Joint space narrowing Bone sclerosis Chondrocalcinosis |
| Rheumatoid arthritis | Bilateral, symmetrical uniform joint space narrowing Osteopenia Marginal erosions Cystic changes |
| Psoriatic arthritis | Bilateral asymmetric involvement No osteopenia Bone proliferation |
| Reiter syndrome | Bilateral asymmetric No osteopenia Bone proliferation |
| Ankylosing spondylitis | Knee involvement uncommon Early erosions and bone sclerosis lead to ankylosis |
| Juvenile chronic arthritis | Unilateral with tricompartmental involvement Overgrowth of epiphysis and patella Looks similar to hemophilia |
| Hemophilia | Overgrowth of epiphysis and wide notch Square patella More cysts compared with juvenile chronic arthritis |
| Septic arthritis | Unilateral Aggressive weight-bearing cartilage loss |
| Pigmented villonodular synovitis | Knee most common joint involved Joint space narrows early Cystic changes Increased soft tissue density or masslike structures about the joint Unilateral |
| CPPD, calcium pyrophosphate deposition disease. | |
P.289
 |
|
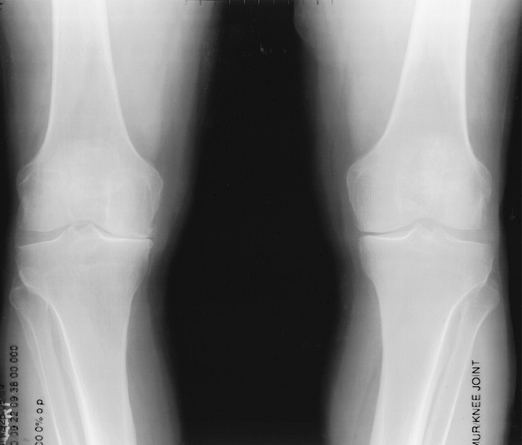
FIGURE 5-64 Standing views of the knee showing medial compartment narrowing, more evident on the right, caused by osteoarthritis.
|
P.290
 |
|
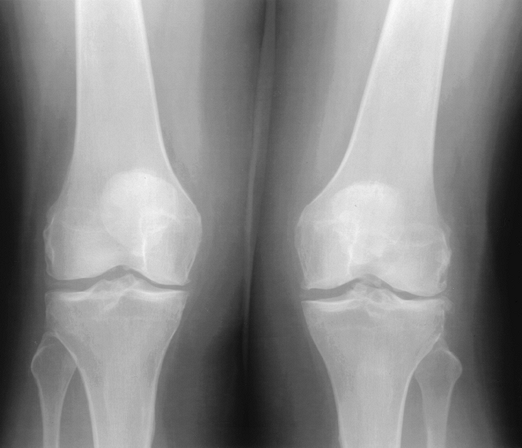
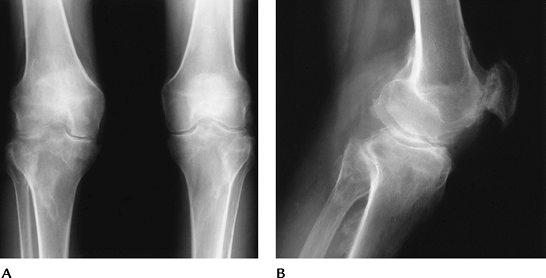
FIGURE 5-65
Calcium pyrophosphate deposition disease. Standing AP view of the knees showing cartilage calcification and degenerative joint changes. |
P.291
 |
|
FIGURE 5-66 Rheumatoid arthritis. AP (A) and lateral (B) radiographs demonstrate a joint effusion (arrowheads) with slight joint space narrowing. There are no erosions.
|
 |
|
FIGURE 5-67 Reiter syndrome. Standing AP (A) and lateral (B)
views of the knee demonstrating bilateral arthropathy with bone proliferation or whiskering at the ligament and tendon attachments. |
P.292
 |
|
FIGURE 5-68 Hemophilic arthropathy. Standing (A) and lateral (B) views showing loss of joint space, wide notches, osteopenia, epiphyseal deformity, and squaring of the patella.
|
P.293
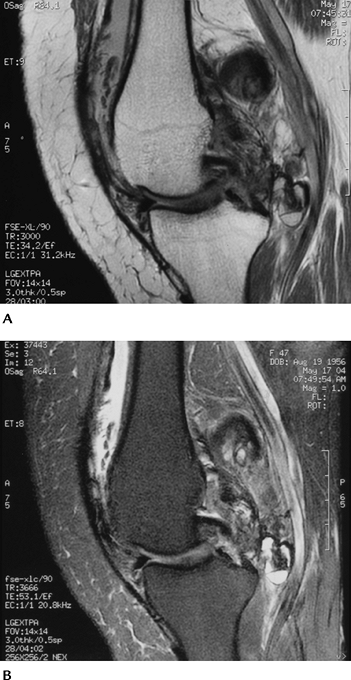 |
|
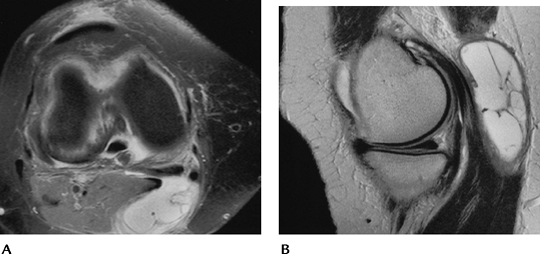
FIGURE 5-69 Pigmented villonodular synovitis. Sagittal proton density-weighted (A) and T2-weighted (B) images demonstrating extensive synovial proliferation with areas of low signal intensity caused by hemosiderin deposition.
|
Suggested Reading
Brower AC. Arthritis in black and white, 2nd ed. Philadelphia: WB Saunders; 1997.
P.294
Neoplasms: Bone Tumors And Tumorlike Conditions
Key Facts
-
Primary and metastatic neoplasms and other tumorlike conditions are common about the knee (Table 5-4).
-
Approximately 50% of osteosarcomas occur in the knee.
-
Sixty percent of Ewing sarcomas involve the knee or pelvis.
-
Thirty-two percent of chondroblastomas and more than 50% of giant cell tumors occur in the knee.
-
Patellar tumors are rare (0.06% of all tumors).
-
Skeletal lesions are characterized most
easily on routine radiographs. CT and MRI are useful for staging.
Radionuclide scans are useful for localizing subtle lesions.
|
TABLE 5-4 PRIMARY SKELETAL NEOPLASMS OF THE KNEE
|
||||||||||||||||||||||||||||||
|---|---|---|---|---|---|---|---|---|---|---|---|---|---|---|---|---|---|---|---|---|---|---|---|---|---|---|---|---|---|---|
|
||||||||||||||||||||||||||||||
P.295
 |
|
FIGURE 5-70 Osteoid osteoma. AP standing (A) and notch (B) views of the right knee showing a questionable tibial defect (arrow). (C) Radionuclide bone scan is positive (arrow) in this region. (D) CT image clearly defines the osteoid osteoma (arrow).
|
P.296
 |
|
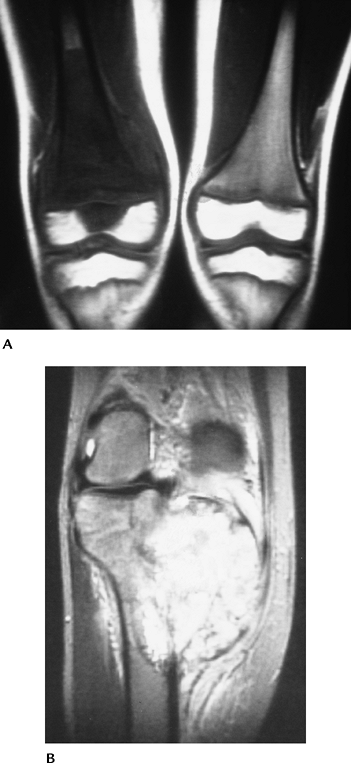
FIGURE 5-71 Osteosarcoma. (A)
Coronal T1-weighted image demonstrates low signal intensity tumor involving the distal femur and extending into the epiphysis on the right. (B) T2-weighted image in a different patient shows the extent of soft tissue involvement. |
P.297
Suggested Reading
Kransdorf M, Berquist TH. Musculoskeletal neoplasms. In: Berquist TH, ed. MRI of the musculoskeletal system, 5th ed. Philadelphia: Lippincott Williams & Wilkins; 2006:802–915.
Unni KK. Dahlin’s bone tumors: General aspects and data on 11,087 cases. Philadelphia: WB Saunders; 1996.
P.298
Neoplasms: Soft Tissue Tumors And Masses
Key Facts
-
Soft tissue masses about the knee may be
true neoplasms or cysts, such as popliteal cysts or ganglion cysts.
Ganglion cysts may also involve the cruciate ligaments and are likely
posttraumatic. -
Posterior soft tissue lesions are common
and include popliteal cysts, meniscal cysts, ganglion cysts, popliteal
varices, popliteal artery aneurysms, and hemangiomas. -
Popliteal cysts communicate with the joint and are seen in less than 5% of MRI studies.
-
MRI is the technique of choice for detection and characterization of soft tissue masses.
-
Benign: typically homogeneous. Increased
intensity on T2-weighted images and decreased intensity on T1-weighted
images. Well-defined margins. -
Malignant: typically inhomogeneous. Best
appreciated on T2-weighted images. Poorly defined margins. May encase
neurovascular structures.
-
 |
|
FIGURE 5-72 Popliteal cyst. Fat-suppressed fast spin-echo proton density axial (A) and sagittal (B) images show a well-defined septated high signal intensity popliteal cyst.
|
P.299
 |
|
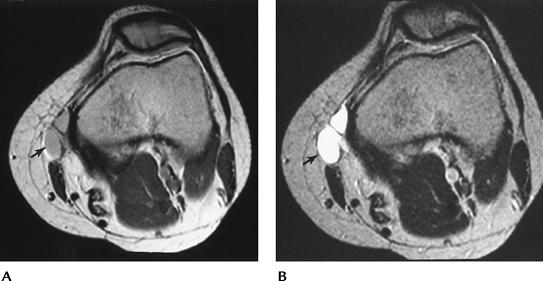
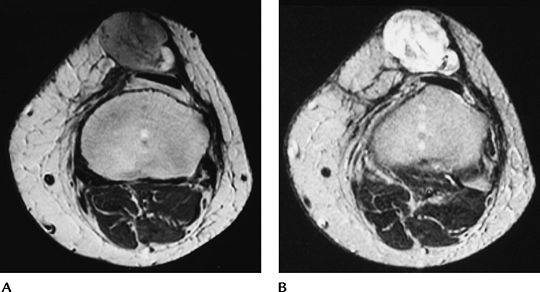
FIGURE 5-73 Axial proton density (A) and T2-weighted (B) images of a septated ganglion cyst medially (arrow).
|
 |
|
FIGURE 5-74 Sagittal proton density (A) and T2-weighted (B) images demonstrate an ACL ganglion (arrow).
|
P.300
 |
|
FIGURE 5-75 Malignant fibrous histiocytoma. Axial proton density (A) and T2-weighted (B) images show an irregular, inhomogeneous mass anterior to the patella.
|
Suggested Reading
Kransdorf M, Berquist TH. Musculoskeletal neoplasms. In: Berquist TH, ed. MRI of the musculoskeletal system, 5th ed. Philadelphia: Lippincott Williams & Wilkins; 2006:802–915.
P.301
Chronic Overuse/Miscellaneous Conditions: Bursitis
Key Facts
-
There are numerous bursae about the knee that may become inflamed and symptomatic (Table 5-5).
-
Patients present with local pain and tenderness. Other injuries (ligament or menisci) must be excluded.
-
Inflamed distended bursae appear as fluid-filled masses on ultrasound, CT, and MR images.
-
Aspiration, therapeutic injections, or resection may be required.
P.302
 |
|
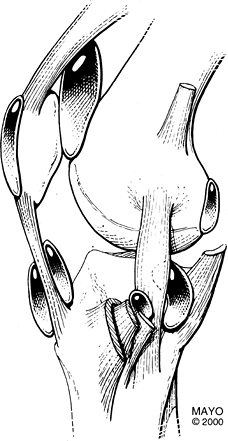
FIGURE 5-76 Bursae about the knee.
|
P.303
 |
|
FIGURE 5-77 Pes anserine bursitis. Sagittal (A) and axial (B) T2-weighted images demonstrating high signal intensity (arrows) along the medial tendons.
|
Suggested Reading
Forbes JR, Nelius CA, Janzen DL. Acute pes anserine bursitis: MR imaging. Radiology 1995;194:525–527.
P.304
Chronic Overuse/Miscellaneous Conditions: Iliotibial Band Syndrome
Key Facts
-
The iliotibial band extends from the greater trochanter to insert on the supracondylar tubercle of the femur.
-
Iliotibial band syndrome is common in long-distance runners, cyclists, and football players.
-
The syndrome is caused by friction of the band over the femur and underlying soft tissues.
-
Differential diagnoses include lateral meniscal tears, LCL injuries, and lateral hamstring strains.
-
Imaging is accomplished using ultrasound
or MRI. A poorly defined fluid collection and thickening of the
iliotibial band are the most common findings.
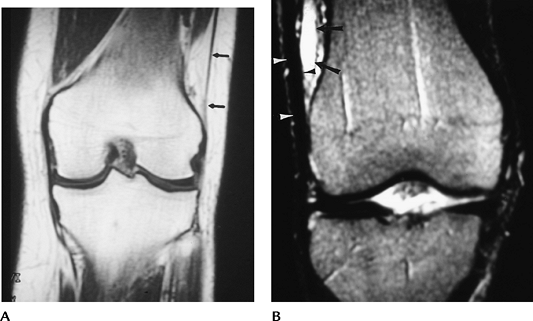 |
|
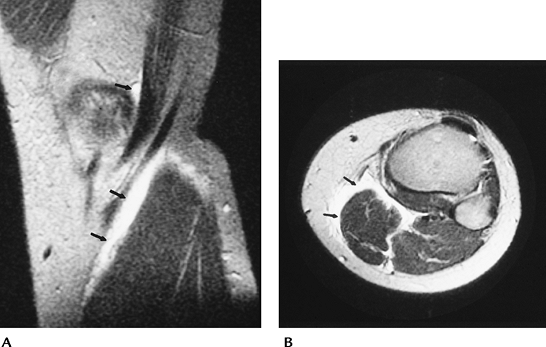
FIGURE 5-78 Iliotibial band syndrome. (A) Normal coronal image of the iliotibial band (arrows). (B) Thickened band (arrowheads) and fluid collection (arrow) on a T2-weighted coronal MR image in a patient with iliotibial band syndrome.
|
Suggested Reading
Murphy BJ, Hechtman KS, Uribe JW, et al. Iliotibial band friction syndrome: MR image findings. Radiology 1992;185:569–571.
P.305
Chronic Overuse/Miscellaneous Conditions: Muscle Tears
Key Facts
-
Ligament and tendon tears are more common than muscle injuries in the knee. Most muscle tears occur in the calf and thigh.
-
Tears in the popliteus, plantaris, and quadriceps can occur in the knee.
-
The plantaris is a small muscle arising
from the lateral femoral condyle. The tendon courses between the
gastrocnemius and soleus. Tears are common in athletes, especially
tennis players. Differential diagnoses include gastrocnemius tears and
deep vein thrombosis. -
Popliteal muscle tears involve the body
of the muscle. Bone bruises (33%) and tears of the ACL (17%) and PCL
(29%) are commonly associated. -
Muscle tears can be graded using axial and coronal or sagittal MR images.
-
Grade 1 strain: A few torn fibers are
seen as an area of high signal intensity on T2-weighted or short T1
inversion recovery (STIR) images. -
Grade 2 strain: Approximately 50% of the fibers are torn.
-
Grade 3 strain: There is a complete tear.
-
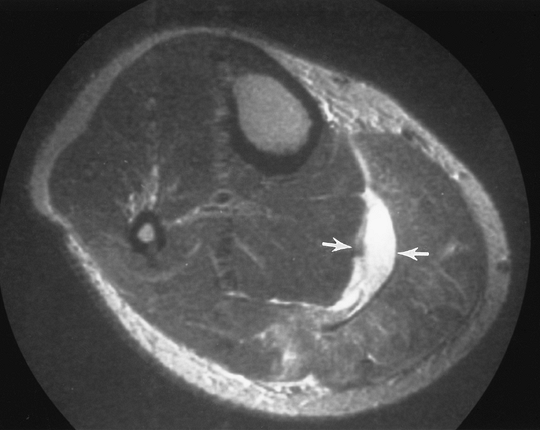 |
|
FIGURE 5-79 Plantaris tear. Axial T2-weighted MR image showing fluid (arrows) between the soleus and gastrocnemius. The tendon of the plantaris is absent.
|
P.306
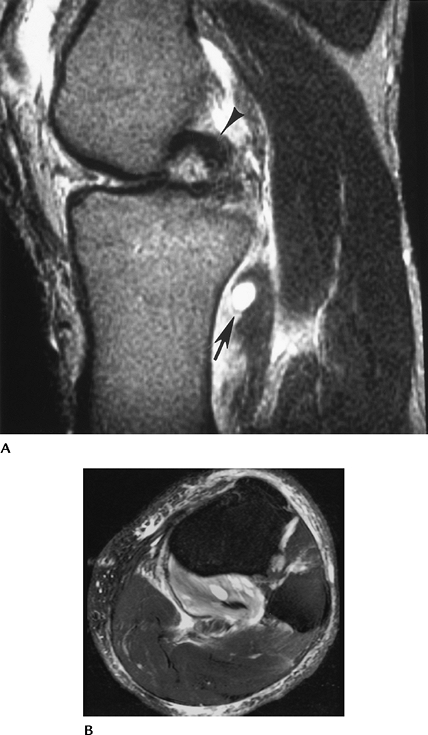 |
|
FIGURE 5-80 Popliteus muscle tear. (A) Sagittal T2-weighted image demonstrates increased signal intensity in the popliteus muscle (arrows). The PCL is hooked (arrowhead) because of an associated ACL tear. Note the joint effusion. (B)
Axial fat-suppressed fast spin-echo T2-weighted image shows abnormal signal intensity involving greater than 50% of the muscle belly (Grade 2+ strain). |
P.307
Suggested Reading
Brown TR, Quinn SF, Wensel JP, et al. Diagnoses of popliteus injuries with MR imaging. Skel Radiol 1995;24:511–514.