
Editors: Berquist, Thomas H.
Title: Musculoskeletal Imaging Companion, 2nd Edition
Copyright ©2007 Lippincott Williams & Wilkins
> Table of Contents > Chapter 4 – Pelvis, Hips, and Thighs
Chapter 4
Pelvis, Hips, and Thighs
Thomas H. Berquist
Protocols
Routine radiographs
-
Pelvis
-
Anteroposterior (AP) to include from iliac crest to below lesser trochanters
-
For trauma, use inlet (tube angled 45 degrees to the feet) and outlet (tube angled 45 degrees to the head) AP views
-
-
Hips
-
AP view, frog-leg oblique, or lateral for screening
-
AP plus Judet (45 degrees anterior and posterior obliques of involved side) views for acetabular trauma
-
-
Femurs
-
AP and lateral to include hip and knee joints
-
P.125
Computed tomography (CT) (bone and soft tissue windows should be studied)
-
Pelvis
-
Axial 5-mm or 1-cm sections iliac crest to below lesser trochanters for screening
-
-
Hips
-
Axial 1-mm sections at 0.5-mm intervals
to be reformatted in coronal, sagittal, or three-dimensional, depending
on indication (i.e., sagittal reformatting is useful to classify
acetabular fractures).
-
MAGNETIC RESONANCE IMAGING
| Region | Pulse Sequence | Thickness/Skip | Matrix | FOV | Acquisitions |
|---|---|---|---|---|---|
| Pelvis/SI Joints | Coronal SE 410/17 | 6 mm | 512 × 512 | 34–40 | 2 |
| Axial 580/13 | 5 mm | 512 × 512 | 34–40 | 1 | |
| Axial FSE 4000/102 | 6 mm | 512 × 512 | 34–40 | 2 | |
| Coronal STIR 5600/109/165 | 5 mm | 256 × 256 | 34–40 | 2 | |
| Hips | Coronal SE 536/15 | 4 mm | 256 × 256 | 20–24 | 1 |
| Axial FSE 4000/102 | 6 mm | 512 × 512 | 20–24 | 2 | |
| Sagittal SE 536/15 | 4 mm | 256 × 256 | 20–24 | 1 | |
| Thighs | Axial FSE 4000/102 | 6 mm | 512 × 512 | 30–42 | 2 |
| Coronal or sagittal SE 536/15 | 4 mm | 256 × 256 | 30–42 | 1 | |
| Arthrography | Axial SE 568/15 | 4 mm | 256 × 256 | 18 | 1 |
| Sagittal SE 568/15 | 4 mm | 256 × 256 | 18 | 1 | |
| Coronal SE 450/15 | 4 mm | 256 × 256 | 18 | 1 | |
| Coronal FSE 4000/102 | 4 mm | 256 × 256 | 18 | 1 | |
| Oblique coronal SE 420/15 | 4 mm | 256 × 256 | 18 | 1 | |
| Oblique sagittal SE 420/15 | 4 mm | 256 × 256 | 18 | 1 | |
| SI, sacroiliac; FSE, fast-spin echo; SE, spin-echo; STIR, short TI inversion recovery; FOV, field of view. | |||||
Additional Options
-
Intravenous gadolinium
-
Neoplasms
-
Early synovial inflammation
-
Infection
-
Early avascular necrosis (AVN)
-
-
Intra-articular gadolinium (8 to 20 mL of 1 mmol solution)
-
Labral tears
-
Subtle cartilage lesions
-
Loose bodies, synovial chondromatosis
-
P.126
Trauma: Pelvic Fractures—Minor
Key Facts
-
Mechanism of injury—fall or minor trauma
-
Usually older age group
-
Fractures of individual bones or single break in pelvic ring
-
Minor fractures account for 25% of pelvic fractures
-
Common minor fractures
-
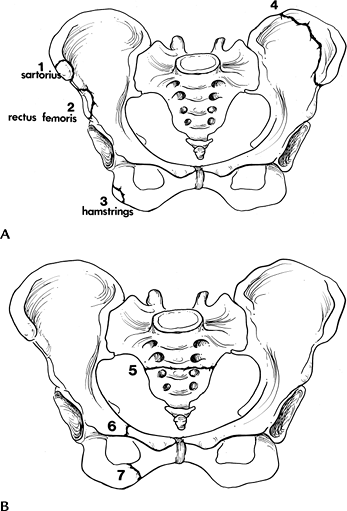
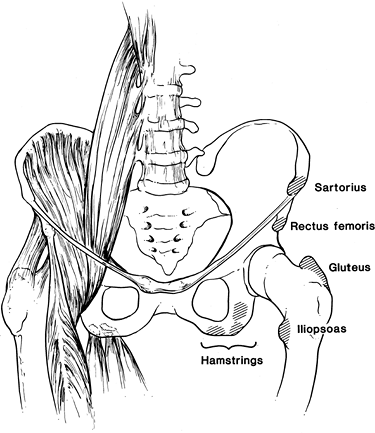
Avulsion fractures (Fig. 4-1)
-
Ischial fractures
-
Pubic rami fractures
-
Transverse sacral fractures (up to 70% missed on routine radiographs)
-
-
Complications—pain, rarely significant complications compared with complex fractures.
 |
|
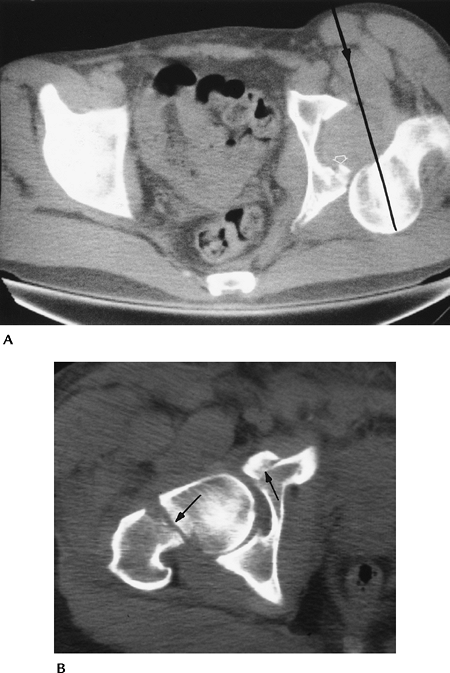
FIGURE 4-1 Common minor fractures of the pelvis. (A)
Anterior superior iliac spine (1), anterior inferior iliac spine (2), ischial tuberosity (3), and iliac wing (4). One to three are avulsion injuries with muscles labeled. (B) Transverse sacral fracture (5), isolated pubic rami fractures (6 and 7). |
P.127
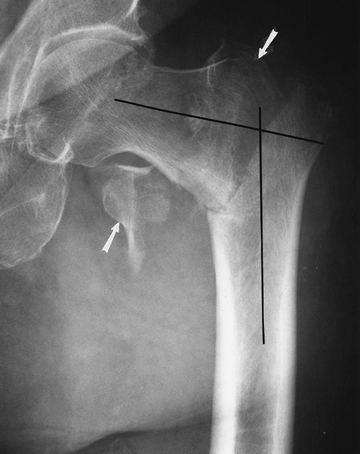
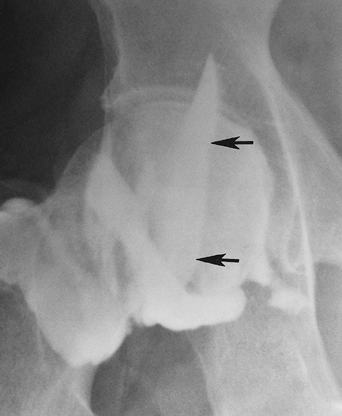
 |
|
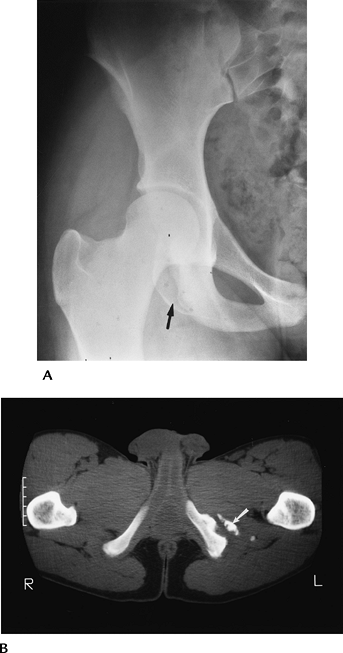
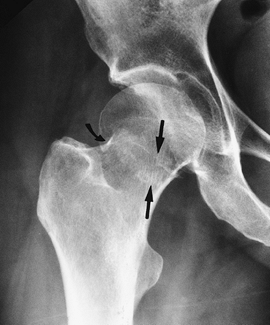
FIGURE 4-2 (A) AP radiograph of the hip demonstrating an ischial avulsion fracture. (B) CT image of an old ischial avulsion fracture.
|
P.128
 |
|
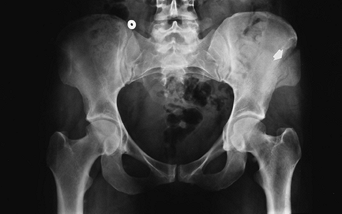
FIGURE 4-3 AP radiograph demonstrating an iliac wing fracture (arrow).
|
Suggested Reading
Young JWR, Resnick C. Fractures of the pelvis: Current concepts in classification. AJR Am J Roentgenol 1990;155:1169–1175.
P.129
Trauma: Pelvic Fractures—Single Break In Pelvic Ring
Key Facts
-
Mechanism of injury—minor trauma
-
Usually undisplaced pubic rami fractures involving one side
-
Account for approximately one third of pelvic fractures
-
Complications—pain, local hematoma
 |
|
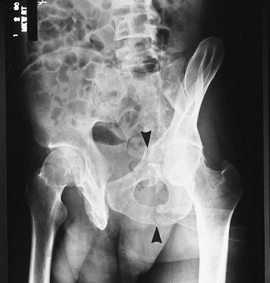
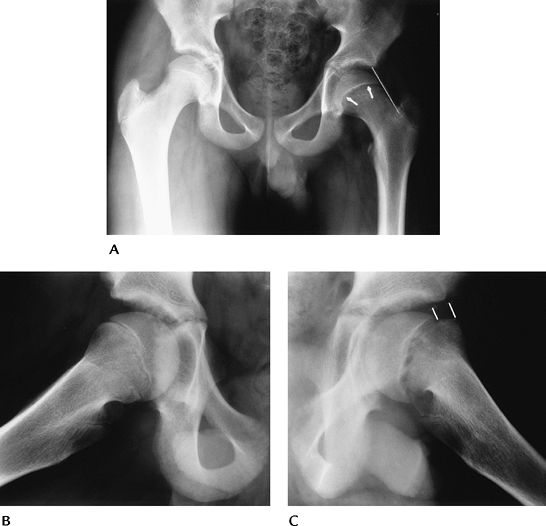
FIGURE 4-4 Anterior Judet view demonstrating pubic rami fractures (arrowheads) resulting in a single break in the pelvic ring.
|
Suggested Reading
Berquist TH. Imaging of orthopedic trauma. 2nd ed. New York: Raven Press; 1992:207–310.
Mucha P, Farnell MB. Analysis of pelvic fracture management. J Trauma 1984;24:379–386.
P.130
Trauma: Pelvic Fractures—Complex
Key Facts
-
Mechanism of injury—high-velocity trauma, such as a motor vehicle accident
-
Lateral compression (41%–72% of cases)
-
AP compression (15%–25% of cases)
-
Vertical shearing injuries (6% of cases)
-
Combined mechanisms (14% of cases)
-
-
Two or more breaks in the pelvic ring
-
Occur in younger age group (52% are less than 30 years of age)
-
Complications may be severe*
Hemorrhage 71% Other associated fractures 65% Genitourinary 22% Neural injury 21% Head injury 11% Chest injury 11% Abdomen injury 11% -
Additional imaging, specifically CT, is usually required to define extent of injury.
P.131
P.132
 |
|
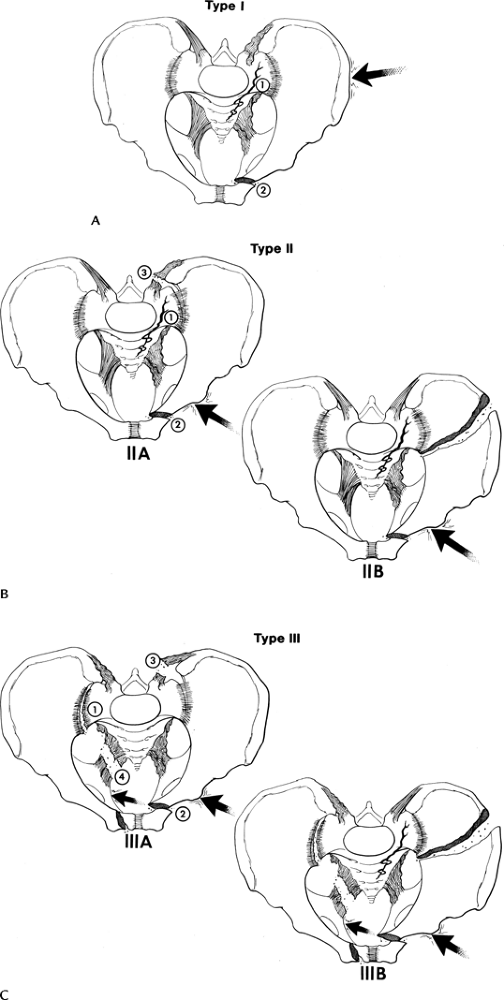
FIGURE 4-5 Lateral compression injuries. (A) Type I: force applied posterolaterally (arrow)
resulting in a crush injury to the sacrum, ilium, and sacroiliac joint (1) and oblique or horizontal pubic rami fractures (2). (B) Type II: force directed anterolaterally (arrow) resulting in diastasis of the sacroiliac joint (1 and 3) (Type IIA) or iliac wing fracture (Type IIB) plus oblique or horizontal pubic rami fractures (2). (C) Type III: force applied anterolaterally (arrow) with oblique or horizontal pubic rami fractures (2) and involvement of both sacroiliac joints and ligaments (1, 3, and 4) (Type IIIA) or sacroiliac joints and ipsilateral iliac wing fracture (Type IIIB). |
P.133
P.134
P.135
 |
|
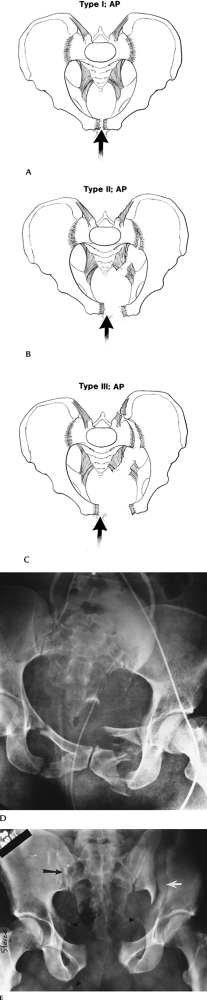
FIGURE 4-6 AP compression injuries. (A) Type I: force applied anteriorly (arrow) resulting in diastasis of the pubic symphysis or vertical pubic rami fractures. (B)
Type II: wider diastasis of the pubic symphysis or vertical pubic rami fractures with disruption of the anterior sacroiliac ligaments. (C) Type III: wider diastasis of the pubic symphysis or displaced vertical pubic rami fractures with disruption of both the anterior and posterior sacroiliac ligaments. (D) AP compression injury with vertical pubic rami fractures. Sacroiliac joints are normal. Note the elevated bladder resulting from a large pelvic hematoma. Type I. (E) Type III AP compression injury with wide diastasis of the pubic symphysis, displaced iliac wing fracture (white arrow), widening of the right sacroiliac joint (black arrow), and multiple avulsion fractures (arrowheads). |
P.136
 |
|
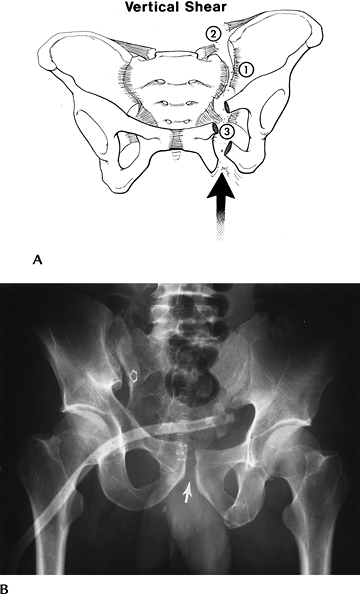
FIGURE 4-7 Vertical shearing injury. (A) Force is applied vertically (arrow)
with vertical pubic rami fractures (3) or step-off at the pubic symphysis and disruption of the anterior and posterior sacroiliac ligaments (1 and 2). (B) Widening and step-off of the right sacroiliac joint (open arrow) and symphysis (arrow). Suprapubic tube in the bladder because of associated urethral injury. |
Suggested Reading
Failinger S, McGarrity PL. Unstable fractures of the pelvic ring. J Bone Joint Surg 1992;74A:781–791.
Young JWR, Resnick C. Fractures of the pelvis: current concepts and classification. AJR Am J Roentgenol 1990;155:1169–1175.
P.137
Trauma: Acetabular Fractures—Simple
Key Facts
-
Mechanism of injury—lower extremity trauma with force directed to the femoral head.
-
Fractures involve posterior acetabulum if hip flexed. Posterior dislocation may occur.
-
Transverse and anterior fractures occur with lateral blow to greater trochanter.
-
AP and Judet views may detect injury. CT
with coronal and sagittal reformatting is useful to evaluate and
characterize subtle fractures and the joint space involvement. -
Complications—minor, or arthrosis in later years.
 |
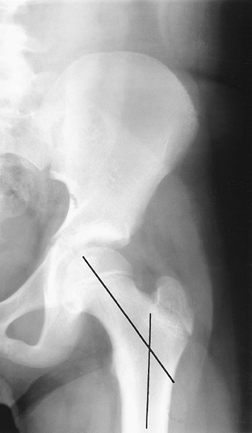
|
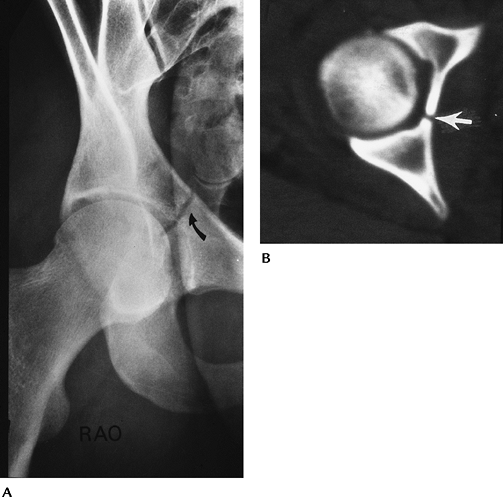
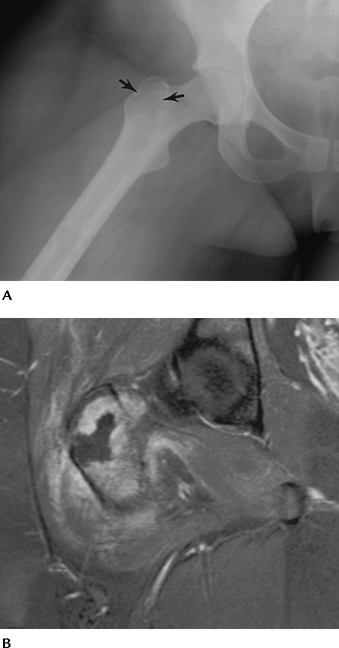
FIGURE 4-8 (A) Judet view of the hip demonstrating and undisplaced central acetabular fracture (curved arrow). (B) CT image demonstrating an uncomplicated central acetabular fracture (arrow).
|
Suggested Reading
Letournel E. Acetabular fracture classification and management. Clin Orthop 1980;151:81–106.
P.138
Trauma: Acetabular Fractures—Complex
Key Facts
-
Multiple fracture classification systems have been proposed.
-
Two-column, transverse with posterior
wall involvement, and posterior wall fractures account for 66% of
acetabular fractures. “T” and transverse fractures are the next two
most common injury patterns. These five patterns account for 90% of
acetabular fractures. -
Definition of extent of articular and anterior and posterior column involvement is critical for treatment planning.
-
CT with reformatting in sagittal and coronal planes or three-dimensional reconstruction is essential.
-
Complications are similar to complex pelvic fractures (see section on Pelvic Fractures—Complex).
P.139
P.140
 |
|
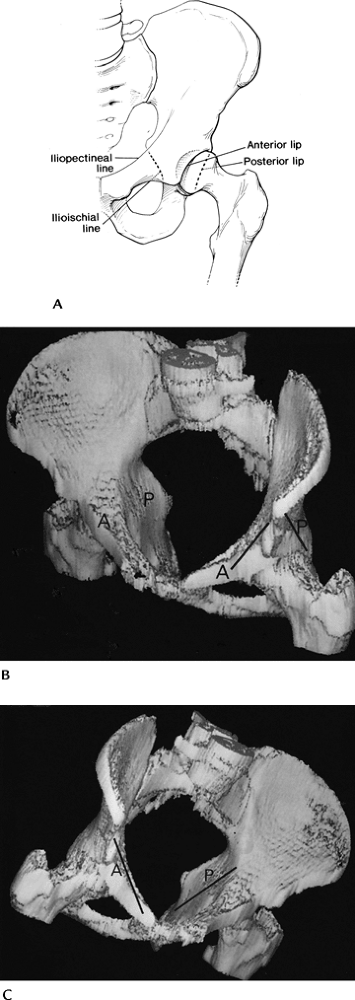
FIGURE 4-9 (A) Acetabular margins and the anterior (iliopectineal) and posterior (ilioischial) columns. Three-dimensional CT images (B,C) demonstrating the anterior and posterior columns.
|
P.141
 |
|
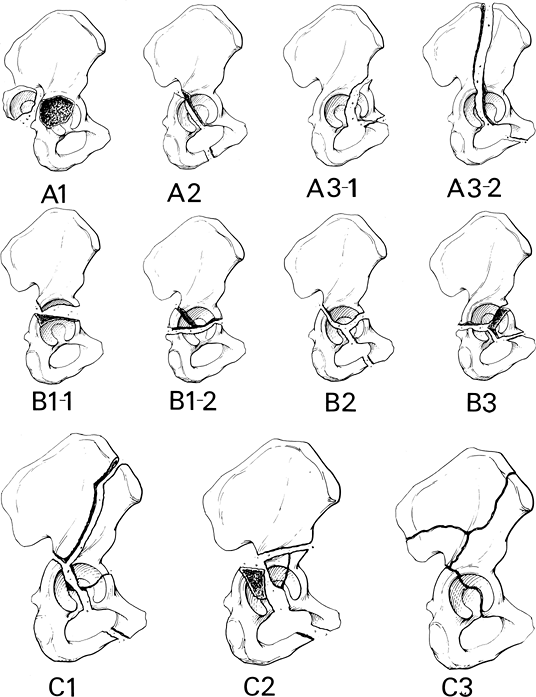
FIGURE 4-10 Fracture patterns (AO classification). (A)
Type A: A1, posterior wall fracture; A2, posterior column fracture; A3-1, anterior wall fracture; A3-2, anterior column fracture. (B) Type B1-1, transverse fracture; Type B1-2, transverse with posterior wall fracture; Type B2-T, fracture; Type B3, anterior column with posterior transverse fracture. (C) Type C1, both columns with fracture extending to the iliac crest; Type C2, both columns extending to anterior inferior iliac spine; Type C3, both columns with extension to sacroiliac joint. Types A1, B1-1, B1-2, B-2, and C1 are the most common. |
P.142
P.143
 |
|
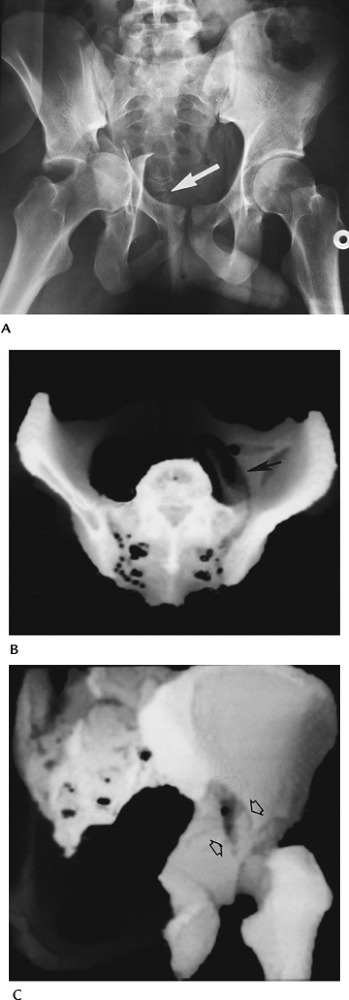
FIGURE 4-11 Complex acetabular fractures. (A)
AP radiograph shows a displaced central acetabular fracture with the femoral head and fragments extending into the pelvis. Note the coccygeal dislocation (arrow). Three-dimensional reconstructions (B,C) of a complex acetabular fracture (arrows). |
Suggested Reading
Brandser E, Marsh JL. Acetabular fractures: Easier classification with a systematic approach. AJR Am J Roentgenol 1998;171:1217–1228.
Saks BJ. Normal acetabular anatomy for acetabular fracture assessment. CT and plain film correlation. Radiology 1986;159:139–145.
P.144
Trauma: Fracture/Dislocation—Dislocation of the Hip
Key Facts
-
Hip dislocations account for 5% of all skeletal dislocations.
-
Mechanism of injury—high-velocity trauma, usually in young adults
-
Posterior dislocations—10 times more
common than anterior. Compressive force to foot or knee with hip
flexed. Posterior acetabular fractures are common. -
Anterior dislocations—forced abduction and external rotation. Femoral head and anterior acetabular fractures are common.
-
-
Up to 75% have multiple other injuries.
-
Most complete dislocations are obvious on the AP view of pelvis or involved hip.
-
CT is useful for complete evaluation of the joint space and associated fractures, especially after reduction.
P.145
 |
|
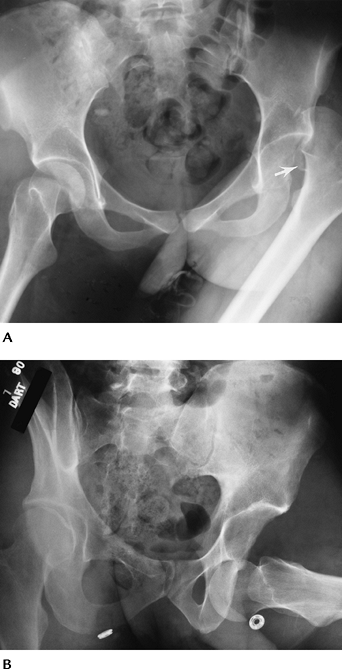
FIGURE 4-12 AP radiographs of posterior (A) and anterior (B) dislocations. Note the displaced femoral head fragment (arrow) in (A).
|
P.146
 |
|
FIGURE 4-13 (A) CT image of a posterior dislocation. Direction of the force (line with arrowhead). Small posterior rim fracture (open arrow). (B) CT image after reduction of an anterior dislocation with fractures of the femoral neck and anterior acetabulum (arrows).
|
P.147
Suggested Reading
Richardson
P, Young JWR, Porter D. CT detection of cortical fracture of the
femoral head associated with posterior dislocation of the hip. AJR Am J Roentgenol 1990;155:93–94.
P, Young JWR, Porter D. CT detection of cortical fracture of the
femoral head associated with posterior dislocation of the hip. AJR Am J Roentgenol 1990;155:93–94.
Rosenthal RE, Coher WL. Fracture dislocations of the hip: An epidemiological review. J Trauma 1979;19:572–581.
P.148
Trauma: Femoral Neck Fractures
Key Facts
-
Occur in the elderly and in females more than males
-
Mechanism of injury—minimal trauma or fall
-
Garden classification
-
Type I: incomplete involving lateral cortex
-
Type II: complete, but undisplaced
-
Type III: partially displaced
-
Type IV: completely displaced
-
-
Some prefer undisplaced (Types I and II) and displaced (Types III and IV)
-
Imaging of subtle undisplaced fractures
may require radionuclide scanning or magnetic resonance imaging (MRI)
for detection. Displaced fractures usually are obvious on routine
radiographs. -
Complications
-
Mortality 10% to 20% in the first 30 days after injury and surgery
-
Mortality approximately 30% first year after injury
-
AVN common with displaced fractures
-
-
Treatment—pin undisplaced and endoprostheses used for displaced fractures because of high incidence of avascular necrosis (AVN).
 |
|
FIGURE 4-14 Impacted femoral neck fracture (arrows) with cortical disruption and trabecular compression laterally (curved arrow). The hip was pinned.
|
P.149
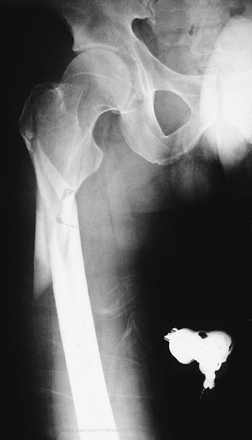
 |
|
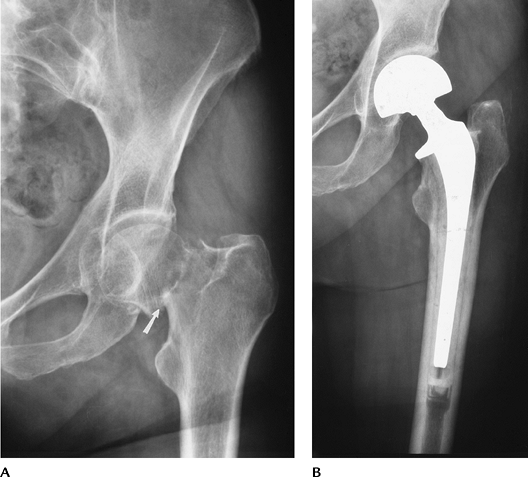
FIGURE 4-15 (A) Displaced femoral neck fracture (arrow). (B) Treated with bipolar endoprosthesis.
|
 |
|
FIGURE 4-16 Coronal fast spin-echo T2-weighted image demonstrates edema with a central linear low-intensity line (arrow) caused by femoral neck stress fracture.
|
P.150
Suggested Reading
Berquist TH. Imaging atlas of orthopedic appliances and prostheses. New York: Raven Press; 1995:217–352.
Garden RS. Stability and union of subcapital fractures of the femur. J Bone Joint Surg 1964;64B:630–712.
Morgan CG, Wenn RT, Sikand M, et al. Early mortality after hip fracture: Is delay before surgery important. J Bone Joint Surg 2005;87A:483–490.
P.151
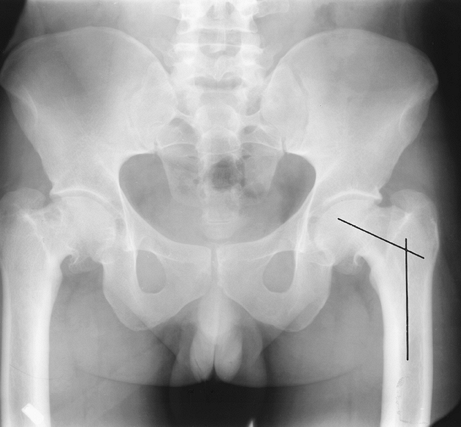
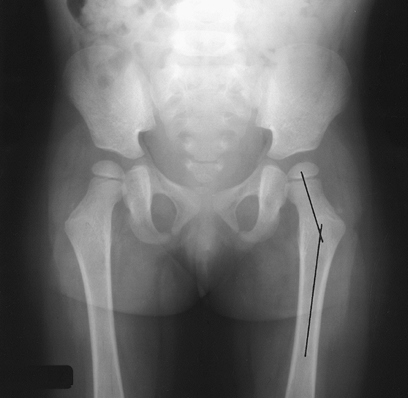
Trauma: Trochanteric Fractures
Key Facts
-
Three types of fracture: avulsion, intertrochanteric, and subtrochanteric
-
Intertrochanteric fractures
-
Most common in elderly because of falls
-
Extracapsular; comminution of fracture with detachment of trochanters common
-
Significant mortality (18%–30%) in year of injury
-
-
Subtrochanteric fractures
-
More common in younger patients with high-velocity trauma
-
Reduction more difficult to maintain than intertrochanteric fractures
-
-
Avulsion fractures
-
Caused by abrupt muscle contraction (Fig. 4-17)
-
Occur in active athletes
-
Greater trochanteric avulsions also seen in elderly patients
-
-
Routine radiographs usually are diagnostic
 |
|
FIGURE 4-17 Sites for avulsion fractures in the pelvis and hips with muscle origins labeled.
|
P.152
 |
|
FIGURE 4-18 AP radiograph of a comminuted intertrochanteric fracture. Trochanters (arrows) and angular deformity (lines).
|
P.153
 |
|
FIGURE 4-19 AP radiograph of a subtrochanteric fracture with overriding and slight angulation of the fragments.
|
Suggested Reading
Jensen JS. Classification of trochanteric fractures. Acta Orthop Scand 1980;51:803–810.
Lorich DG, Geller DS, Nelson JH. Osteoporotic peritrochanteric hip fractures. J Bone Joint Surg 2004;86A:398–410.
P.154
Trauma: Insufficiency Fractures
-
Insufficiency fractures occur because of normal stress on bone with abnormal elastic resistance.
-
Insufficiency fractures most commonly involve the sacrum, pubic rami, and supra-acetabular regions and femoral necks.
-
Most insufficiency fractures occur in elderly osteopenic patients or patients on steroid therapy.
-
Patients present with back, hip, or groin pain.
-
Because of the patient’s age, metastatic disease often is included in the differential diagnosis.
-
Image features
-
Radiographs: bone sclerosis or condensation, typically linear.
-
Radionuclide scans: increased tracer in area of fracture. Bilateral sacral fractures give “H” appearance (Honda sign).
-
MRI: marrow edema pattern (increased
signal on T2-weighted images, decreased signal on T1-weighted images)
with or without visible fracture line. -
CT: fracture lines clearly defined.
-
P.155
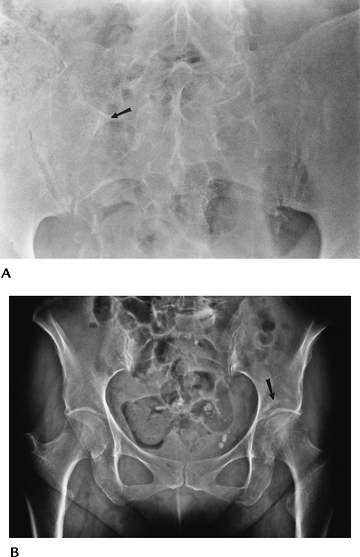 |
|
FIGURE 4-20 Radiographs of insufficiency fractures. (A) Radiograph demonstrates subtle bone condensation in the sacrum (arrow) caused by an insufficiency fracture. (B) AP radiograph of the pelvis with linear condensation in the left acetabulum (arrow) caused by an acetabular insufficiency fracture.
|
P.156
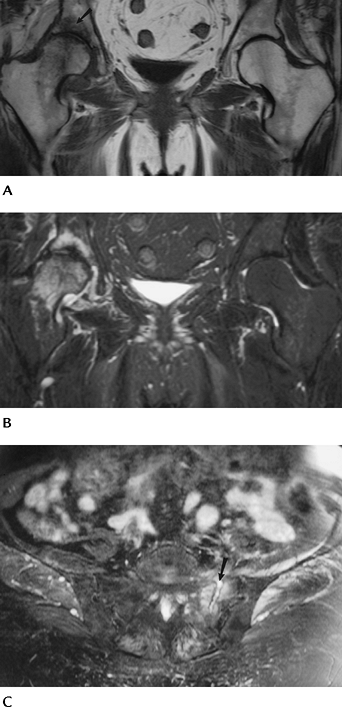 |
|
FIGURE 4-21 MRI of insufficiency fractures. Coronal T1- (A) and fast spin-echo T2- (B)
weighted images show abnormal signal intensity in the acetabulum on the right caused by insufficiency fracture. There is also marrow edema in the femoral head and neck caused by early AVN. (C) Axial fast spin-echo T2-weighted image of the sacrum with and insufficiency fracture and fluid (arrow) in the fracture line. |
P.157
Suggested Reading
Pek WCG, Khong PL, Yur Y, et al. Imaging of pelvic insufficiency fractures. Radiographics 1996;16:335–348.
P.158
Trauma: Soft Tissue Trauma
Key Facts
-
Soft tissue injuries to the pelvis, hips, and thighs may include
-
Muscle/tendon injuries
-
Ligament injuries
-
Neurovascular injuries
-
Acetabular labral tears
-
Bursitis
-
Snapping tendon syndromes
-
Greater trochanteric pain syndrome
-
-
Imaging approaches vary with suspected clinical condition.
| Condition | Imaging Approach |
|---|---|
| Muscle/tendon injury | MRI |
| Ligament injury | MRI, arthrography, or magnetic resonance (MR) arthrography for hip |
| Neurovascular injury | MRI |
| Acetabular labral tears | MR arthrography |
| Bursitis | Ultrasound or MRI |
| Snapping tendon syndrome | Tendon injection with motion studies, ultrasound |
Suggested Reading
Cvtanic O, Henzie G, Skezas DS, et al. MRI diagnosis of tears in the abductor tendons (gluteus medius and gluteus minimus). AJR Am J Roentgenol 2004;182:137–143.
Czermy
C, Hofmann S, Nenhold A, et al. Lesions of the acetabular labrum:
Accuracy of MR imaging and MR arthrography in detection and staging. Radiology 1999;220:225–230.
C, Hofmann S, Nenhold A, et al. Lesions of the acetabular labrum:
Accuracy of MR imaging and MR arthrography in detection and staging. Radiology 1999;220:225–230.
DeSmet AA, Fisher DR, Heiner JP, et al. Magnetic resonance imaging of muscle tears. Skel Radiol 1990;19:283–286.
Lonner JH, Van Kleunen JP. Spontaneous rupture of the gluteus medius and minimus tendons. Am J Orthop 2002;31:579–581.
P.159
Trauma: Soft Tissue Trauma: Muscle/Tendon Tears
Key Facts
-
Muscle/tendon tears are common in athletes and patients engaged in exercise programs.
-
Underlying disorders (diabetes mellitus,
steroid therapy, connective tissue diseases, and renal failure) may
also lead to myotendinous injuries. -
Categories of injury
-
Grade 1 strain: a few fibers torn
-
Grade 2 strain: approximately 50% of fibers torn
-
Grade 3 strain: complete tear
-
Hematoma
-
Myositis ossificans
-
-
Muscles involved include the hamstrings, adductors, gluteal, iliopsoas, and abdominal muscles.
-
Radiographs or CT is useful for avulsion injuries. MRI is superior for detection and staging of injuries.
 |
|
FIGURE 4-22 Axial (A) and sagittal (B) T2-weighted images of a Grade 1–2 strain of the hamstring muscles (arrows).
|
P.160
 |
|
FIGURE 4-23 Coronal (A) and axial (B) T2-weighted images of an adductor muscle tear (arrows) with a central hematoma.
|
Suggested Reading
DeSmet AA, Fisher DR, Heiner JP, et al. Magnetic resonance imaging of muscle tears. Skel Radiol 1990;19:283–286.
Koulouris G, Connell D. Evaluation of the hamstring muscle complex following acute injury. Skel Radiol 2003;32:582–589.
P.161
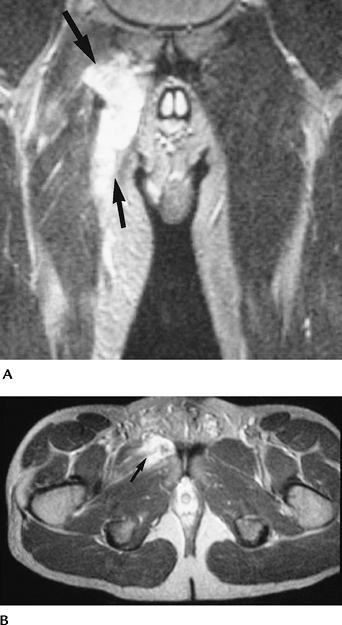
Trauma: Soft Tissue Trauma: Bursitis
Key Facts
-
There are 20 synovial-lined bursae about the hip.
-
Bursitis from chronic tendon friction
most commonly involves the trochanteric, iliopsoas, ischiogluteal, and
obturator externus bursae. -
The iliopsoas bursa communicates with the
hip joint in 15% to 20% of patients. Bursitis is common in patients
with rheumatoid arthritis, osteoarthritis (50%), gout, infection, and
prior joint arthroplasty. -
Imaging of bursitis can be accomplished with ultrasound, CT, MRI, or direct contrast injection.
-
Combined anesthetic and steroid injections can be used for therapy.
 |
|
FIGURE 4-24 Hip arthrogram/injection with filling of the iliopsoas bursa (arrows).
|
P.162
 |
|
FIGURE 4-25 Coronal fast spin-echo T2-weighted image demonstrating an enlarged iliopsoas bursa (arrows) with low signal intensity filling defects because of chronic synovitis.
|
 |
|
FIGURE 4-26 Axial fast spin-echo T2-weighted image of an inflamed trochanteric bursa (arrow).
|
P.163
Suggested Reading
Bencardino JT, Palmer WE. Imaging of hip disorders in athletes. Radiol Clin North Am 2002;40:267–287.
Robinson
P, White LM, Agur A, et al. Obturator externus bursa: Anatomic origin
and MR imaging features of pathologic involvement. Radiology 2003;228:230–234.
P, White LM, Agur A, et al. Obturator externus bursa: Anatomic origin
and MR imaging features of pathologic involvement. Radiology 2003;228:230–234.
Wunderholdinger P, Bremer C, Schellenberger E, et al. Imaging features of iliopsoas bursitis. Eur Radiol 2002;12:409–415.
P.164
Trauma: Soft Tissue Trauma: Greater Trochanteric Pain Syndrome
Key Facts
-
Greater trochanteric pain syndrome is
common in middle-aged or elderly females, runners, and individuals
engaged in step aerobics. -
Greater trochanteric anatomy:
-
Anterior facet: gluteus minimus tendon insertion
-
Lateral facet: gluteus medius tendon insertion
-
Posterior facet: covered by trochanteric bursa
-
Superior posterior bursa: insertion of main tendon of gluteus medius
-
-
Pain is caused by bursitis or tearing of the gluteus medius and minimus tendons.
-
These tendons are analogous to the rotator cuff with an avascular zone near the trochanteric attachments.
-
Pain is exacerbated by lying on the affected side or stair-climbing.
-
Differential diagnosis: bursitis, fibromyalgia, iliotibial band syndrome, abductor tendonitis.
-
Radiographs show trochanteric enthesophytes in 50% of patients. Enthesophytes may cause impingement.
-
MRI demonstrates bursitis in 85% and partial or complete tendon tears with muscle atrophy.
-
Treatment is conservative with therapeutic injections. Tendon tears may require surgical repair.
P.165
 |
|
FIGURE 4-27 (A) Coronal T1-weighted image shows gluteus minimus atrophy (arrows). (B) Fast spin-echo T2-weighted image shows high signal intensity because of a high-grade tear in the minimus tendon (arrow).
|
Suggested Reading
Bird
PA, Oakley SP, Shnier R, et al. Prospective evaluation of magnetic
resonance imaging and physical examination findings in patients with
greater trochanteric pain syndrome. Arthritis Rheum 2001;44:2138–2145.
PA, Oakley SP, Shnier R, et al. Prospective evaluation of magnetic
resonance imaging and physical examination findings in patients with
greater trochanteric pain syndrome. Arthritis Rheum 2001;44:2138–2145.
Kingzett-Taylor
A, Tirovan PFJ, Feller J, et al. Tendinosis and tears of the gluteus
medius and minimus muscles as a cause of hip pain: MR imaging findings.
AJR Am J Roentgenol 1999;173:1123–1126.
A, Tirovan PFJ, Feller J, et al. Tendinosis and tears of the gluteus
medius and minimus muscles as a cause of hip pain: MR imaging findings.
AJR Am J Roentgenol 1999;173:1123–1126.
P.166
Trauma: Soft Tissue Trauma: Acetabular Labral Tears
Key Facts
-
The labrum attaches to the acetabular
margin posteriorly, superiorly, and anteriorly. Inferiorly it merges
with the transverse ligament. -
The labrum is typically triangular (69%), round in 19%, and flat in 12.5%.
-
Signal intensity is normally low, but internal signal intensity increases with age. Size and shape may also vary left to right.
-
Labral detachments and tears occur. Lesions are most common in the superior and anterior quadrants.
-
Labral tears, especially detachments, may be associated with paralabral cysts.
-
MR arthrography is the technique of choice for labral evaluation.
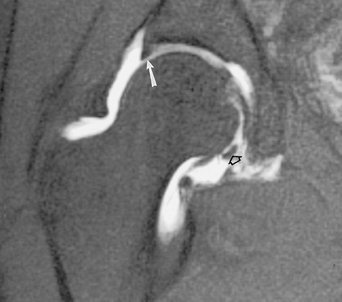 |
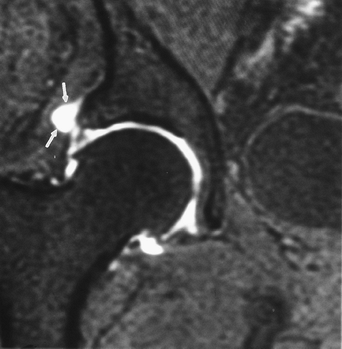
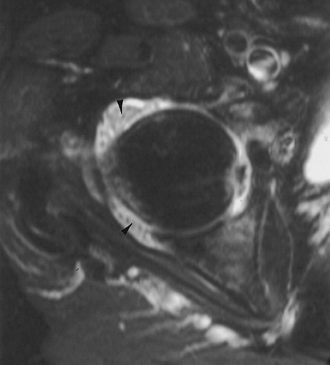
|
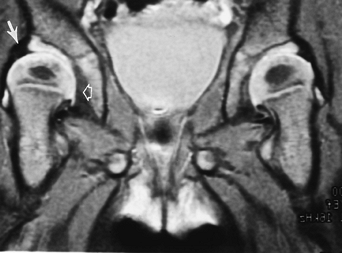
FIGURE 4-28 Coronal MR arthrogram image demonstrating the normal triangular shape of the superior labrum (arrow) and the transverse ligament inferiorly (open arrow).
|
P.167
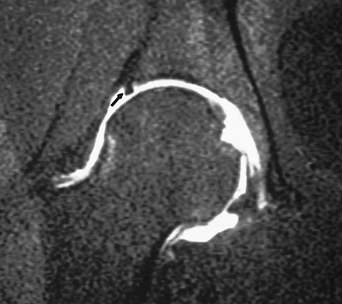 |
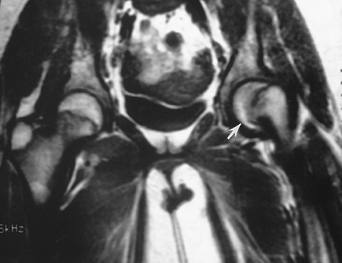
|
FIGURE 4-29 Coronal MR arthrogram image demonstrating a superior labral tear (arrow).
|
 |
|
FIGURE 4-30 Coronal MR arthrogram image with superior labral tear and paralabral cyst (arrows).
|
Suggested Reading
Andingoz U, Ozturk MH. MR imaging of the acetabular labrum: A comparative study of both hips in 180 asymptomatic volunteers. Eur Radiol 2001;11:567–574.
Petersilge CA. MR arthrography for evaluation of the acetabular labrum. Skel Radiol 2001;30:423–430.
P.168
Trauma: Soft Tissue Trauma: Femoroacetabular Impingement
Key Facts
-
There are two types of femoroacetabular impingement.
-
Pincer-type: Femoral head–neck junction
contacts the acetabular rim because of underlying abnormalities. Seen
in elderly females with coxa profunda or acetabular retroversion. Also
labral tears or degeneration. -
Cam-type: Abnormal morphology of anterior
head–neck junction. Angles greater than 55 degrees associated with
impingement. May have associated cartilage or labral lesions.
-
-
Femoroacetabular impingement leads to early degenerative arthritis.
-
MR arthrography is the imaging technique of choice.
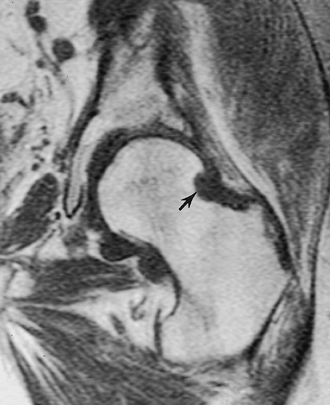
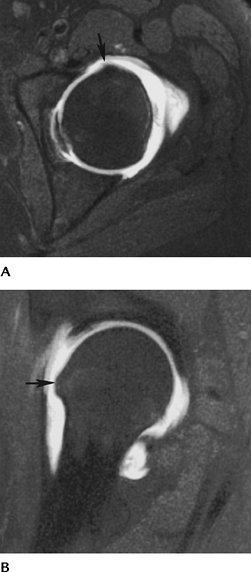 |
|
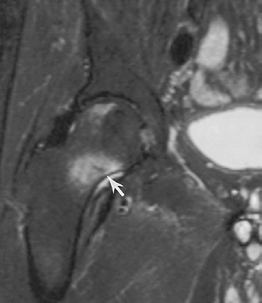
FIGURE 4-31 Axial (A) and sagittal (B) MR arthrogram images demonstrate a bony prominence at the head–neck junction (arrow) causing impingement.
|
P.169
Suggested Reading
Kassarjian
A, Yoon LS, Belzile E, et al. Triad of MR arthrographic findings in
patients with cam-type femoroacetabular impingement. Radiology 2005;236:588–592.
A, Yoon LS, Belzile E, et al. Triad of MR arthrographic findings in
patients with cam-type femoroacetabular impingement. Radiology 2005;236:588–592.
Siebenrock KA, Schoeniger R, Ganz R. Anterior femoroacetabular impingement due to acetabular retroversion. J Bone Joint Surg 2003;85A:278–286.
P.170
Osteonecrosis
Key Facts
-
Osteonecrosis is the general term for death or necrosis of bone and marrow elements.
-
AVN—epiphyseal or subchondral necrosis
-
Infarct—metaphyseal or diaphyseal necrosis
-
-
Cause
-
Trauma
-
Corticosteroids
-
Sickle cell disease
-
Alcoholism
-
-
Imaging approaches
-
Routine radiographs
-
Radionuclide scans
-
MRI
-
P.171
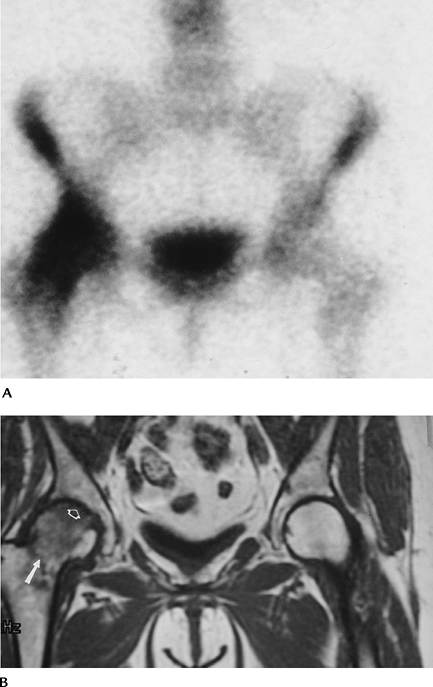 |
|
FIGURE 4-32 Routine radiograph was normal. (A) Radionuclide scan shows increased signal intensity in the right femoral head and neck. (B) Spin-echo T1-weighted image shows a femoral neck fracture (arrow), low-intensity edema pattern, and AVN (open arrow).
|
Suggested Reading
Jones JP Jr. Etiology and pathogenesis of osteonecrosis. Semin Arthroplasty 1991;2:160–168.
Mitchell
DG, Rao VM, Dalinka MK, et al. Femoral head avascular necrosis:
Correlation of MR imaging, radiographic staging, radionuclide imaging,
and clinical findings. Radiology 1987;162:709–715.
DG, Rao VM, Dalinka MK, et al. Femoral head avascular necrosis:
Correlation of MR imaging, radiographic staging, radionuclide imaging,
and clinical findings. Radiology 1987;162:709–715.
P.172
Osteonecrosis: Avascular Necrosis
Key Facts
-
Early detection is critical to optimize treatment and preserve joint function.
-
MRI is the imaging technique of choice, although radiographs and radionuclide scans also are useful (Table 4-1).
-
MRI technique should access articular and
weight-bearing involvement, which may require coronal and sagittal
images. T1- and T2-weighted sequences are used to access
revascularization. Intravenous gadolinium is useful to image subtle AVN
and to evaluate flow. -
The extent of articular involvement is
useful for prognosis. Less than 45% of weight-bearing involvement has a
good prognosis. Greater than 45% of weight-bearing involvement carries
a poor prognosis with articular collapse common (Fig. 4-33D). -
Early stages (Table 4-1)
of AVN may be treated with core decompression with or without bone
grafting (Stages I and II). More advanced disease (Stages III and IV)
usually requires resurfacing, bipolar implants, or total joint
arthroplasty.
|
TABLE 4-1 STAGES OF AVASCULAR NECROSIS
|
||||||||||||||||||||||||||||
|---|---|---|---|---|---|---|---|---|---|---|---|---|---|---|---|---|---|---|---|---|---|---|---|---|---|---|---|---|
|
||||||||||||||||||||||||||||
P.173
P.174
 |
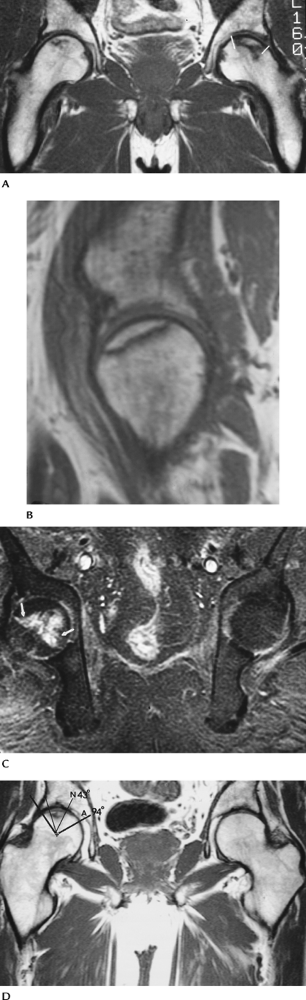
|
FIGURE 4-33 MRI of AVN. (A) Coronal T1-weighted image of bilateral AVN with greater articular involvement on the left (lines). (B) Sagittal T1-weighted image demonstrating articular surface involvement. (C) Fat-suppressed T1-weighted postcontrast image shows enhancement at the margin of the necrotic bone (arrows) caused by revascularization. (D) Coronal T1-weighted image demonstrating a simple method to calculate the weight-bearing surface involvement. Angle A (thick black lines)
is formed by lines from the center of the femoral head to the weight-bearing margins. Angle N is formed by lines from the necrotic margins to the center of the femoral head. N/A × 100% = % of weight-bearing involvement. In this case 43/94 = 46% indicating a poorer prognosis. |
P.175
Suggested Reading
Ficat RF. Treatment of avascular necrosis of the femoral head. Hip 1983;2:279–295.
Koo KH, Kim R. Quantifying the extent of osteonecrosis of the femoral head. A method using MRI. J Bone Joint Surg 1995;77B:825–830.
Liebermann JR, Berry DJ, Mont MA, et al. Osteonecrosis of the hip. Management in the 21st century. J Bone Joint Surg 2002;84A:834–853.
P.176
Osteonecrosis: Bone Infarcts
Key Facts
-
Patients may be asymptomatic or present with pain.
-
Location (metaphyseal or diaphyseal) differs from AVN (subchondral).
-
Cause similar (see “Osteonecrosis”) to AVN.
-
Radiographs demonstrate serpiginous peripheral calcification at the necrotic margins.
-
MR images show a clear zone of demarcation on T1- and T2-weighted images.
-
Malignant degeneration, although rare, can occur.
 |
|
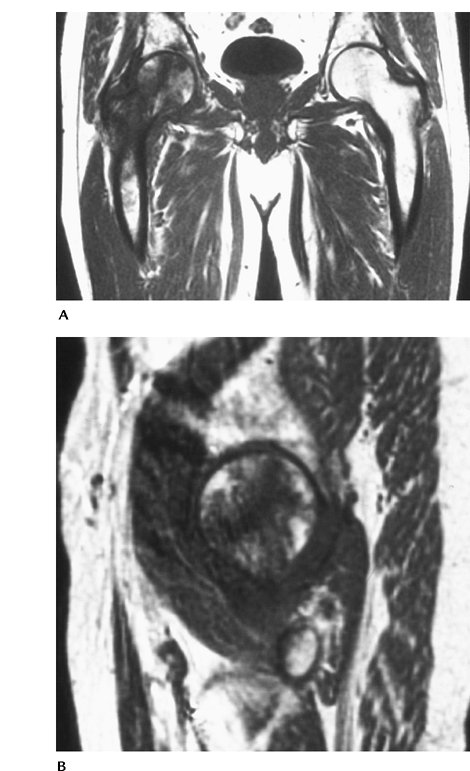
FIGURE 4-34 Coronal T1-weighted MRI showing AVN of both femoral heads and infarcts (arrows) in the trochanteric regions.
|
Suggested Reading
Berquist TH. MRI of the musculoskeletal system. 5th ed. Philadelphia: Lippincott Williams & Wilkins; 2006:201–302.
P.177
Bone Marrow Edema
Key Facts
-
Marrow edema pattern or transient bone marrow edema may be the earliest feature of AVN or resolve with no sequelae.
-
Radiographs demonstrate osteopenia within 8 weeks after onset of symptoms. There is increased uptake on radionuclide scans.
-
MR images show decreased signal intensity
on T1-weighted images and increased signal intensity on T2-weighted
images involving the femoral head and neck. Lack of progression on MRI
over a 6- to 12-week period is typical. Subchondral low signal
intensity on T2-weighted or contrast-enhanced images suggests
progression or a nontransient process. -
Other diagnoses must be excluded.
-
Early AVN
-
Transient osteoporosis of the hip
-
Infection
-
Neoplasm
-
-
Conservative treatment usually is
preferred unless subchondral changes are identified. Core decompression
may be indicated in this setting.
P.178
 |
|
FIGURE 4-35 Coronal (A) and sagittal (B) T1-weighted images showing low signal intensity in the right femoral head and neck caused by transient marrow edema.
|
P.179
Suggested Reading
Hayes
CW, Conway WF, Daniel WW. MR imaging of bone marrow edema pattern:
Transient osteoporosis, transient bone marrow edema, or osteonecrosis. Radiographics 1993;13:1001–1011.
CW, Conway WF, Daniel WW. MR imaging of bone marrow edema pattern:
Transient osteoporosis, transient bone marrow edema, or osteonecrosis. Radiographics 1993;13:1001–1011.
Van
de Berg BC, Malghen JJ, Lecouret FE, et al. Idiopathic bone marrow
edema lesions in the femoral head. Predictive value of MR image
findings. Radiology 1999;212:527–535.
de Berg BC, Malghen JJ, Lecouret FE, et al. Idiopathic bone marrow
edema lesions in the femoral head. Predictive value of MR image
findings. Radiology 1999;212:527–535.
P.180
Transient Osteoporosis of the Hip
Key Facts
-
One of several conditions that presents with pain and bone marrow edema pattern (Figs. 4-33 and 4-35).
-
Cause unknown. Males outnumber females
3:1; most are middle aged. Females often are affected in the third
trimester of pregnancy. -
Three clinical phases
-
Pain, limp; lasts approximately 1 month
-
Symptoms ease; osteopenia seen on radiographs; lasts approximately 2 months
-
Symptoms regress; last approximately 3 months
-
-
Differential diagnosis includes
-
Reflex sympathetic dystrophy
-
Bone marrow edema
-
AVN
-
Infection
-
-
Image features
-
Radiographs: osteopenia in femoral head and neck after 4 to 6 weeks
-
Radionuclide scans: increased tracer in femoral head and neck
-
MR images: increased signal on
T2-weighted images and decreased signal on T1-weighted images in the
femoral head and neck. Joint effusions are common.
-
P.181
P.182
 |
|
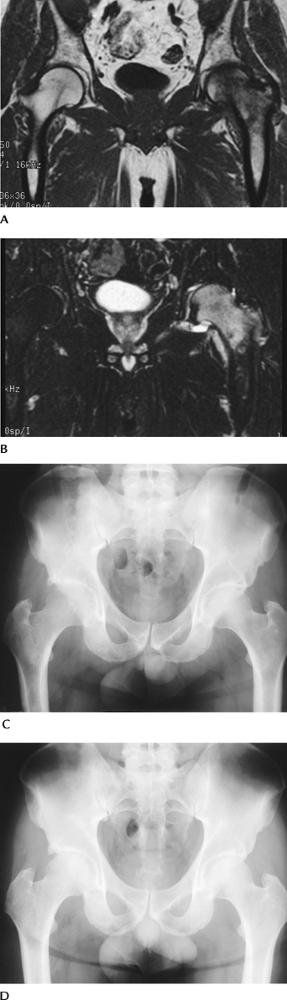
FIGURE 4-36 Coronal T1- (A) and T2- (B)
weighted images demonstrate abnormal signal intensity in the left femoral head and neck in a patient with hip pain. Radiographs in a different patient showing osteopenia in the right hip during the symptomatic phase (C) and return to normal (D) 6 months later. |
Suggested Reading
Guerra JJ, Steinberg MR. Distinguishing transient osteonecrosis from avascular necrosis of the hip. J Bone Joint Surg 1995;77A:616–624.
P.183
Neoplasms
Key Facts
-
Metastatic disease is common in the pelvis and hips.
-
Primary bone and soft tissue tumors common in the pelvic region are summarized in Table 4-2. Specific image features of neoplasms are noted in Chapter 10.
-
Routine radiographs are most useful for predicting the nature (benign vs. malignant) of osseous neoplasms.
-
MRI is most useful for characterizing soft tissue tumors and staging of bone and soft tissue tumors (Table 4-3).
-
CT is useful for evaluating calcifications, tumor matrix, thin cortical bone, and osteoid osteomas (Fig. 4-37).
|
TABLE 4-2 COMMON OSSEOUS NEOPLASM IN THE PELVIS, HIPS, AND UPPER FEMURS
|
||||||||||||||||||||||||||||||
|---|---|---|---|---|---|---|---|---|---|---|---|---|---|---|---|---|---|---|---|---|---|---|---|---|---|---|---|---|---|---|
|
||||||||||||||||||||||||||||||
P.184
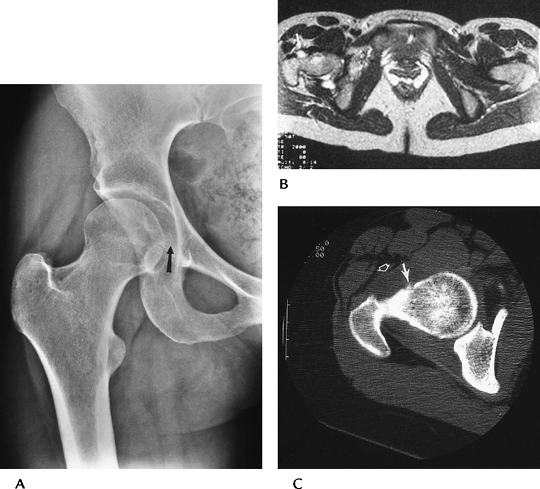 |
|
FIGURE 4-37 Osteoid osteoma. (A) Routine radiographs demonstrating medial joint space widening (arrow) caused by soft tissue reaction. (B) Axial T2-weighted MR image showing focal increased signal along the femoral neck (arrow). (C) CT clearly demonstrating osteoid osteoma (arrow). Note the anterior soft tissue thickening (open arrow).
|
P.185
 |
|
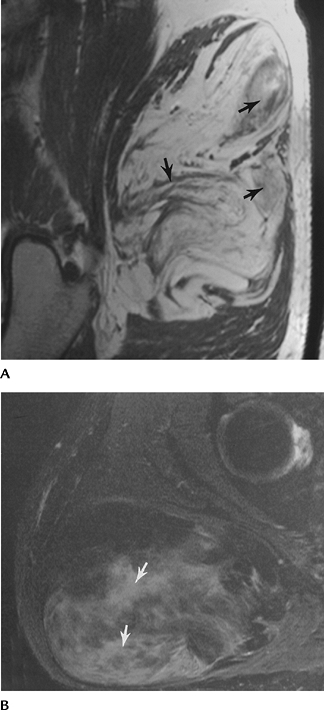
FIGURE 4-38 Low-grade liposarcoma. Sagittal T1- (A) and T2- (B)
weighted images demonstrate a large fatty tumor with areas of low-signal intensity on T1- and high-signal intensity on T2-weighted sequences (arrows). |
Suggested Reading
Berquist TH. MRI of musculoskeletal neoplasms. Clin Orthop 1989;244:101–118.
Unni KK. Dahlin’s bone tumors: General aspects and data on 11,087 cases. Philadelphia, Lippincott-Raven; 1996.
Weiss SW, Goldblum JR. Enzinger and Weiss’s soft tissue tumors. 4th ed. St. Louis: Mosby; 2001.
P.186
Arthropathies
Key Facts
-
Arthropathies may affect the hips, sacroiliac joints, bursae, and soft tissue attachments about the joints (see Chapter 13).
-
Multiple local and systemic disorders may involve the articular structures of the pelvis and hips.
| Systemic | Local |
|---|---|
| Rheumatoid arthritis | Posttraumatic arthritis |
| Seronegative spondyloarthropathies | Infection |
| (Reiter disease, ankylosing spondylitis, psoriatic arthritis) | Synovial chondromatosis Pigmented villonodular synovitis |
| Juvenile chronic arthritis | Paget disease |
| Connective tissue diseases | Crystalline arthropathies |
| Collagen vascular diseases |
Arthropathies: The Hip
Key Facts
-
Joint space evaluation is a critical radiographic criterion for evaluating arthropathies.
-
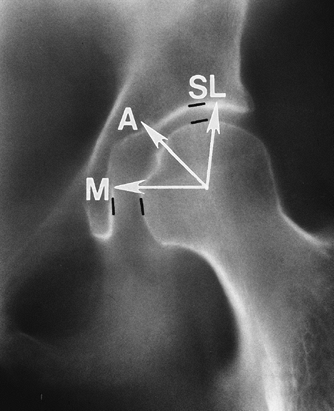
Joint space narrowing may be medial, axial, or superolateral (Fig. 4-39).
-
Superolateral—common with degenerative arthritis
-
Medial—posttraumatic
-
Axial—inflammatory arthropathies, i.e., rheumatoid arthritis
-
-
Osteophyte formation, bone repair or
sclerosis, osteopenia, protrusio acetabuli, cystic changes,
calcification, and enthesopathy are useful differentiating features. -
Key features of common arthropathies
P.187
| Condition | Image Features |
|---|---|
| Rheumatoid arthritis | Bilateral symmetric axial joint space narrowing Osteopenia Small erosions Cystic changes Protrusio acetabuli No osteophytes |
| Ankylosing spondylitis | Bilateral symmetric axial narrowing Osteopenia Ankylosis |
| Calcium pyrophosphate dihydrate deposition disease | Bilateral asymmetric axial narrowing Cartilage calcification Degenerative disease with multiple subchondral cysts and osteophytes |
| Synovial chondromatosis | Joint space normal or widened early scalloping at head–neck junction Joint ossifications Confirm with conventional or MR arthrography |
| Pigmented villonodular synovitis | Joint space normal or widened early erosive changes Increased soft tissue density or masses MRI confirms diagnosis |
| Septic arthritis | Osteopenia Uniform rapid joint space narrowing with pyogenic infections Gradual joint space narrowing with tuberculosis or atypical mycobacterial infections |
P.188
 |
|
FIGURE 4-39 Normal AP view of the hip with joint spaces marked (black lines). Narrowing may occur medially (M), axially (A), or superolaterally (SL).
|
 |
|
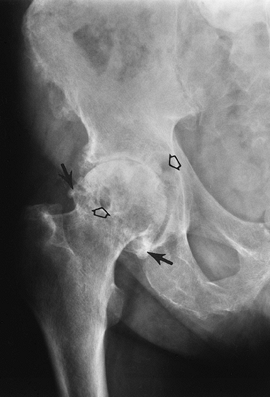
FIGURE 4-40 Degenerative arthritis. AP radiograph of the right hip shows superolateral joint space narrowing, marginal osteophytes (arrows), and subchondral geodes (open arrows). There is bone sclerosis in the femoral head.
|
P.189
 |
|
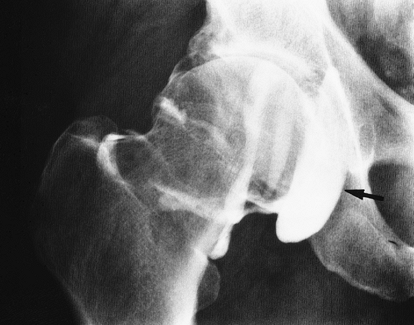
FIGURE 4-41 Degenerative arthritis. AP arthrogram shows superolateral joint space narrowing with a large communicating iliopsoas bursa (arrow).
|
 |
|
FIGURE 4-42 Pigmented villonodular synovitis. Coronal T1-weighted image demonstrates erosion (arrow) of the head–neck junction with lobulated low signal intensity in the capsule.
|
P.190
 |
|
FIGURE 4-43
Synovial chondromatosis. Axial T2-weighted image demonstrates a high-signal intensity joint effusion with small low-signal intensity structures throughout the joint (arrowheads). |
Suggested Reading
Brower AC. Arthritis in black and white. 2nd ed. Philadelphia: WB Saunders; 1997:105–122.
Resnick
D. Patterns of migration of the femoral head in osteoarthritis of the
hip. Roentgenographic-pathologic correlation and comparison with
rheumatoid arthritis. AJR Am J Roentgenol 1975;124:62–74.
D. Patterns of migration of the femoral head in osteoarthritis of the
hip. Roentgenographic-pathologic correlation and comparison with
rheumatoid arthritis. AJR Am J Roentgenol 1975;124:62–74.
P.191
Arthropathies: Sacroiliac Joints
Key Facts
-
Sacroiliac joint consists of a true synovial joint (anterior inferior 50% to 67% of joint) and ligamentous attachments.
-
Joint space abnormalities include
-
Widening and irregularity—infection, subchondral resorption with hyperparathyroidism, and renal osteodystrophy
-
Narrowing—rheumatoid arthritis
-
Erosions—inflammatory arthropathies
-
Sclerosis—osteoarthritis, calcium pyrophosphate deposition disease
-
Ankylosis—spondyloarthropathies
-
-
Distribution is a useful diagnostic criterion.
Condition Features Ankylosing spondylitis Bilateral symmetric irregularity or ankylosis Psoriatic arthritis Bilateral asymmetric erosions or ankylosis Reiter syndrome Bilateral asymmetric with erosions or ankylosis Inflammatory bowel Bilateral symmetric involvement disease Rheumatoid arthritis Bilateral symmetric joint space narrowing Infection Unilateral erosions -
Routine radiographs usually are diagnostic. CT and/or MRI are useful in selected cases.
P.192
 |
|
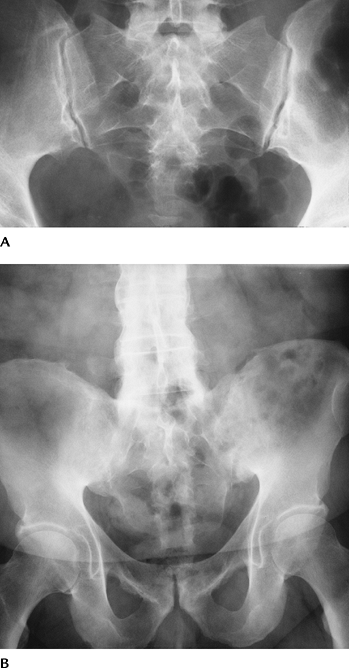
FIGURE 4-44 (A) Normal sacroiliac joints. (B) Bilateral sacroiliac ankylosis and spine changes of ankylosing spondylitis.
|
Suggested Reading
Braunstein EM, Martel W, Moidel R. Ankylosing spondylitis in men and women. A clinical and radiologic comparison. Radiology 1982;144:91–94.
Brower AC. Arthritis in black and white. 2nd ed. Philadelphia: WB Saunders; 1997:155–174.
P.193
Infection
Key Facts
-
Infections may involve the osseous structures, articulations, or soft tissues of the pelvis, hips, and thighs.
-
Osteomyelitis may be hematogenous,
posttraumatic, or postsurgical, or attributable to extension from
adjacent soft tissue infection. -
Joint space infections may result from adjacent osteomyelitis, previous surgery, or invasive procedures.
-
Soft tissue infections usually are the result of puncture wounds, previous trauma, or surgical procedures.
-
Imaging of the suspected infection varies with the site and clinical features.
-
Radiographs: Significant bone loss or cartilage loss is required before radiographs are positive.
-
Radionuclide scans are sensitive but not specific, and there is less differentiation between bone and soft tissue.
-
MRI is the technique of choice for early
detection of bone, joint, or soft tissue infection. We routinely add
fat-suppressed T1-weighted images after contrast. Needle aspiration or
bone biopsy may be required to isolate organisms.
-
P.194
 |
|
FIGURE 4-45 Greater trochanteric abscess. (A) Oblique radiograph shows a lucent area in the greater trochanter (arrows). (B)
Coronal fat-suppressed T1-weighted image after gadolinium enhancement demonstrates an irregular lesion with peripheral enhancement. |
Suggested Reading
Gold RH, Hawkins RA, Katz RD. Bacterial osteomyelitis findings on plain radiographs, CT, MR, and scintigraphy. AJR Am J Roentgenol 1991;157:365–370.
Resnick D. Osteomyelitis, septic arthritis, and soft tissue infections: Mechanisms and situations. In: Resnick D, ed. Diagnosis of bone and joint disorders. Philadelphia: WB Saunders; 2002:2377–2480.
P.195
Pediatric Hip Disorders: Legg-Calvé-Perthes Disease
Key Facts
-
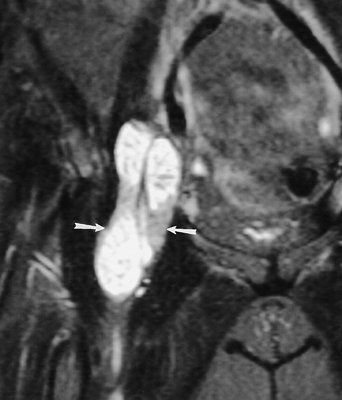
Legg-Calvé-Perthes disease is an ischemic disorder of the femoral head commonly seen in males aged 3 to 12 years.
-
Most patients present between 5 and 8 years of age; 15% are bilateral.
-
Patients present with pain and Trendelenburg gait.
-
Radiographic features (AP and frog-leg oblique views)
-
Initial features include a small capital
femoral epiphysis and joint space widening. Lucent or necrotic areas
may be evident in the epiphysis on frog-leg views. MRI may be
confirmatory at this stage. -
Collapse of the femoral head and fragmentation occur in the next stage.
-
Reparative stage with return to normal bone density.
-
Remodeling of the femoral head and neck.
-
-
MRI
-
Useful for early evaluation of unossified or partially ossified epiphysis.
-
Physeal involvement more easily assessed.
-
Preoperative evaluation of femoral head position and acetabular coverage.
-
-
Classifications systems
-
Catterall classification based on extent of femoral head involvement on AP radiographs:
-
Group I: ≤25% of femoral head involved
-
Group II: 25% to 50% of femoral head involved
-
Group III: 50% to 75% of femoral head involved
-
Group IV: 100% of femoral head involved
-
-
Herring classification based on radiographic height of epiphysis
-
Group A: normal height
-
Group B: 50% of normal height
-
Group C: less than 50% of normal height
-
-
-
Treatment
-
Most do well with conservative therapy.
-
Surgical or nonsurgical repositioning of the femoral head using braces or femoral or acetabular osteotomies.
-
P.196
P.197
 |
|
FIGURE 4-46 Legg-Calvé-Perthes Disease. (A)
Radiograph shows the right capital epiphysis is 100% involved (Catterall group IV) with greater than 50% loss of height (Herring group C). (B) Several years later the epiphysis is still flat and irregular. Fat planes (arrows) are displaced because of a joint effusion. (C) Four years later the physis is closed with flattening and widening of the femoral head and neck on the right. |
P.198
 |
|
FIGURE 4-47 Coronal T1- (A) and T2- (B)
weighted images in an older child with Legg-Calvé-Perthes Disease on the right. There is an effusion on the right and central necrosis of the epiphysis. Note the uncovered femoral head by the labrum on the right compared with the left (white lines). |
P.199
Suggested Reading
Catterall A. Legg-Calvé-Perthes disease. RSNA Instructional Course Lecture. Chicago, Illinois, 1989;9:19–22.
Hochbergs
P, Echewall G, Egund N, et al. Femoral head shape in Legg-Calvé-Perthes
disease. Correlation between conventional radiography, arthrography,
and MR imaging. Acta Radiol 1994;35:545–548.
P, Echewall G, Egund N, et al. Femoral head shape in Legg-Calvé-Perthes
disease. Correlation between conventional radiography, arthrography,
and MR imaging. Acta Radiol 1994;35:545–548.
Weishaupt
D, Exner GU, Hilfiker PR, et al. Dynamic MR imaging of the hip in
Legg-Calvé-Perthes disease: Comparison with arthrography. AJR Am J Roentgenol 2000;174:1635–1637.
D, Exner GU, Hilfiker PR, et al. Dynamic MR imaging of the hip in
Legg-Calvé-Perthes disease: Comparison with arthrography. AJR Am J Roentgenol 2000;174:1635–1637.
P.200
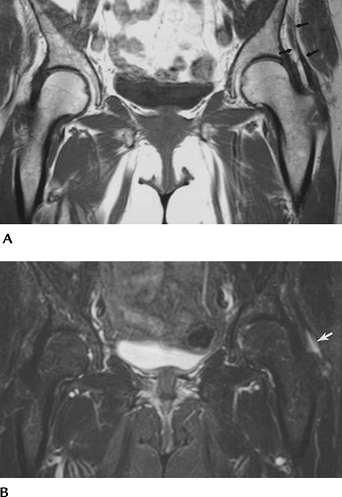
Pediatric Hip Disorders: Developmental Dysplasia of the Hip
Key Facts
-
Developmental dysplasia of the hip is
more common in females than males (5:1 to 9:1, respectively) and is
more common in whites than African Americans. Up to 33% of cases are
bilateral. -
Cause is related to ligament laxity, intrauterine position, high levels of maternal estrogen, and hereditary considerations.
-
Joint laxity in newborns is common, so diagnosis is difficult before 2 to 4 weeks of age.
-
Early detection and reduction can result in normal development in 95% of cases.
-
-
Imaging approaches
-
Ultrasound—to access clinically suspected
subluxation/dislocation. Ultrasound is most useful until femoral head
ossifies at 6 months (normal ossification 2 to 6 months in females, 3
to 7 months in males). Evaluate femoral head size and position,
acetabular roof, and joint stability. -
Radiographs (AP and frog-leg
obliques)—smaller femoral ossification center, superolateral
displacement of femur. Acetabular angle: normal 28 degrees at birth
decreasing to 22 degrees by 1 year ± 5 degrees. Angle is increased in
dysplastic hips (Fig. 4-48A). Shenton line
forms a smooth arc along the superior pubic ramus and femoral neck in
the normal hip. The arc is interrupted in dysplastic hips (Fig. 4-48A).
Features become more obvious with age. Perkin line is perpendicular to
Hilgenreiner line (line through triradiate cartilage). This divides the
hip into quadrants. The femoral head or medial metaphyseal beak should
lie in the inferior medial quadrant (Fig. 4-48B). -
MRI—useful for identification of
unossified femoral head, labrum, and acetabular structures.
Complications such as AVN can be identified.
-
P.201
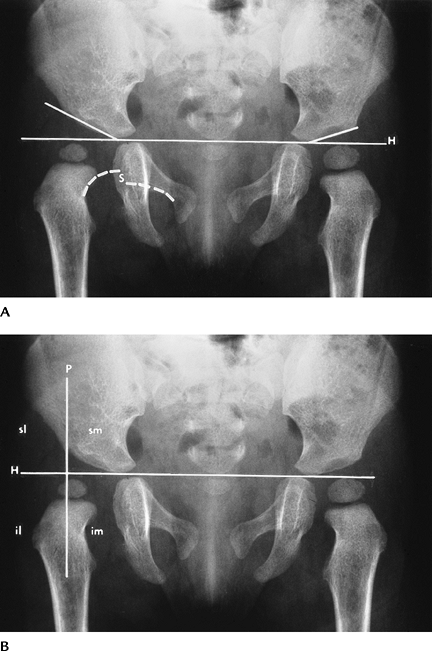 |
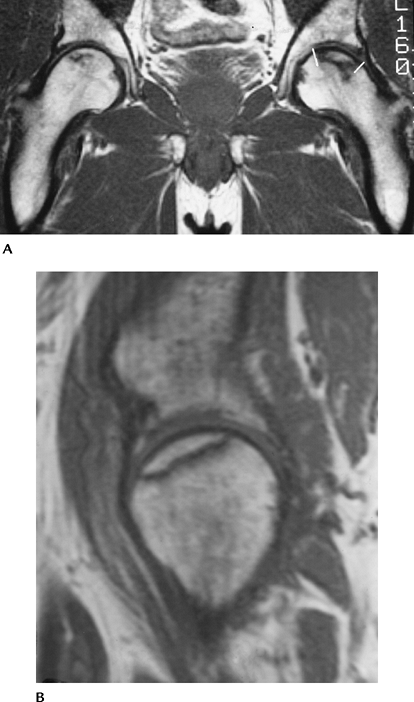
|
FIGURE 4-48 AP radiographs (A,B) demonstrating developmental dysplasia on the right. The acetabular angle (line
along acetabulum to Hilgenreiner line [H]) is increased and the hip is displaced superolaterally with interruption of Shenton line (S) (broken white lines). The femoral head should lie in the inferomedial (im) quadrant. Four quadrants (im, inferomedial; il, inferolateral; sl, superolateral; sm, superomedial) are formed by a line (Perkins line) at the acetabular margin perpendicular to Hilgenreiner line. The femoral head is out of the im quadrant in (B). |
P.202
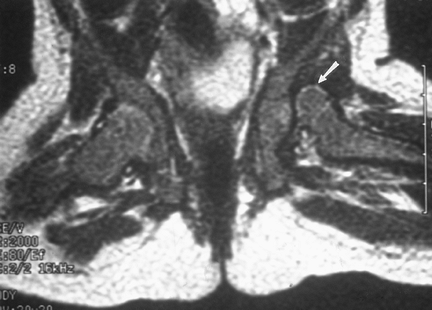 |
|
FIGURE 4-49 MR image in the frog-leg position shows dislocation of the left hip (arrow).
|
 |
|
FIGURE 4-50 Coronal T2-weighted image with developmental hip dysplasia on the right. The medial joint space is widened (open arrow). The labrum is well demonstrated (arrow), and the femoral head is less well covered compared with the left hip.
|
Suggested Reading
Hubbard
AM, Dormans JP. Evaluation of developmental dysplasia, Perthe’s
disease, and neuromuscular dysplasia of the hip before and after
surgery: An imaging update. AJR Am J Roentgenol 1995;164:1062–1073.
AM, Dormans JP. Evaluation of developmental dysplasia, Perthe’s
disease, and neuromuscular dysplasia of the hip before and after
surgery: An imaging update. AJR Am J Roentgenol 1995;164:1062–1073.
Weinstein SL, Mubarak SJ, Wenger DR. Developmental hip dysplasia and dislocation. J Bone Joint Surg 2003;85A:2024–2035.
P.203
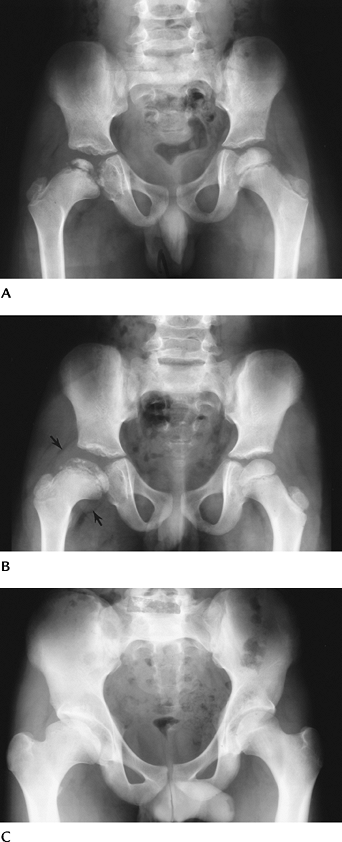
Pediatric Hip Disorders: Slipped Capital Femoral Epiphysis
Key Facts
-
Slipped capital femoral epiphysis (SCFE)
is the most common adolescent hip disorder. It frequently leads to
early osteoarthritis. -
SCFE is twice as common in males than females.
-
Males present at ages 10 to 17 years
(most common 13 to 14 years) and females present at 8 to 15 years (most
common 11 to 12 years). African Americans are affected more commonly
than whites. -
The condition is bilateral in 23% to 81%.
-
Patients present with pain and a limp.
-
Classification of SCFE is based on clinical and radiographic criteria:
-
Pre-slip: Weakness with thigh or knee pain. Radiographs of slight physeal widening.
-
Acute: Slip of capital epiphysis is mild, moderate, or severe, depending on displacement.
-
Chronic: Displaced femoral head with remodeling and degenerative joint disease
-
Imaging evaluation
-
Radiographs
-
Posterior displacement is most common initially (99%).
-
Medial displacement occurs commonly.
-
Signs of slipped epiphysis include
-
Osteopenia
-
Irregular or widened physis
-
A line drawn along the lateral femoral
neck should intersect the capital epiphysis so that one sixth of the
head lies lateral to the line on an AP radiograph. -
Femoral head should be symmetrically positioned to the metaphysis on the frog-leg view.
-
-
CT/MRI
-
Useful for early physeal changes and articular anatomy in selected cases.
-
-
Treatment—pin fixation
-
Complications—osteoarthritis, chondrolysis, and AVN
P.204
 |
|
FIGURE 4-51 AP (A) and oblique frog-leg views (B,C) of a slipped capital femoral epiphysis on the left. AP view (A) shows osteopenia and widening of the physis (arrows). Note the line along the lateral neck does not intersect the ossified epiphysis. The right hip (B) is normal. The displacement of the capital epiphysis on the metaphysis (lines) is obvious on the frog-leg oblique view (C).
|
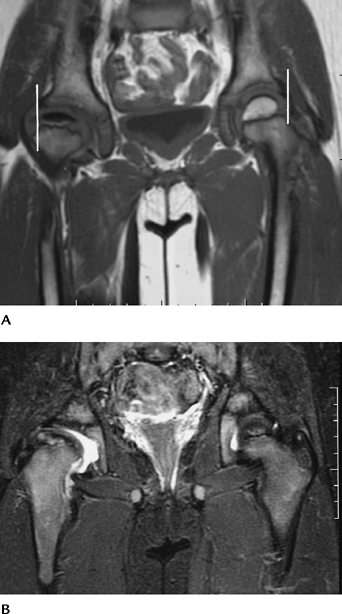
P.205
 |
|
FIGURE 4-52 Coronal T1-weighted image of a slipped capital femoral epiphysis on the left (arrow).
|
Suggested Reading
Boles CA, El-Khoury GY. Slipped capital femoral epiphysis. Radiographics 1997;17:809–823.
Futami
T, Suzuki S, Seto Y, et al. Sequential magnetic resonance imaging in
slipped capital femoral epiphysis: Assessment of preslip of the
contralateral hip. J Pediatr Orthop 2001;10:298–303.
T, Suzuki S, Seto Y, et al. Sequential magnetic resonance imaging in
slipped capital femoral epiphysis: Assessment of preslip of the
contralateral hip. J Pediatr Orthop 2001;10:298–303.
Umans
H, Lieblings MS, Moy L, et al. Slipped capital femoral epiphysis: A
physeal lesion diagnosed by MRI with radiographic and CT correlation. Skel Radiol 1998;27:139–144.
H, Lieblings MS, Moy L, et al. Slipped capital femoral epiphysis: A
physeal lesion diagnosed by MRI with radiographic and CT correlation. Skel Radiol 1998;27:139–144.
P.206
Pediatric Hip Disorders: Rotational/Orientation Abnormalities: Coxa Vara And Coxa Valga
Key Facts
-
The normal angle between the femoral neck
and shaft is 150 degrees at birth. The angle decreases to 120 to 135
degrees in adults. -
Coxa vara is reduced at neck-shaft angle.
-
Congenital because of abnormal limb position. Minimal progression after birth.
-
Acquired from trauma, tumors, dysplasias, and osteopenia.
-
Acquired coxa vara is bilateral in 50% of cases. Changes lead to minimal leg length discrepancy.
-
-
Coxa valga is an increased neck-shaft angle.
-
Usually the result of neuromuscular disorders (i.e., polio, cerebral palsy)
-
 |
|
FIGURE 4-53 Normal femoral neck angle (lines) seen on AP radiograph.
|
P.207
 |
|
FIGURE 4-54
Coxa vara. AP view of the hips in a patient with healed slipped capital femoral epiphyses showing a decreased femoral neck angle (lines). |
 |
|
FIGURE 4-55 Coxa valga. Child with thalassemia and increased femoral neck angle (lines).
|
P.208
Pediatric Hip Disorders: Rotational/Orientation Abnormalities: Femoral Anteversion
Key Facts
-
Femoral anteversion is the angle formed between a line drawn along the axis of the femoral neck and distal condylar orientation.
-
Femoral anteversion is 32 degrees at birth and decreases to 16 degrees at age 16 years and older.
-
An increased angle is seen in children with hip dysplasia and cerebral palsy.
-
Retroversion or a decreased angle may lead to slipped capital femoral epiphysis.
-
Imaging can be accomplished using selected CT or MRI of the femoral head and neck and femoral condyles.
P.209
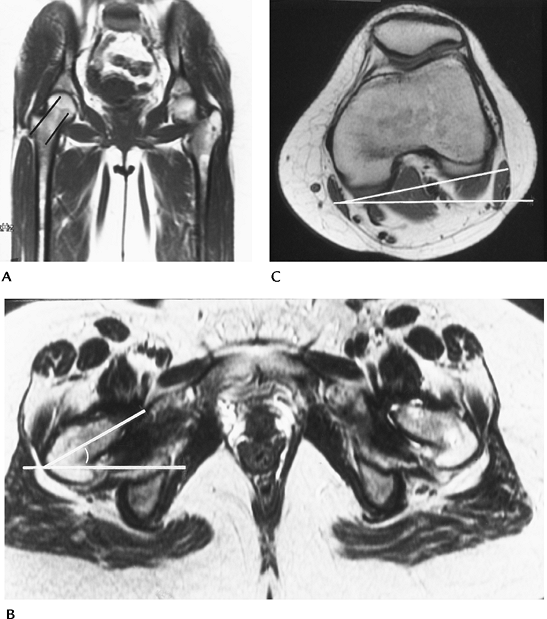 |
|
FIGURE 4-56 Femoral anteversion measurement. (A) Coronal MR image demonstrating oblique angle for axial images (lines). (B) Axial image of the hips with line through the plane of the neck and horizontal line forming the angle. (C)
Axial image of the knee. A line is drawn along the posterior condyles and the angle formed by the horizontal line. If the knee is externally rotated, as in this case, the knee angle is subtracted from the axial femoral angle. If the knee is internally rotated, the angle is added to the femoral angle to measure the degree of anteversion. |
Suggested Reading
Tomozak
RJ, Guenther DP, Rieber A, et al. MR imaging measurement of the femoral
anteversion angle as a new technique. Comparison with CT in children
and adults. AJR Am J Roentgenol 1997;168:791–794.
RJ, Guenther DP, Rieber A, et al. MR imaging measurement of the femoral
anteversion angle as a new technique. Comparison with CT in children
and adults. AJR Am J Roentgenol 1997;168:791–794.