
-
Radiographs are essential for evaluating bone tumors and some soft-tissue tumors.
-
MR imaging features are usually nonspecific in differentiating benign from malignant processes.
-
MR imaging is important in the evaluation of tumor extent, staging, and response to therapy.
-
Gadolinium administration is useful in the evaluation of nonenhancing necrotic or hemorrhagic tumor components.
 |
|
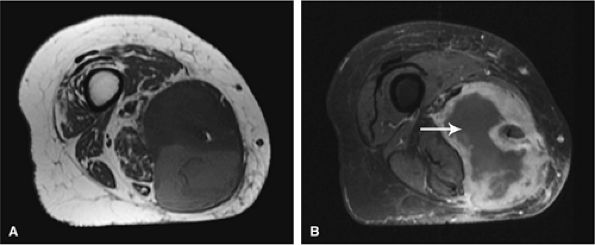
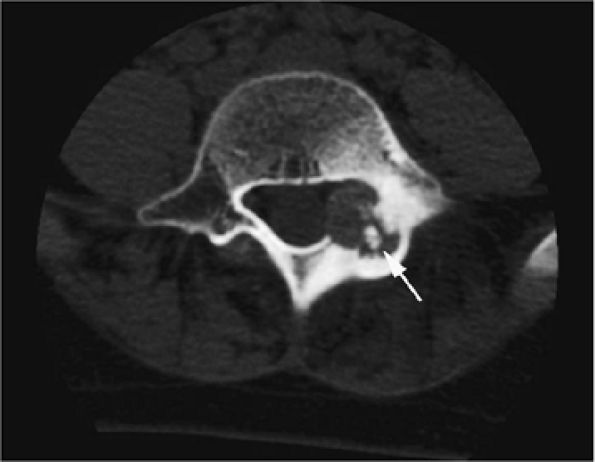
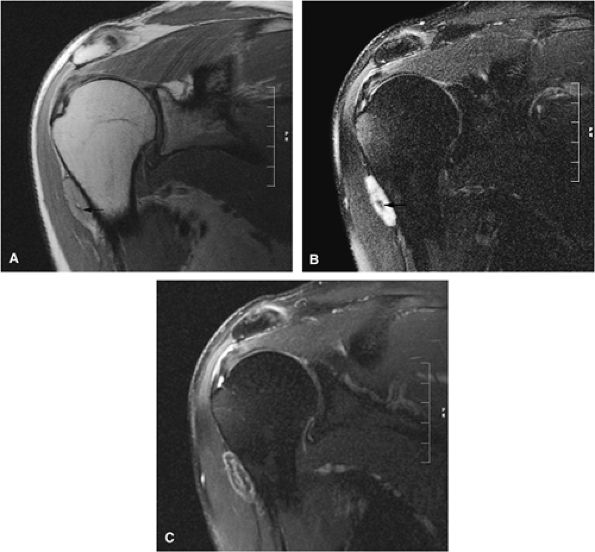
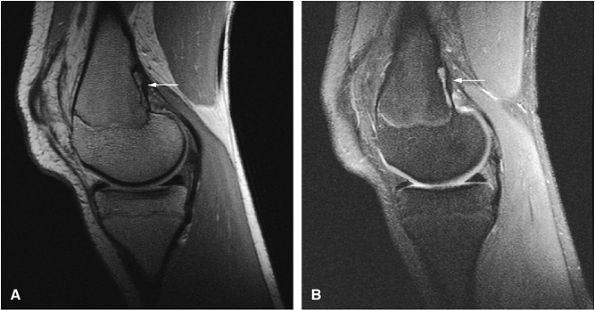
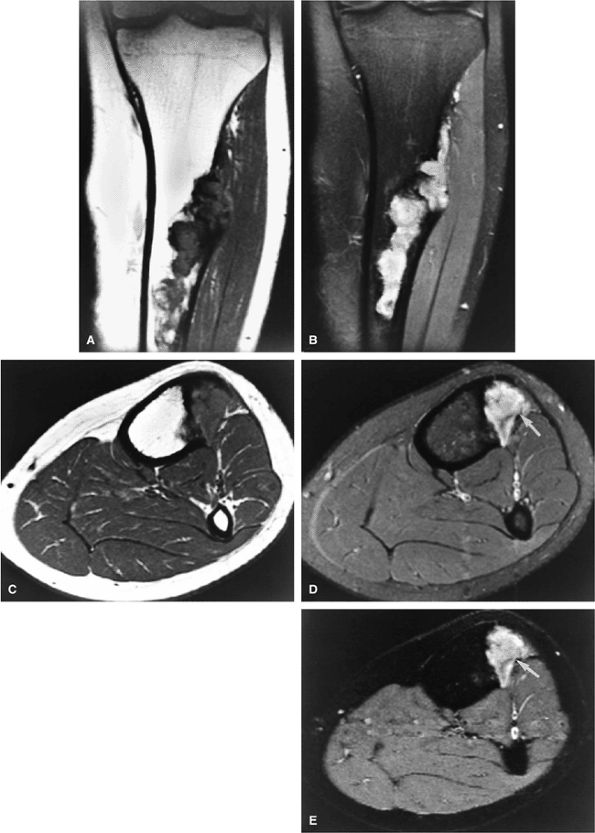
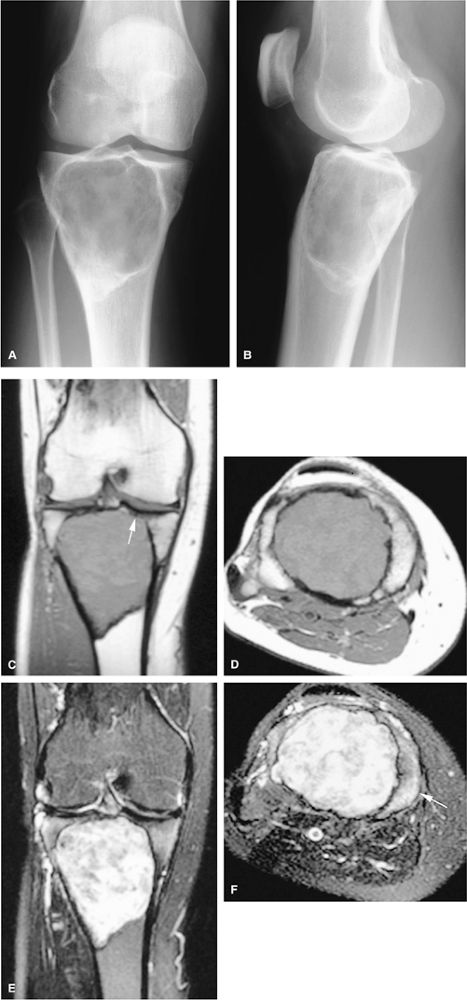
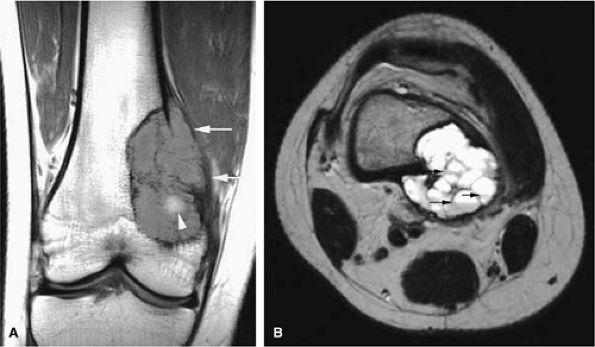
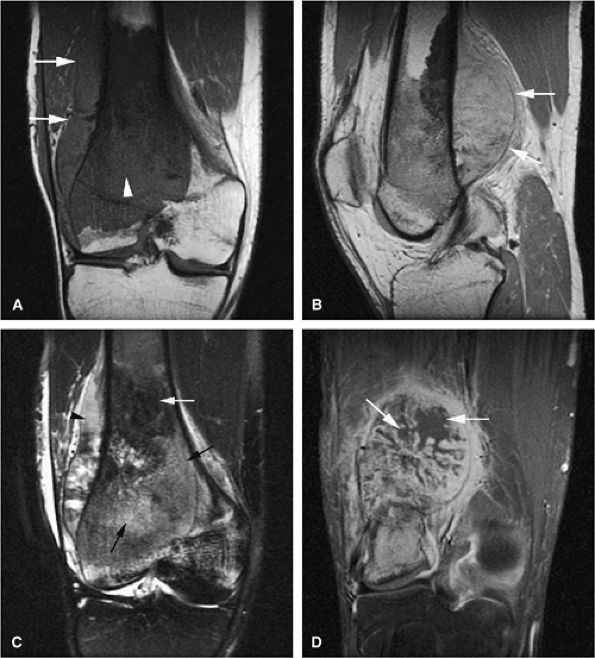
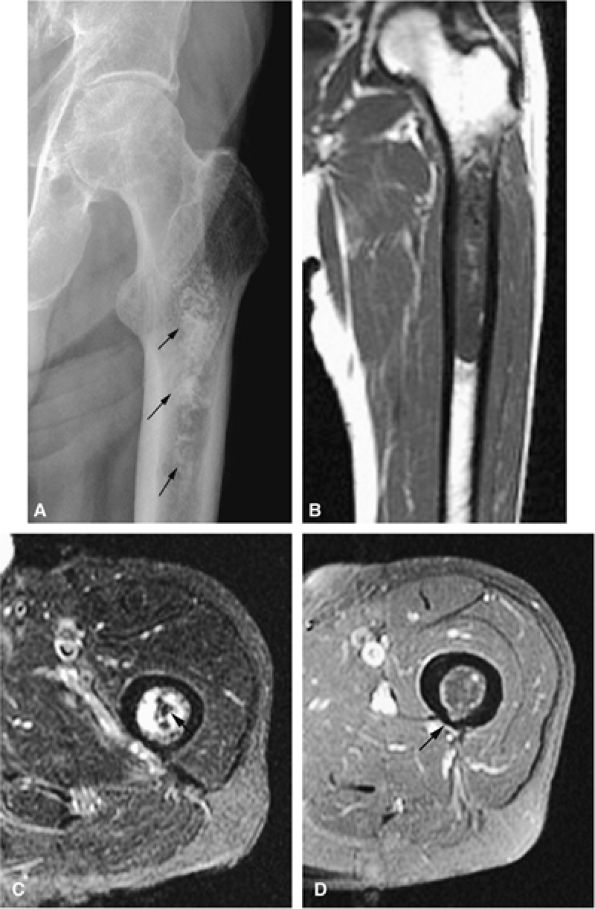
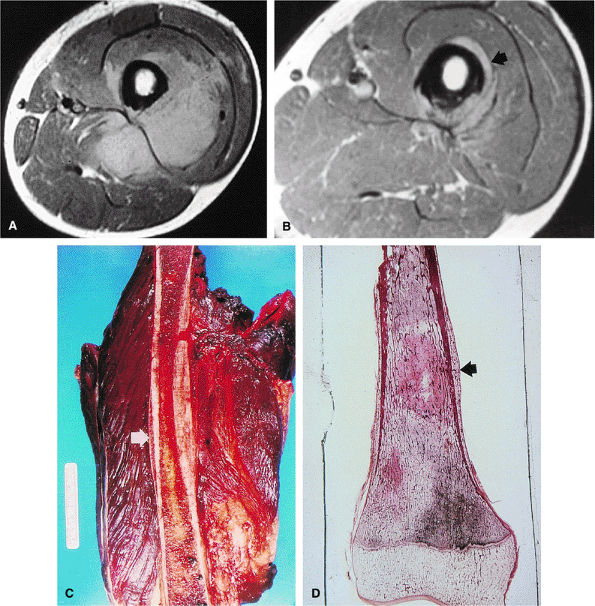
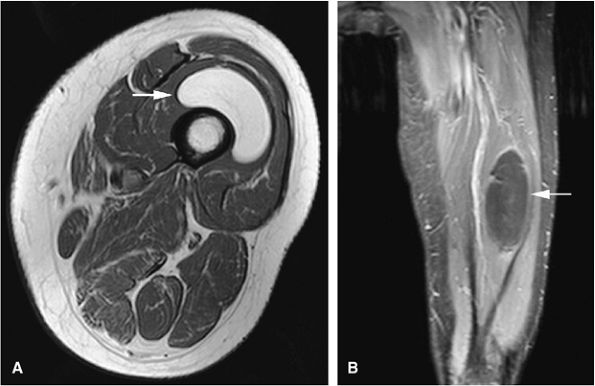
FIGURE 14-1 ● T1-weighted images (A) before and (B) after intravenous gadolinium administration show malignant fibrous histiocytoma. The tumor enhances after intravenous injection of gadolinium. Central tumor necrosis remains unenhanced (arrow).
|
-
T1-weighted images provide excellent contrast for identification of marrow, cortical, and soft-tissue involvement. In particular, T1-weighted images allow differentiation between fat and tumor, as well as definition of muscle planes and separate anatomic compartments.
-
Gadolinium has been used to enhance contrast on T1-weighted images to better characterize osseous and soft-tissue tumor involvement.2,7,15,22,23,24 On gadolinium-enhanced images, nonenhancing regions are thought to represent areas of nonviable tumor or necrosis (Fig. 14-1). Gadolinium-enhanced images may also be useful for differentiating peritumoral edema from underlying tumor and recurrent tumor from scar or fibrosis.25
-
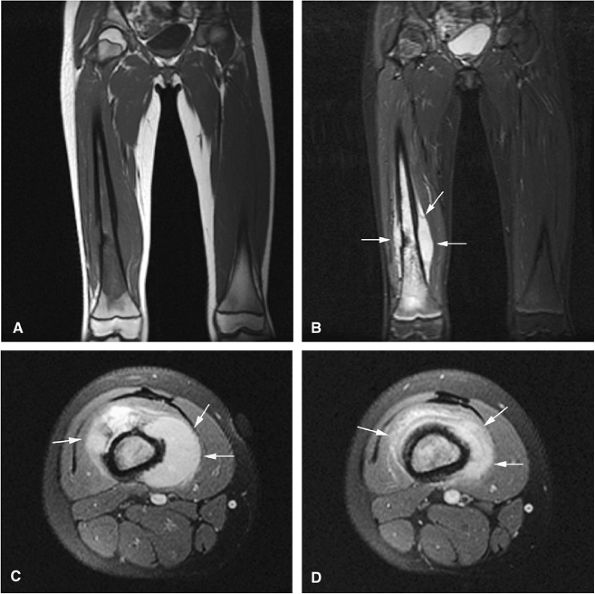
Dynamic contrast-enhanced MR imaging has been used to determine response to chemotherapy. In patients who respond to chemotherapy, MR images show a reduction in enhancement, whereas patients who do not respond show little or no reduction. Dynamic contrast-enhanced MR images should be acquired in short time intervals, since reactive changes may show contrast enhancement indistinguishable from that of tumor in the later phases of enhancement.23,26,27 Subtraction MR imaging has been used to increase the detection of early arterial enhancement of residual tumor.27
-
T2-weighted images are valuable in distinguishing muscle from tumor and can increase diagnostic specificity in evaluating marrow infiltration, seen as areas of low signal intensity on T1-weighted images.
and pathology in question, certain general guidelines can be followed:
 |
|
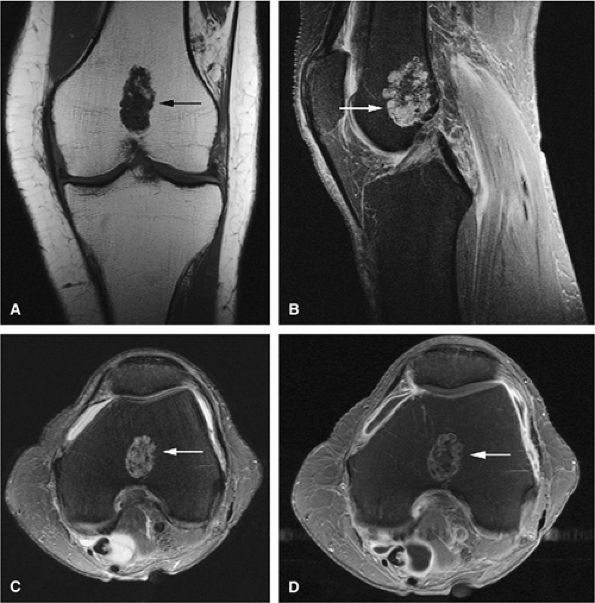
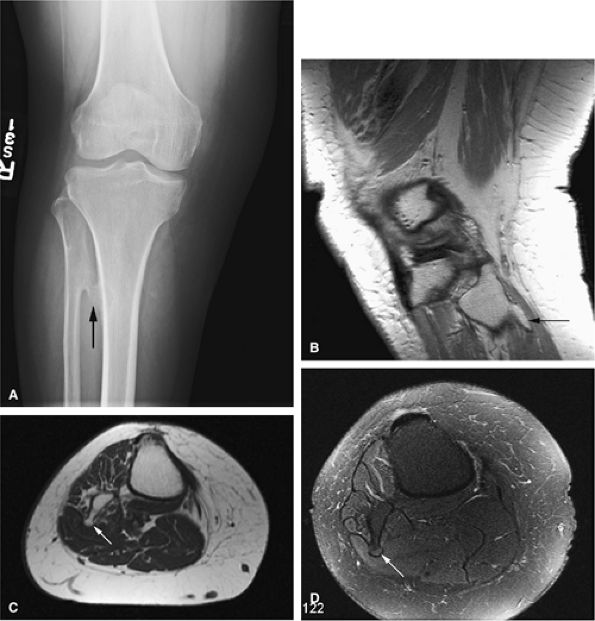
FIGURE 14-2 ● Osteosarcoma of the distal tibia is seen on a sagittal proton density-weighted image. Cortical thinning and periosteal reaction are demonstrated (arrow).
|
 |
|
FIGURE 14-3 ● Chondrosarcoma of the proximal femoral shaft is seen on a coronal T1-weighted image. Cortical thickening (arrow) demonstrates low signal intensity on the T1-weighted image.
|
-
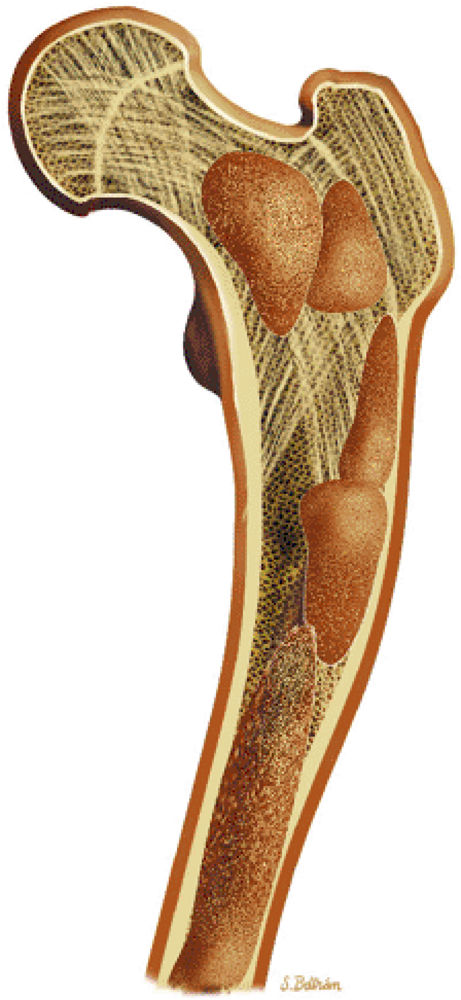
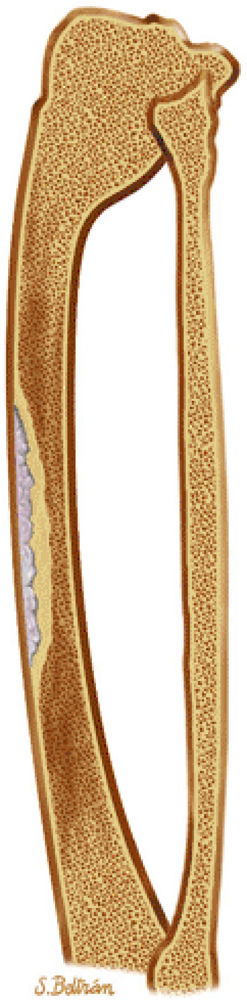
The longitudinal extent of tumors can be seen on T1-weighted coronal or sagittal images.
-
If a lesion is difficult to differentiate from (i.e., is isointense with) adjacent tissues, a conventional T2, fat-suppressed T2-weighted fast spin-echo, fat-suppressed proton density-weighted fast spin-echo, or STIR sequence should be obtained.
-
T1- and T2-weighted images (including fat-suppressed T2-weighted fast spin-echo or STIR sequences) in the axial plane provide the most important images in delineating the relationship of a tumor to adjacent neurovascular structures and compartments—essential information in preoperative limb-salvage planning.
-
The proximal and distal extent of tumor involvement can be assessed by evaluating multiple axial sections.
-
The region of abnormality should be positioned as close to the center of the coil as possible.
-
The patient—s position (prone or supine) is determined by the area of abnormality.
-
Prior to imaging the region of interest, a large field-of-view localizer using an increased-diameter surface coil or body coil may be necessary to include skin lesions or to accurately determine the proximal and distal extension of a large mass.
-
MR spectroscopy using phosphorus-31 or protons has been used to improve lesion characterization and to evaluate response to therapy.28,29 It is not, however, routinely used in most clinical settings. This technique is limited by the difficulty of obtaining representative spectra in all locations of the tumor and by contamination of tumor spectra with adjacent soft tissues.
 |
|
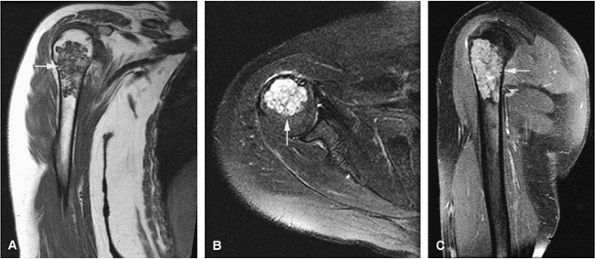
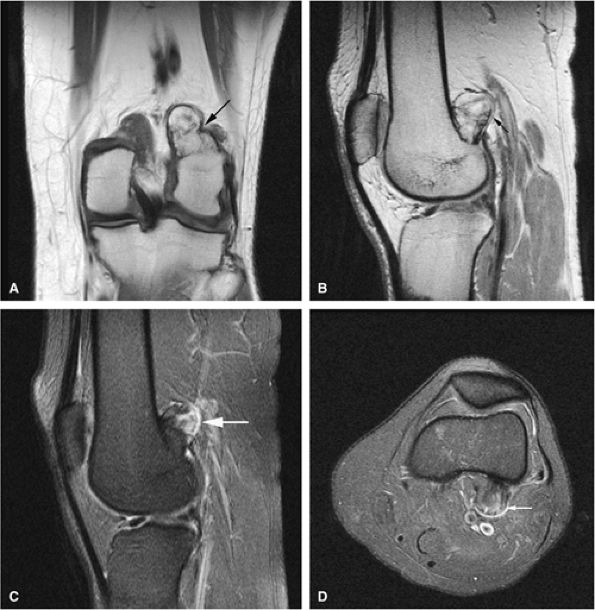
FIGURE 14-4 ● Sagittal fat-suppressed T2-weighted fast spin-echo image demonstrates chondrosarcoma of the humeral shaft. Histologically confirmed hyperintense subcortical tumor infiltration (arrow) is identified.
|
-
MR imaging is the method of choice in staging musculo-skeletal neoplasms.
-
MR images should be read in conjunction with radiographs.
-
MR imaging is accurate in determining the local extent of tumor and involvement of muscle compartments, joints, and neurovascular bundles.
-
Evaluation of intra- and extraosseous extent, joint invasion, neurovascular bundle involvement, skip metastases, and local adenopathy as well as distant metastases is important for accurate staging and subsequent therapy.
-
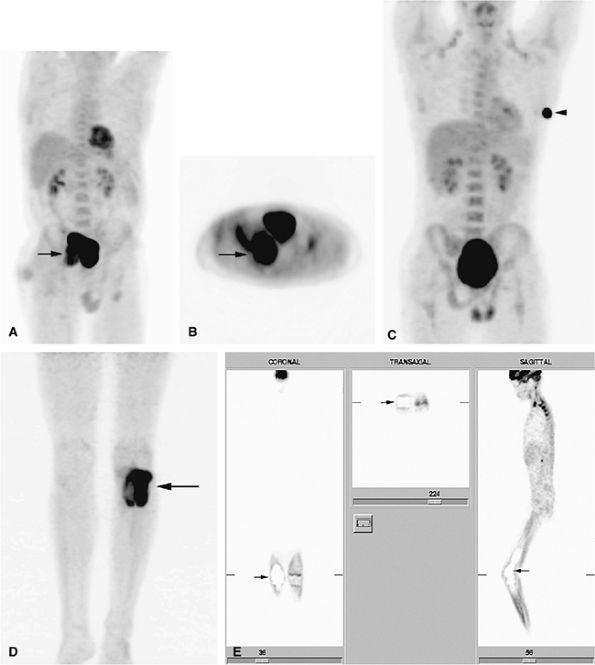
Consider FDG-PET for staging and evaluation of therapy response in equivocal cases.
 |
|
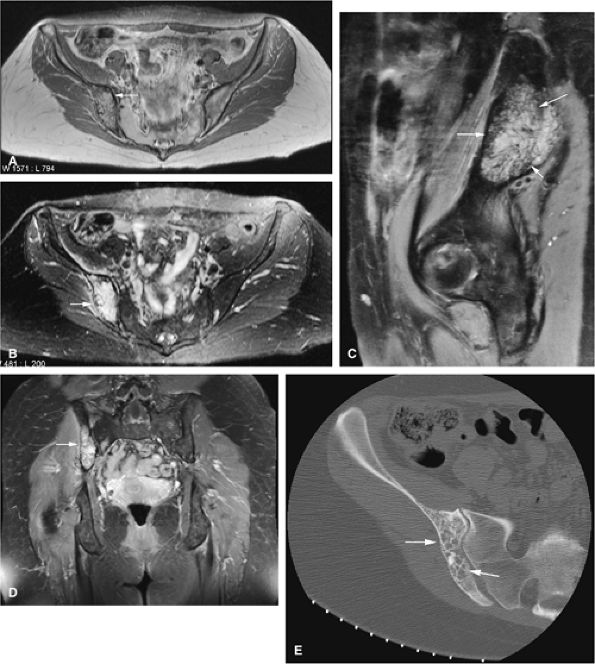
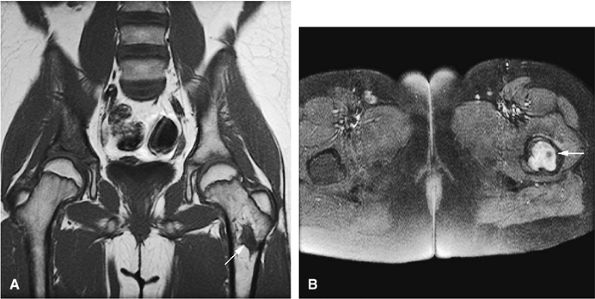
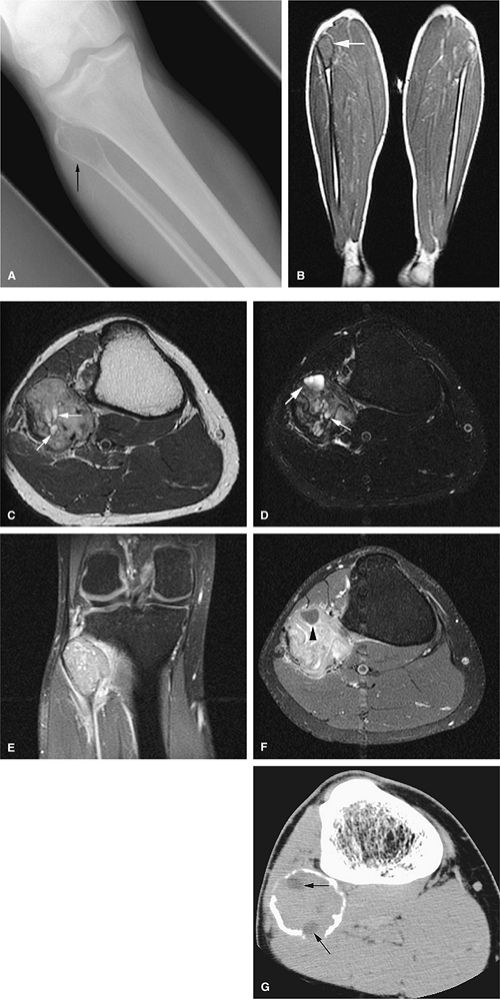
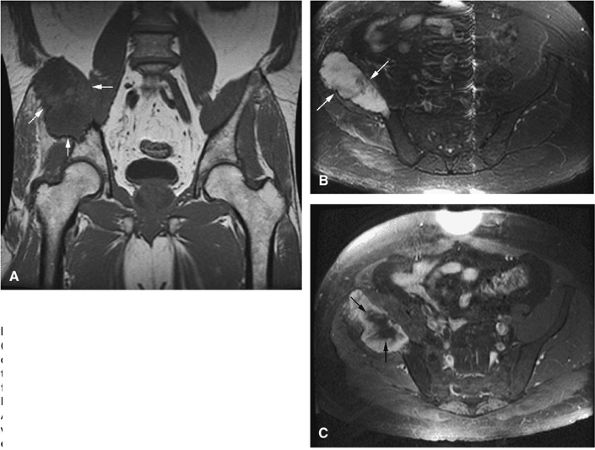
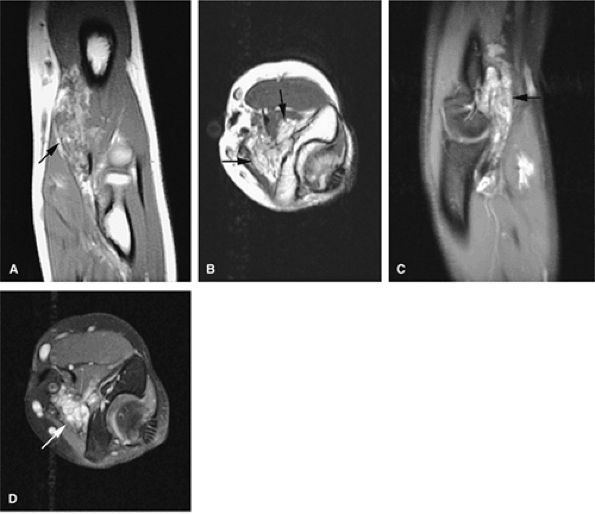
FIGURE 14-5 ● FDG-PET in the evaluation of patients with sarcomas. Whole-body FDG-PET scan (A) and corresponding axial image (B) in a patient with neurofibromatosis type 1 demonstrates a region of intense FDG uptake in the right buttock area (arrow), which was found to represent a malignant peripheral nerve sheath tumor arising in a neurofibroma. (C and D) Images from a whole-body FDG PET scan in a patient with osteosarcoma show intense FDG uptake in the proximal tibia (D) in the area of the tumor (arrow). Images of the chest and abdomen demonstrate no evidence of metastatic disease. A marker was placed over the left chest wall (C) (arrowhead). (E) Coronal, axial, and sagittal images of a whole-body FDG-PET scan in a patient with osteosarcoma of the right femur. The patient underwent resection of the right femur and total knee arthroplasty. MR images and CT scans were deemed inadequate for tumor evaluation because of metallic artifact. FDG-PET scan shows a cold defect in the region of the right knee arthroplasty (arrows) and no increased FDG uptake in the area of the right femur and knee.
|
|
TABLE 14.1 ● The Enneking staging system for musculoskeletal neoplasms
|
||||||||||||||||||||||||||||||||||||||||||||||||||||||||||||||||||||||||||||||||||||
|---|---|---|---|---|---|---|---|---|---|---|---|---|---|---|---|---|---|---|---|---|---|---|---|---|---|---|---|---|---|---|---|---|---|---|---|---|---|---|---|---|---|---|---|---|---|---|---|---|---|---|---|---|---|---|---|---|---|---|---|---|---|---|---|---|---|---|---|---|---|---|---|---|---|---|---|---|---|---|---|---|---|---|---|---|
|
||||||||||||||||||||||||||||||||||||||||||||||||||||||||||||||||||||||||||||||||||||
-
MR imaging features are usually nonspecific in differentiating benign from malignant processes.
-
Benign and malignant tumors usually demonstrate low signal on T1- and high signal on T2-weighted images.
-
Infiltration of neurovascular bundles is seen more commonly in malignant tumors.
-
Both benign and malignant tumors can present with fluid–fluid levels.
-
A tumor bed with postoperative scarring demonstrates low signal intensity on both T1- and T2-weighted images (including fat-suppressed T2- or proton density-weighted fast spin-echo images).
-
If T1- and T2-weighted images show intermediate and high signal intensity, respectively, the possibility of recurrent tumor is more likely.
-
Frequently it is not possible to distinguish benign from malignant lesions of bone and soft tissue on the basis of MR signal characteristics alone. Both benign and malignant lesions may demonstrate areas of low signal intensity on T1-weighted images and increased signal intensity on T2-weighted images. Malignant lesions tend to be more extensive, involving marrow, cortical bone, and soft tissues, but these criteria do not always distinguish benign from malignant lesions. No correlations have been shown matching T1 and T2 relaxation times with corresponding histopathology.35
-
If the neurovascular bundle is involved, the lesion is likely to be malignant.
-
A fluid–fluid level is a nonspecific finding in bone and soft-tissue lesions. Tumors with fluid–fluid levels include fibrous dysplasia, simple and aneurysmal bone cysts, malignant fibrous histiocytoma, osteosarcoma, chondroblastoma, and osteoblastoma.36
-
Infectious processes (e.g., osteomyelitis) and benign neoplasms have been found to have a low-signal-intensity peripheral margin in 33% of patients.37 This margin is rarely seen in malignant lesions because a well-defined sclerotic interface is not present.
-
It is important to perform MR studies prior to biopsy to avoid postsurgical inflammation and edema, which may prolong the T2 values of uninvolved tissues.
-
Muscle edema is nonspecific and may be associated with trauma, infection, and vascular insults.
-
On T1-weighted images, high signal intensity in the surrounding musculature can be seen in atrophy with fatty infiltration or neuromuscular disorders and should not be mistaken for tumor.
-
Venous varicosities may scallop subcutaneous tissue and demonstrate low signal intensity on T1-weighted images. This appearance is characteristic and can be distinguished from neoplastic soft-tissue extension or tumor vascularity.
-
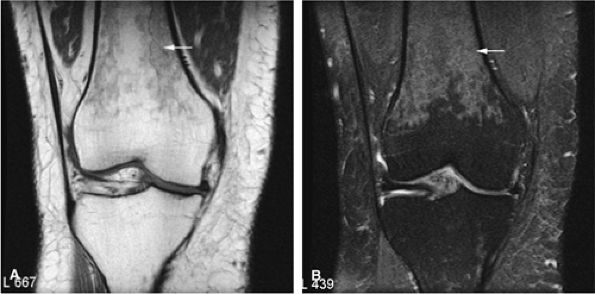
Red-to-yellow marrow conversion in middle-aged women (marrow inhomogeneity is especially common in obese women with a history of smoking) is seen in metaphyseal or diaphyseal areas of low signal intensity (i.e., red marrow) without extension into the epiphysis (Fig. 14-6). These lesions become isointense with
P.2051
adjacent marrow on heavily T2-weighted images and demonstrate increased signal intensity on STIR images. Inhomogeneity of metaphyseal red and yellow marrow may also be observed in the immature skeleton.
 |
|
FIGURE 14-6 ● Coronal T1-weighted image (A) and coronal STIR image (B) demonstrate red marrow heterogeneity (arrow) in the femoral diaphysis and metaphysis without extension across the physeal scar.
|
-
Osteoid osteomas may present with extensive marrow edema on MR imaging, obscuring the nidus, and may therefore be mistaken for osteomyelitis or malignant tumor.
-
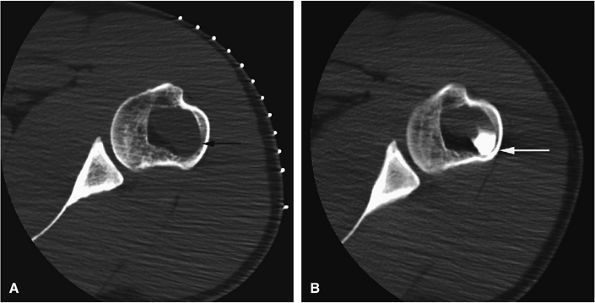
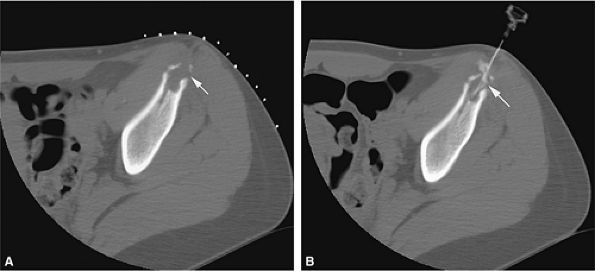
CT is most sensitive in detecting the nidus in osteoid osteomas.
-
Consider image-guided therapy for the treatment of osteoid osteomas.
-
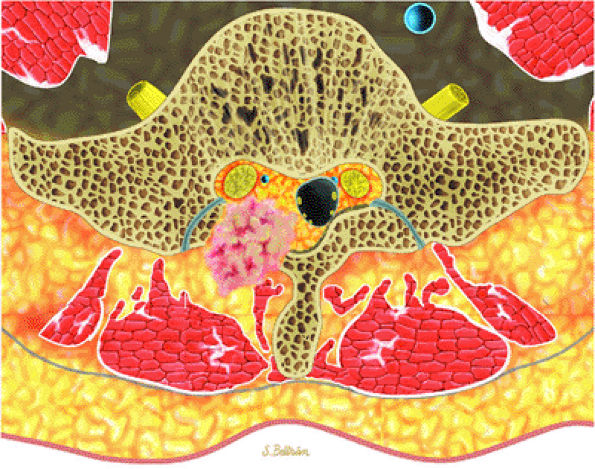
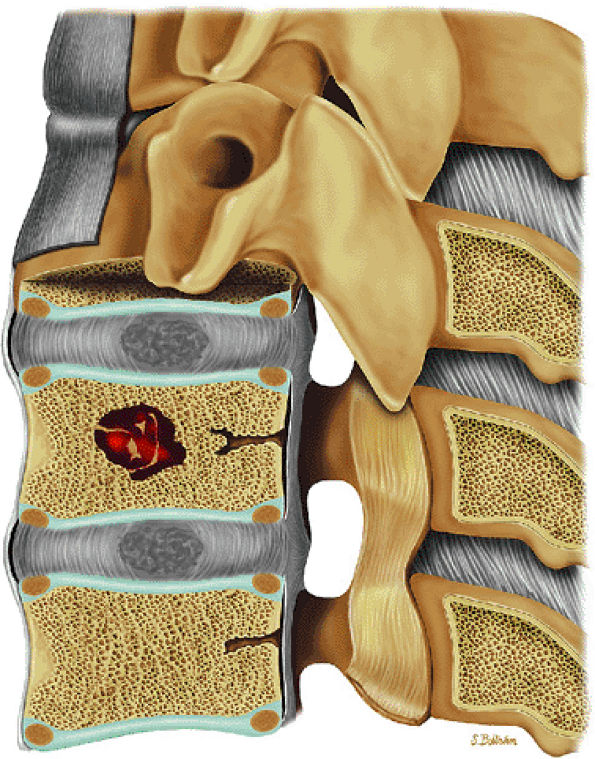
Osteoblastomas frequently involve the posterior elements of the spine.
-
Osteoblastomas can present with fluid–fluid levels.
 |
|
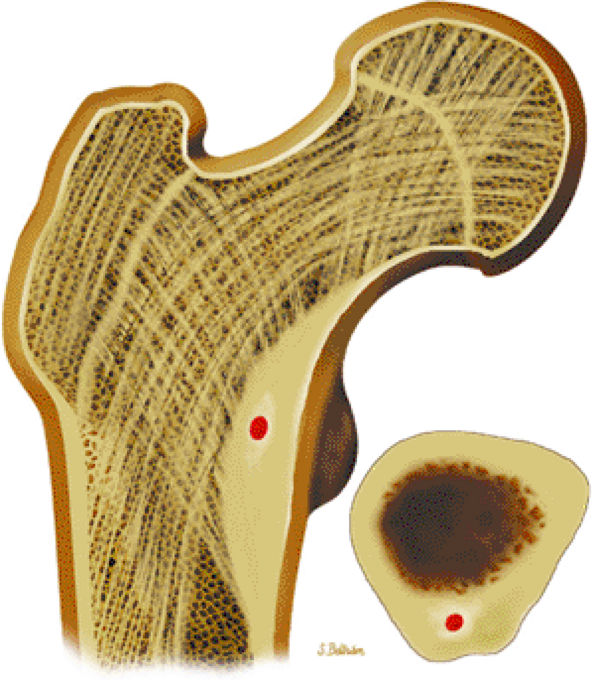
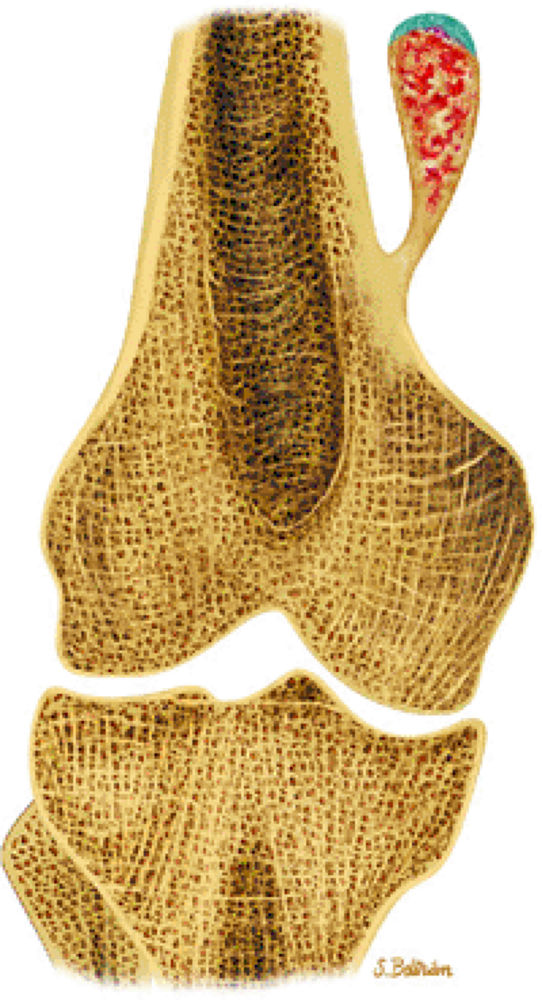
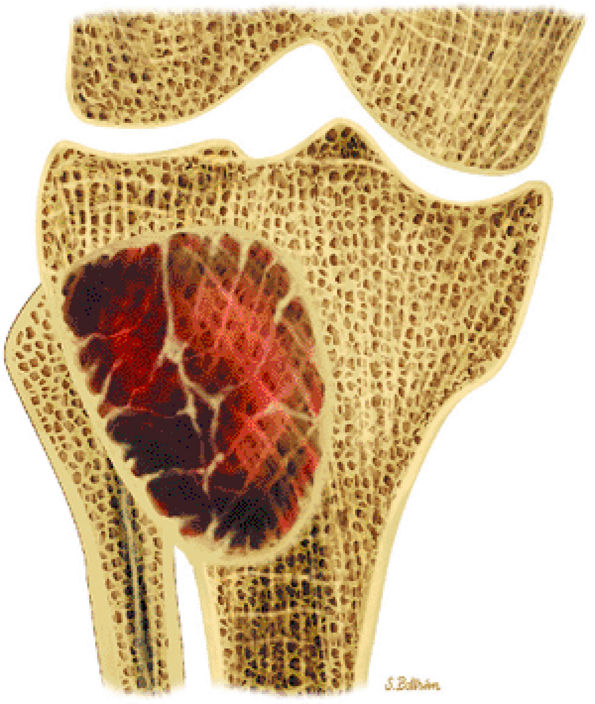
FIGURE 14-7 ● Osteoid osteoma of the proximal femur. Coronal graphic illustration shows tumor nidus in red with surrounding sclerosis.
|
 |
|
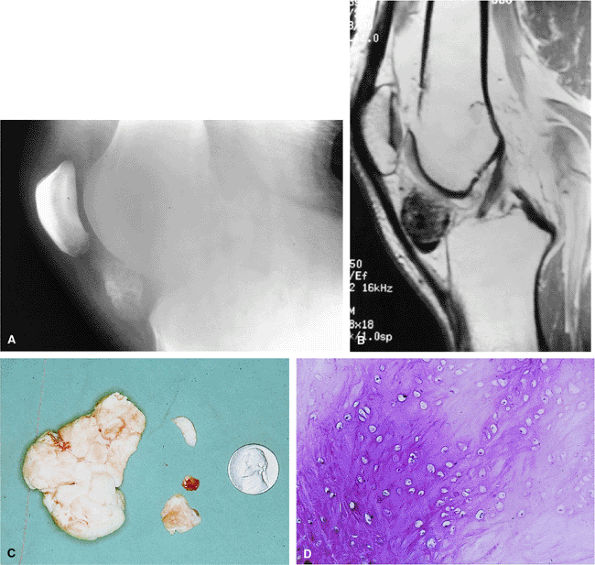
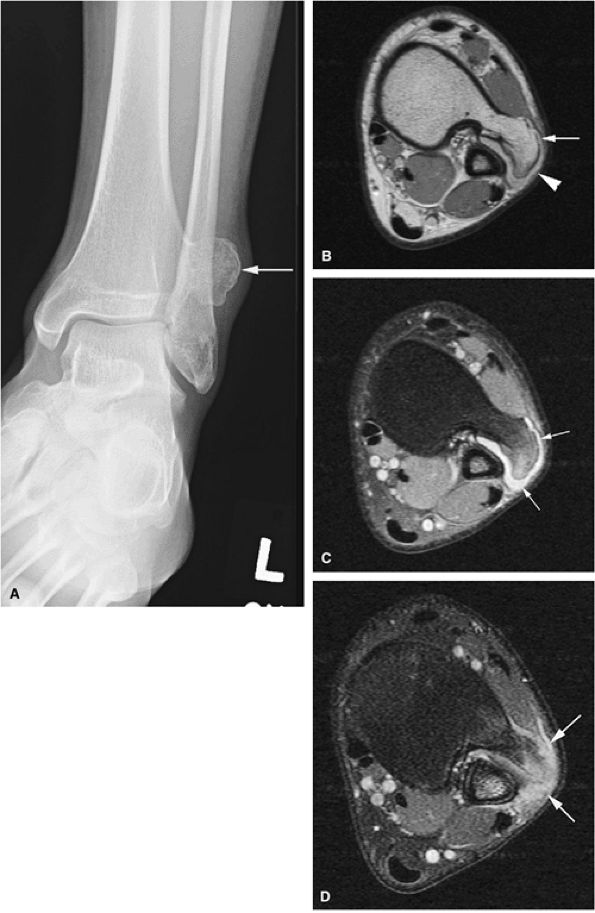
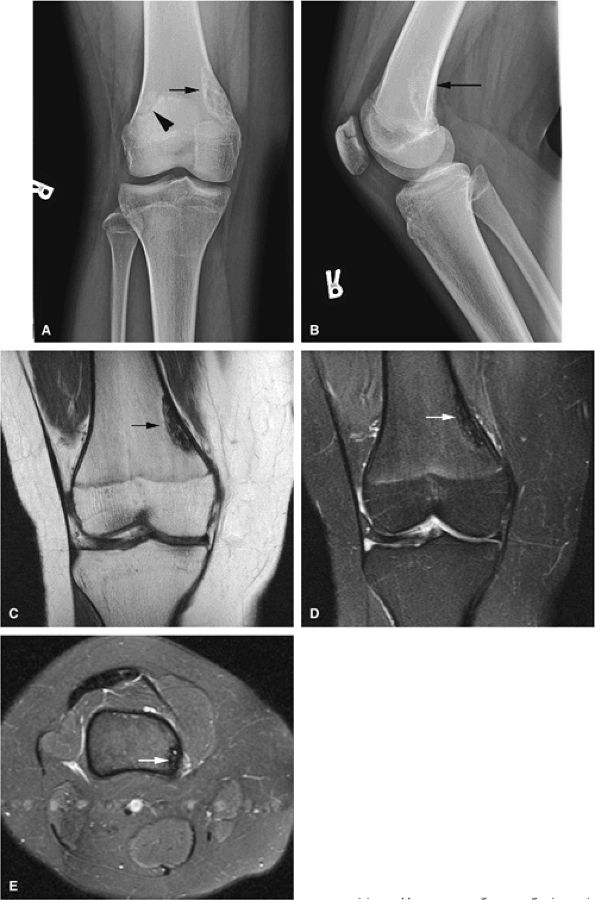
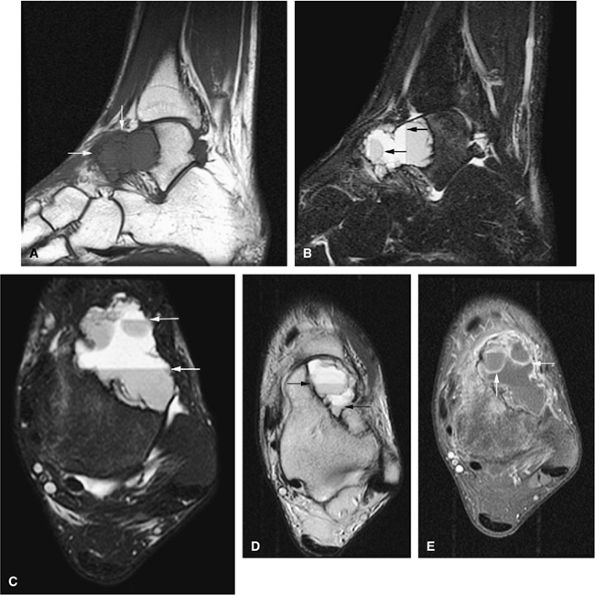
FIGURE 14-8 ● (A) Anteroposterior radiograph shows focal sclerosis of the medial tibial metaphysis (arrow). T1-weighted coronal (B) and sagittal (C) images reveal the osteoid osteoma nidus (straight arrows) and thickened cortex (curved arrow). (D) Scanning lens photomicrograph shows the nidus surrounded by sclerotic reactive bone. (E) High-power photomicrograph of the nidus demonstrates young neoplastic osteoid formation in an angiofibrotic background speckled with osteoblasts and giant cells.
|
-
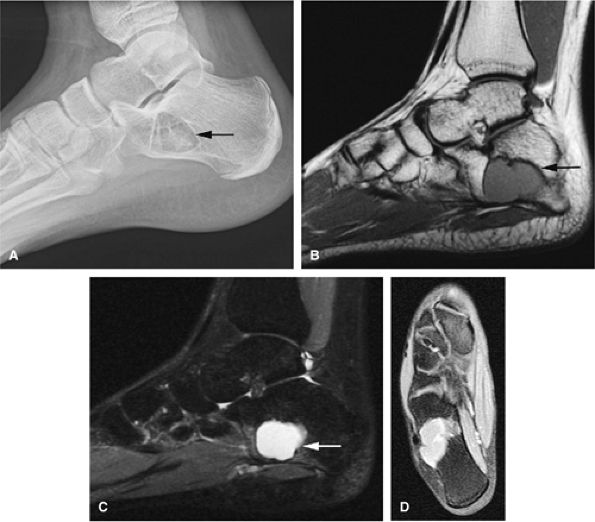
On T1-weighted images, the nidus of the lesion demonstrates low to intermediate signal intensity (Fig. 14-8).
-
On T2-weighted images, the central nidus demonstrates moderate to increased signal intensity.41,42
-
Intracapsular osteoid osteomas of the hip usually cause a synovial inflammatory response and are associated with joint effusions and variable reactive marrow edema.43,44 Reactive sclerosis demonstrates low signal intensity on T1- and T2-weighted images. There may be extensive marrow edema associated with osteoid osteomas, and STIR or fat-suppressed T2-weighted fast spin-echo sequences can be used to screen for this reactive edema (Fig. 14-9).
-
Occasionally, increased vascularity directed toward the nidus is seen on MR images.
-
Thin-section CT may be necessary to identify the nidus in intracortical lesions.45
-
Enhancement with gadolinium in the presence of a reactive soft-tissue mass may be mistaken for a malignant tumor or osteomyelitis.8
 |
|
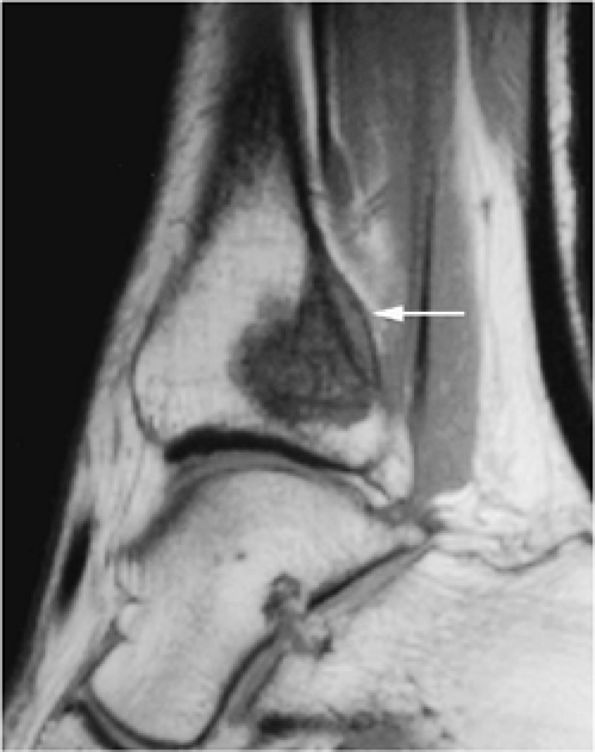
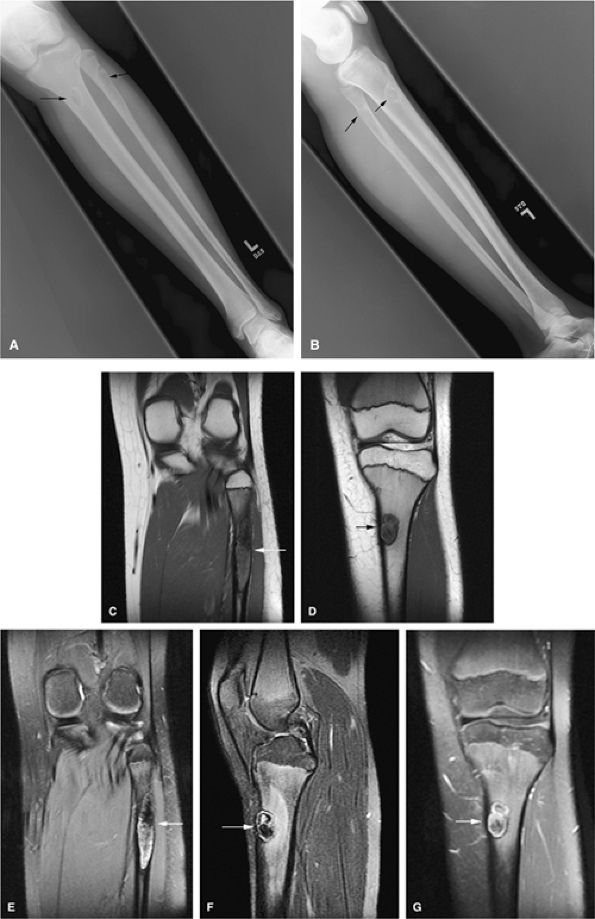
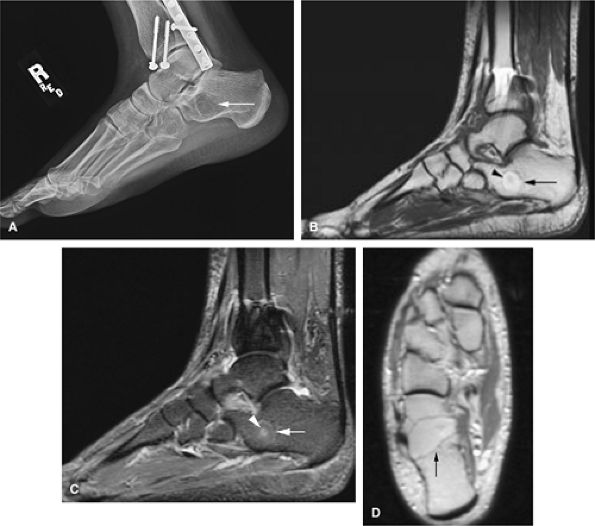
FIGURE 14-9 ● Sagittal (A) and axial (B) T1-weighted images show subcortical osteoid osteoma with a low-signal-intensity nidus (arrow) of the talar neck. (C) Corresponding sagittal fat-suppressed T2-weighted fast spin-echo image demonstrates surrounding hyperintense bone marrow edema (arrowheads). A joint effusion and synovitis is present (arrows). (D) Sagittal CT image demonstrates the osteoid osteoma nidus in the talar neck (arrow).
|
 |
|
FIGURE 14-10 ● Axial graphic illustration shows radiofrequency ablation of an osteoid osteoma. Nidus is shown in red with surrounding cortical thickening. The radiofrequency probe is positioned within the nidus.
|
There is well-vascularized connective tissue containing osteoid and primitive woven bone rimmed by osteoblasts. In contrast to osteoid osteoma, trabecular maturation, the degree of calcification, and overall architectural patterns vary greatly in osteoblastoma.40
 |
|
FIGURE 14-11 ● (A) CT images from a radiofrequency ablation show osteoid osteoma nidus in the anterior tibia (arrowhead) with surrounding cortical thickening. (B) Radiofrequency probe is positioned within the nidus for treatment.
|
 |
|
FIGURE 14-12 ● Osteoblastoma of the spine. Axial graphic illustration shows expansile tumor in red arising from the posterior elements.
|
 |
|
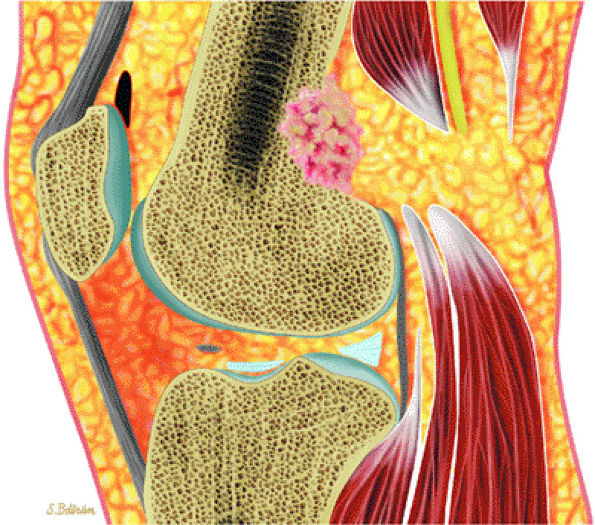
FIGURE 14-13 ● Sagittal graphic illustration shows cortical osteoblastoma of the distal femur in red.
|
-
Signal intensity may be heterogeneous or homogeneous on T2-weighted images (Fig. 14-14).
-
Fluid–fluid levels can be seen in osteoblastomas (Fig. 14-15).53
-
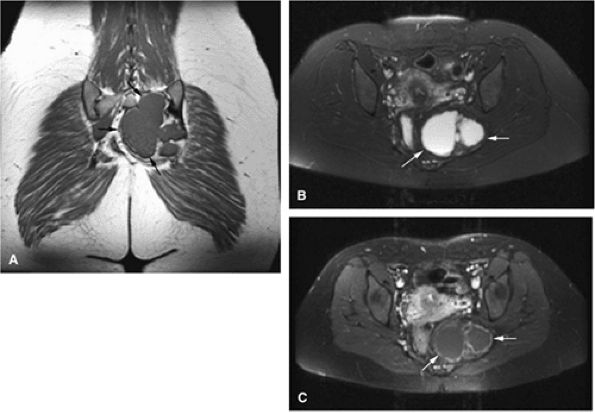
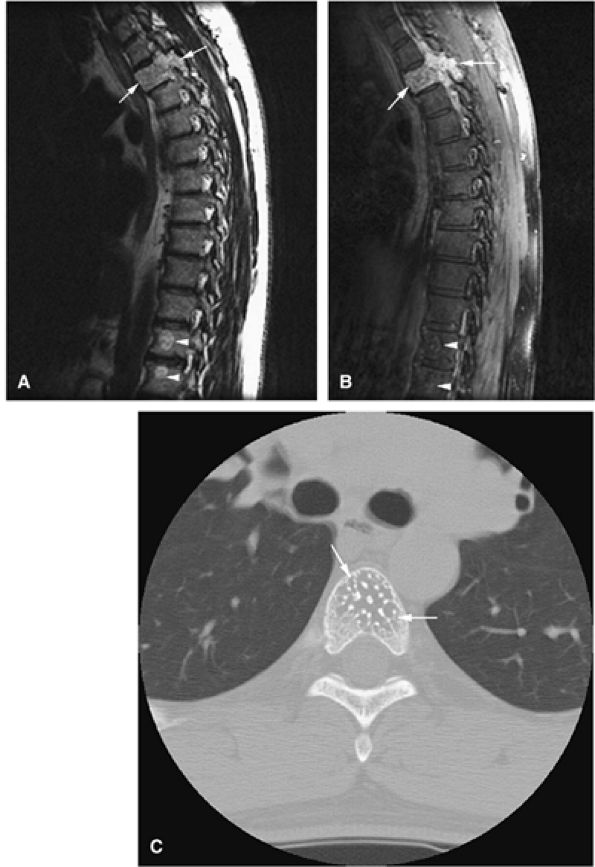
A diffuse inflammatory response involving bone and adjacent soft tissue has been reported in a case of vertebral osteoblastoma.54 CT may be more accurate for the identification of small foci of matrix calcification (Fig. 14-16).
 |
|
FIGURE 14-14 ● Cortical osteoblastoma of the femoral diaphysis. Coronal (A) and axial (B) T1-weighted images show osteoblastoma isointense to muscle with adjacent cortical thickening (arrows). Reactive bone marrow edema is hyperintense on sagittal (C) and axial (D) fat-suppressed T2-weighted fast spin-echo images (arrowheads).
|
 |
|
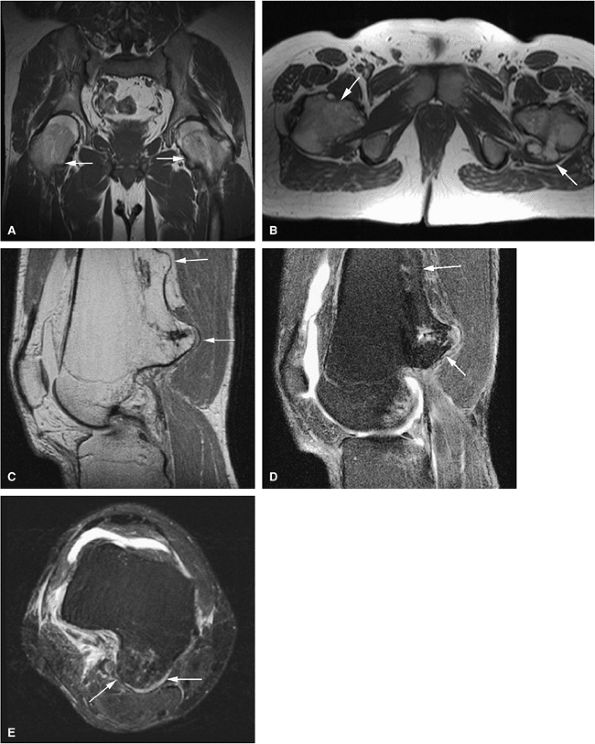
FIGURE 14-15 ● Osteoblastoma arising in the posterior elements of the L2 vertebra is demonstrated on sagittal (A) and axial (B) fat-suppressed T2-weighted fast spin-echo images. Fluid–fluid levels are present (arrows). The tumor is isointense to muscle (arrow) on the axial T1-weighted image (C) and demonstrates enhancement (arrow) following intravenous injection of gadolinium (D). Note the mass effect upon the spinal canal from the tumor.
|
 |
|
FIGURE 14-16 ● Internal calcifications (arrow) are identified on an axial CT image in this osteoblastoma arising in the left posterior elements of the L5 vertebra.
|
-
On T2-weighted and STIR images, chondroid matrix is markedly hyperintense.
-
Enchondromas can be confused with bone infarcts. Infarcts show central fat signal and serpiginous borders.
-
Syndromes associated with multiple enchondromas have an increased risk of malignant transformation.
-
Osteochondromas show continuity with the marrow cavity of host bone.
-
Osteochondromas have their own growth plate and stop growing with skeletal maturity.
-
MR imaging is useful in determining the thickness of the cartilage cap.
-
Chondroblastomas involve the epiphyses/epiphysis equivalents.
-
Satellite cartilaginous foci are often seen in association with enchondromas.
-
Chondroid elements demonstrate marked hyperintensity on T2-weighted or STIR images (Figs. 14-20 and 14-21).
-
In the multiple enchondromas of Ollier—s disease, the foci of cartilaginous tissue or matrix are seen as areas of low to intermediate signal intensity on T1-weighted images and high signal intensity on T2-weighted images. This appearance is secondary to the long T1 and T2 relaxation times of chondroid tissue. Enchondromas in Ollier—s disease may show aggressive features such as cortical irregularities, and there is an increased incidence of malignant degeneration (Fig. 14-22).
-
In Maffucci—s syndrome soft-tissue hemangiomas can be seen on T2-weighted images as high-signal-intensity tubular structures, consistent with slow flow in vascular channels.
-
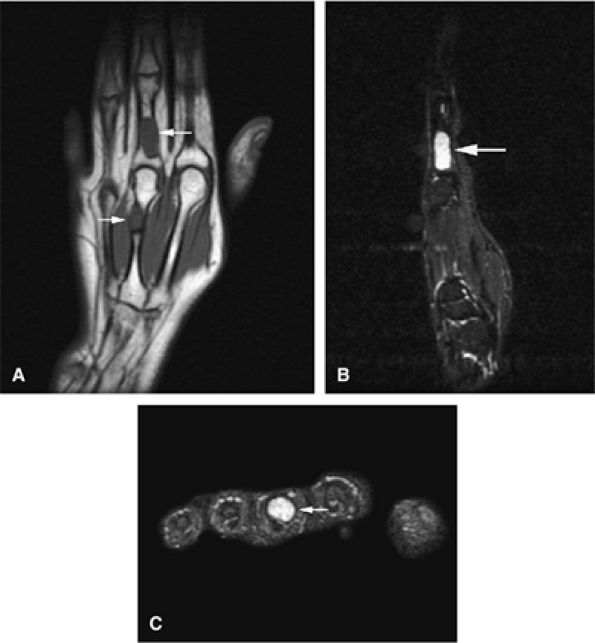
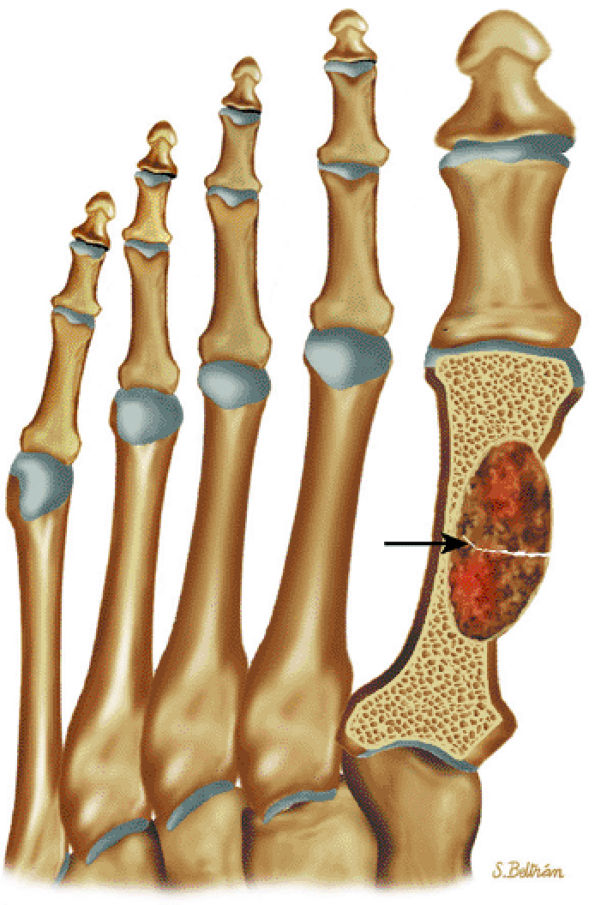
Enchondromas are common in the tubular bones of the hands and feet (Fig. 14-23).
-
Enchondromas can be differentiated from bone infarcts by the following features:58,59
-
Lack of central fat signal intensity on T1-weighted images
-
Peripheral borders that are not as serpiginous as those seen in infarcted tissue
-
Central areas of increased signal intensity on T2-weighted images
-
-
In juxtacortical or periosteal chondroma, soft-tissue calcification may mimic myositis ossificans (Figs. 14-24 and 14-25). A localized increase in signal intensity on T2-weighted images may occur without underlying involvement of the adjacent bone.60
 |
|
FIGURE 14-17 ● Coronal graphic illustration of the humerus (A) and femur (B) shows a well-defined lobulated metaphyseal enchondroma in purple.
|
 |
|
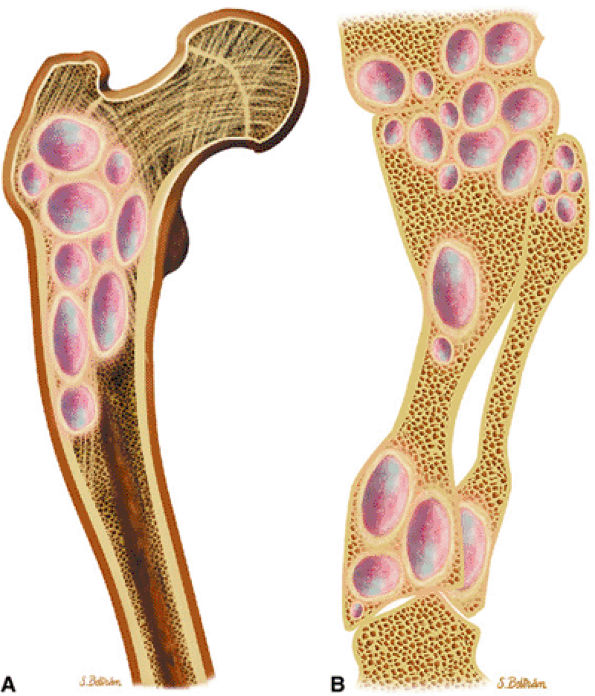
FIGURE 14-18 ● Ollier—s disease of the lower extremity. Coronal graphic illustration of the femur (A) and lower leg (B) shows deformity with multiple enchondromas.
|
 |
|
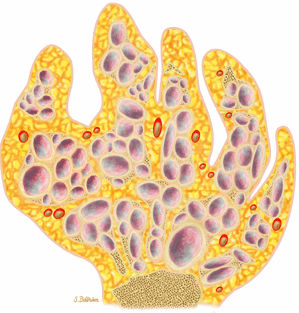
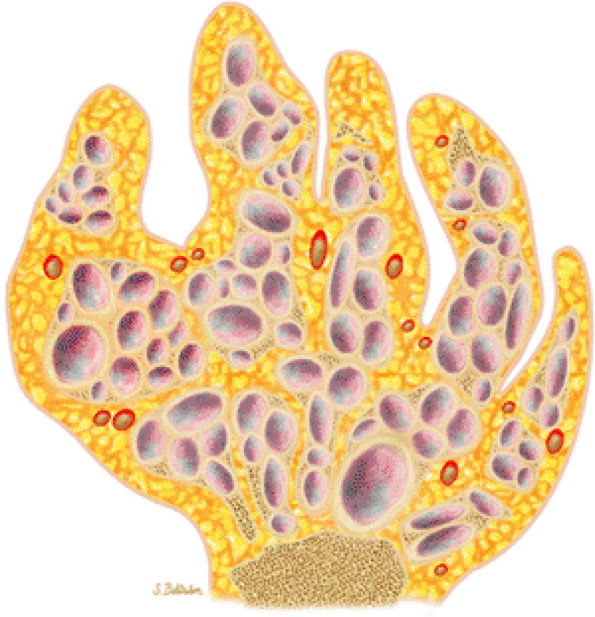
FIGURE 14-19 ● Maffucci—s syndrome of the hand. Coronal graphic illustration shows marked deformity of the hand with multiple enchondromas in purple and hemangiomas in red.
|
 |
|
FIGURE 14-20 ● Benign enchondroma of the distal femur (arrows) demonstrates low signal intensity on a coronal T1-weighted image (A) and high signal intensity on sagittal (B) and axial (C) fat-suppressed T2-weighted fast spin-echo images. (D) Serpiginous enhancement is demonstrated on a contrast-enhanced axial fat-suppressed T1-weighted image.
|
 |
|
FIGURE 14-21 ● (A) Coronal T1-weighted image shows a low-signal-intensity proximal humeral enchondroma (arrow). (B) On an axial fat-suppressed T2-weighted fast spin-echo image, the chondroid matrix is hyperintense (arrow). (C) Sagittal fat-suppressed T1-weighted image after administration of intravenous gadolinium demonstrates enhancement of the lesion (arrow).
|
 |
|
FIGURE 14-22 ● Ollier—s disease with sarcomatous degeneration. (A) An anteroposterior radiograph demonstrates deformity of the humerus with large enchondroma (white arrow). Periosteal reaction (white arrowhead) is present. Multiple enchondromas are identified within the ribs (black arrows). (B) Coronal T1-weighted image shows a large enchondroma of the proximal humerus (arrow). (C) Axial proton density-weighted images show a large enchondroma of the proximal humerus (arrow) with cortical destruction and associated soft-tissue mass (arrowheads). (D) Axial fat-suppressed T2-weighted fast spin-echo image shows hyperintense cartilage matrix. There is disruption of the cortex with associated soft-tissue mass (arrows). (E) Coronal and (F) axial fat-suppressed T1-weighted images after administration of intravenous gadolinium demonstrate heterogeneous enhancement of the lesion and cortical destruction with soft-tissue mass (arrows). Nonenhancing areas of necrosis are present within the lesion (arrowheads).
|
 |
|
FIGURE 14-23 ● Expansile enchondromas (arrows) of the third proximal phalanx and metacarpal are seen on coronal T1-weighted (A) and sagittal (B) and axial (C) fat-suppressed T2-weighted fast spin-echo images.
|
 |
|
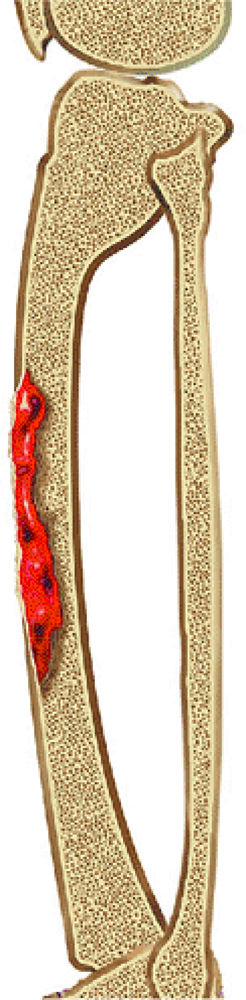
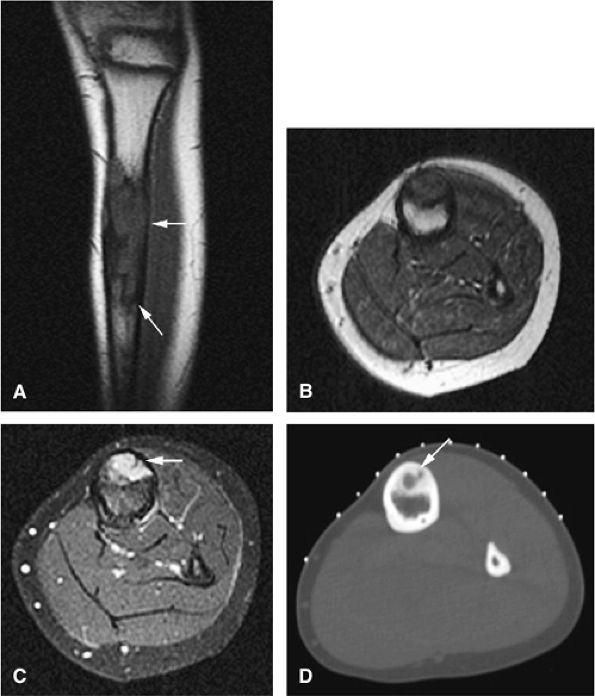
FIGURE 14-24 ● Periosteal (i.e., juxtacortical) chondroma located in the proximal humerus is seen on coronal proton density-weighted (A), fat-suppressed T2-weighted fast spin-echo (B), and contrast-enhanced (C) images. Central osseous tissue is low in signal intensity on the proton density and fat-suppressed T2-weighted sequences (arrows).
|
 |
|
FIGURE 14-25 ● (A) Radiograph of the knee of a young adult male with a heavily calcified juxta-articular chondroma in the infrapatellar fat pad. (B) T1-weighted sagittal image demonstrates the low-signal character of this heavily calcified chondroid lesion just beneath the patellar ligament. (C) Gross appearance of the resected specimen, with the upper faceted surface representing its prior articulation with the femoral condyle. (D) Low-power photomicrograph of benign-appearing chondrocytes in a heavily calcified chondroid matrix.
|
-
Benign osteochondromas are isointense to normal marrow (Figs. 14-28 and 14-29).
-
The intact cartilage cap demonstrates intermediate signal intensity on T1-weighted images and high signal intensity on T2-weighted images.
-
Fat-suppressed T2-weighted fast spin-echo sequences are useful in defining the thickness of the cartilaginous cap (as mentioned earlier, it may be as thick as 3 cm in adolescents and <1 cm in adults). Dispersed calcifications in the cartilaginous cap, as well as increased thickness of the cap, are features of malignant transformation that can be identified on MR scans.
-
MR imaging is superior to CT in demonstrating inflammatory changes that accompany enlargement of the bursa exostotica covering the cartilaginous cap (Fig. 14-30). This bursa is hypointense on T1-weighted images and hyperintense on T2, fat-suppressed T2-weighted fast spin-echo, or STIR sequences. Gadolinium administration causes enhancement of the periphery of the bursa exostotica only.
-
Growth deformity is associated with multiple hereditary exostoses (Fig. 14-31).63
 |
|
FIGURE 14-26 ● Coronal graphic illustration demonstrates an osteochondroma arising from the distal femur. Note the continuity of the lesion with the marrow cavity of the host bone. Calcifications within the osteochondroma are shown in red and the cartilage cap is shown in blue.
|
 |
|
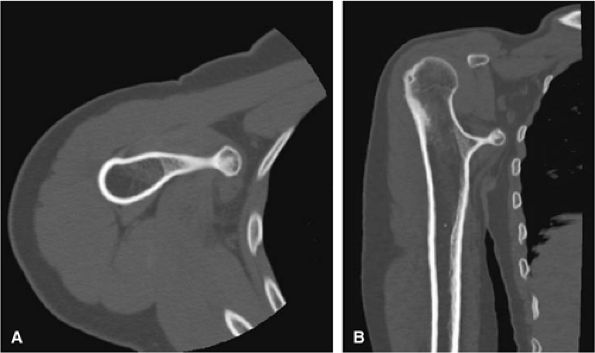
FIGURE 14-27 ● A metaphyseal osteochondroma arising from the proximal humerus with continuity of marrow and cortex is demonstrated on axial (A) and coronal (B) CT images.
|
 |
|
FIGURE 14-28 ● A small osteochondroma arising from the proximal fibula (arrows) is demonstrated on an anteroposterior radiograph (A), a sagittal proton density-weighted image (B), and axial T1-weighted (C) and fat-suppressed T2-weighted fast spin-echo (D) images of the knee.
|
 |
|
FIGURE 14-29 ● A sessile osteochondroma of the posterior distal femur (arrows) can be seen on coronal T1-weighted (A), sagittal proton density-weighted (B), and sagittal (C) and axial (D) fat-suppressed T2-weighted images.
|
 |
|
FIGURE 14-30 ● Bursa exostotica associated with a tibial osteochondroma. (A) Anteroposterior radiograph shows an osteochondroma arising from the distal tibia (arrow). (B) The osteochondroma (arrow) demonstrates continuity with the medulla cavity at the tibia. The bursa exostotica (arrowhead) is hyperintense on a proton density-weighted axial image. (C) On a fat-suppressed T2-weighted fast spin-echo image, the bursa exostotica is hyperintense (arrows). (D) Peripheral enhancement (arrows) is seen on a fat-suppressed T1-weighted axial image after administration of intravenous gadolinium.
|
 |
|
FIGURE 14-31 ● Undertubulation of the hips and knees in a patient with multiple hereditary exostoses. Exostoses (arrows) are seen on coronal (A) and axial (B) T1-weighted images of the hip. Sagittal proton density (C) and sagittal (D) and axial (E) fat-suppressed T2-weighted fast spin-echo images of the knee also demonstrate exostoses (arrows).
|
 |
|
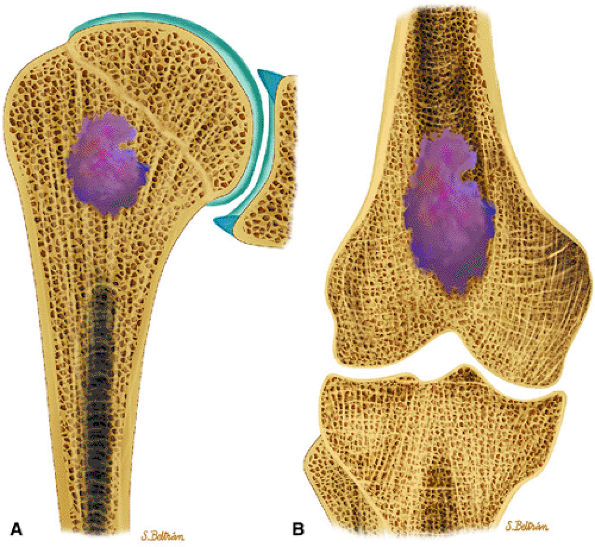
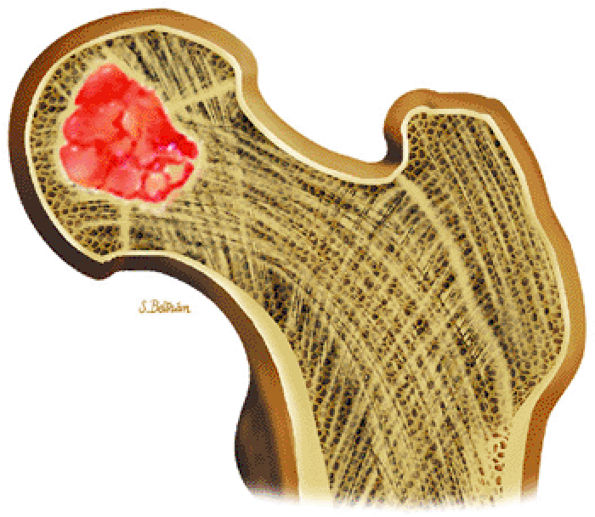
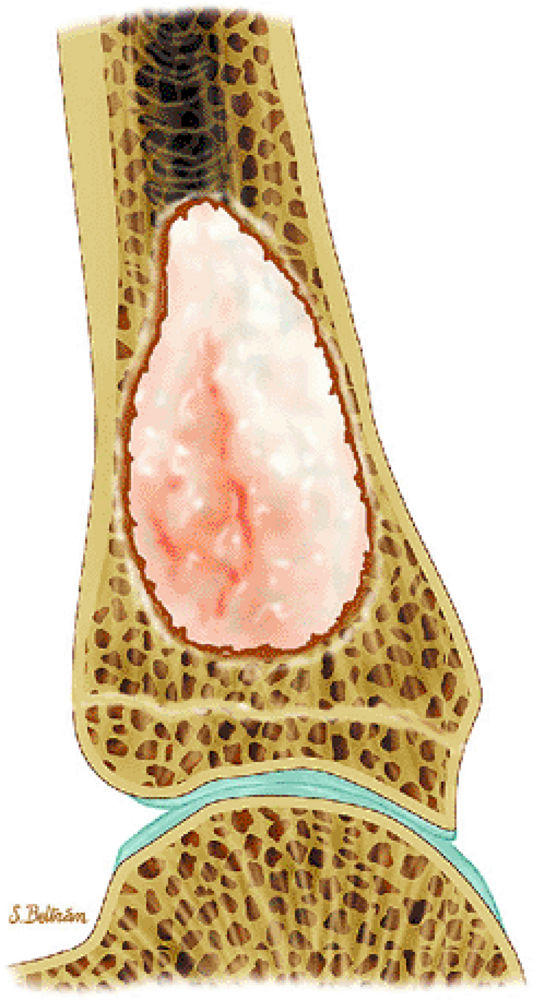
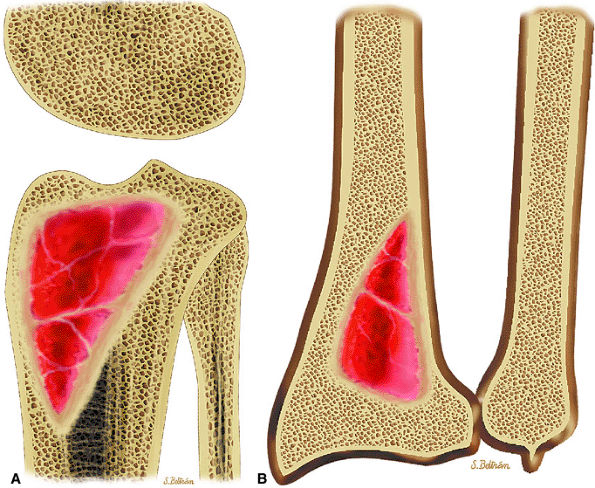
FIGURE 14-32 ● Chondroblastoma of the proximal femur. A well-defined lobulated lesion involving the femoral epiphysis is shown in red.
|
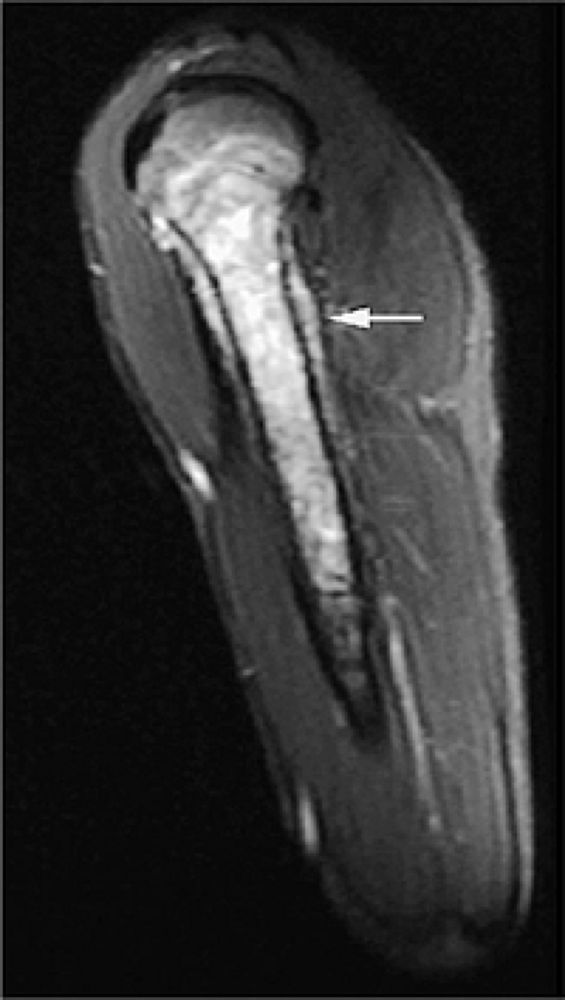
intensity on T2-weighted images (Figs. 14-34 and 14-35). Typically, the long-bone epiphyses of the humerus, tibia, or femur are affected. MR imaging can also be used to identify eccentric locations and the associated sclerotic border.66 Other MR findings include the following:
 |
|
FIGURE 14-33 ● A chondroblastoma of the calcaneus is shown in red on a sagittal graphic illustration. Areas of calcification are shown in white and a hemorrhagic cyst is shown in red.
|
 |
|
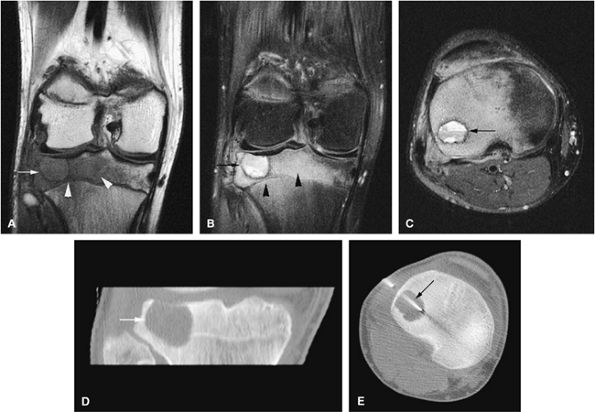
FIGURE 14-34 ● Extensive marrow edema (arrowheads) in reaction to an epiphyseal-based chondroblastoma of the tibia (arrows) demonstrates low signal intensity on a coronal T1-weighted image (A) and hyperintensity on a coronal STIR image (B). Axial STIR image (C) demonstrates fluid–fluid levels within the lesions (arrow). (D) A coronal CT image shows a well-defined lytic defect in the tibial plateau (arrow). (E) An axial CT image obtained during radiofrequency ablation of the tumor shows the radiofrequency probe (arrow) within the chondroblastoma.
|
-
Epiphyseal and metaphyseal marrow edema associated with periosteal reaction is a frequent finding, seen in up to 57% of cases of long-bone involvement.67 MR imaging is sensitive to this extensive reactive marrow edema, which demonstrates decreased signal intensity on T1-weighted images and increased signal intensity on T2-weighted or STIR images.
-
Fluid–fluid levels can be seen in chondroblastomas.53
-
T2-weighted images are useful in demonstrating the lobular chondroid internal architecture and fine lobular margins of the lesion.68
 |
|
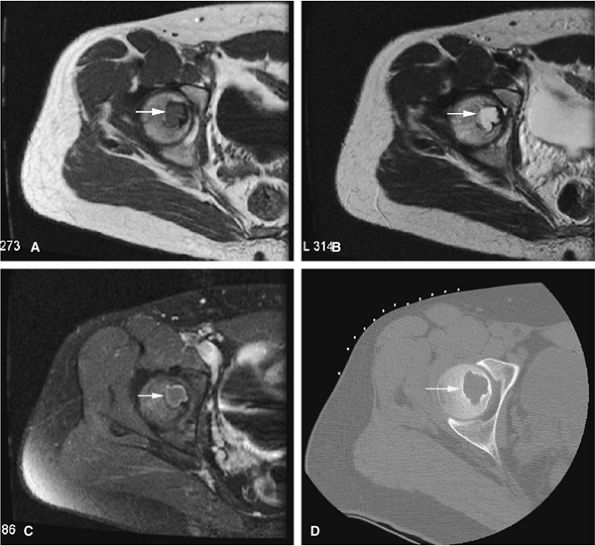
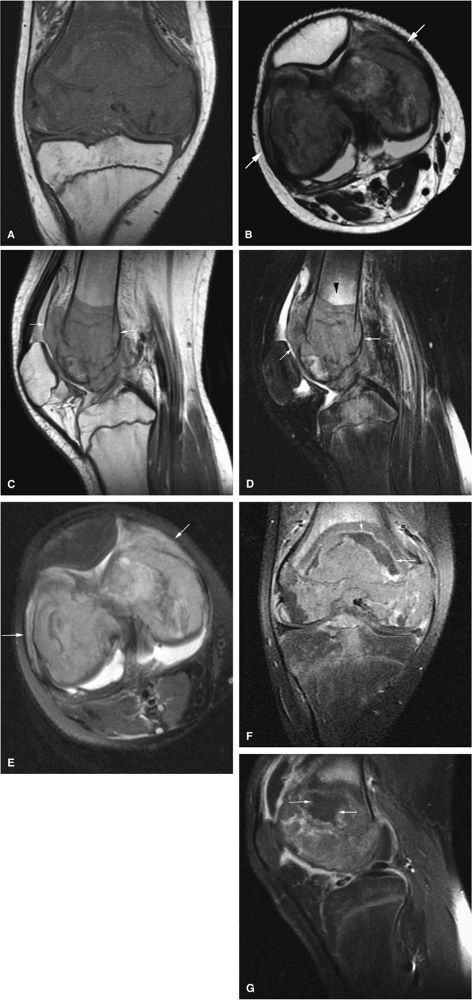
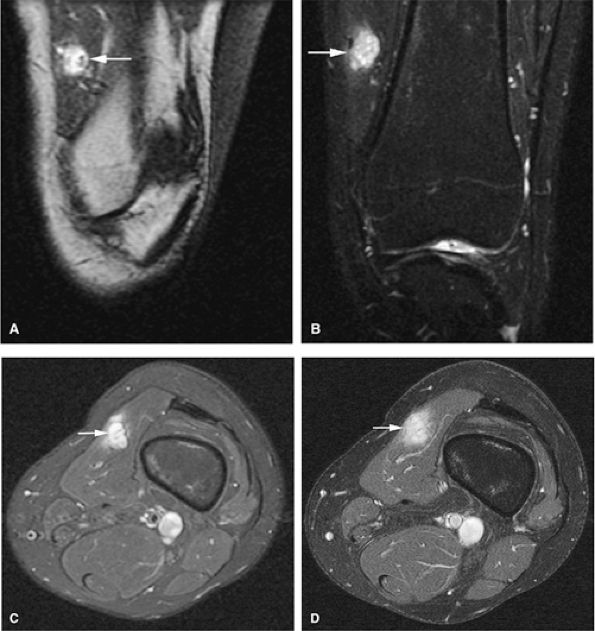
FIGURE 14-35 ● (A) On an axial T1-weighted image, a chondroblastoma of the femoral epiphysis (arrow) demonstrates intermediate signal intensity. (B) On an axial T2-weighted image, the chondroblastoma demonstrates increased signal intensity (arrow). (C) Contrast-enhanced axial fat-suppressed T1-weighted image shows mild peripheral enhancement (arrow). (D) Corresponding axial CT image shows a well-defined lytic lesion in the femoral epiphysis (arrow).
|
-
Fibrous lesions demonstrate low signal intensity on T1- and intermediate to high signal intensity on T2-weighted images.
-
Central fat signal can be seen during involution of lesions.
-
Periosteal desmoids likely occur from traction on inserting muscle groups and should not be biopsied.
with encroachment on the medullary cavity (Fig. 14-37). Histologically, both nonossifying fibromas and fibrous cortical defects are composed of spindle-shaped fibroblasts arranged in an interlacing pattern. Unlike the fibrous cortical defect, nonossifying fibromas are more commonly found in the metaphyseal area.8 On T1-weighted images, these lesions are usually low in signal intensity and have a lobulated contour with an eccentric epicenter. T2, fat-suppressed T2-weighted fast spin-echo, or STIR images may demonstrate areas of hyperintensity (Fig. 14-38). Nonossifying fibromas may also display a central area of fat signal intensity isointense to adjacent marrow, especially during healing or involution. The Jaffe-Campanacci syndrome is characterized by multiple nonossifying fibromas with extraskeletal congenital anomalies such as café-au-lait spots, mental retardation, hypogonadism or cryptorchidism, and cardiovascular malformations (Fig. 14-39).
 |
|
FIGURE 14-36 ● Anteroposterior (A) and lateral (B) radiographs show a fibrous cortical defect with a sclerotic border (arrows) in the posterior femoral cortex. A bipartite patella is incidentally noted on the anteroposterior radiograph (arrowhead). The defect demonstrates low signal on coronal T1-weighted (C) and coronal (D) and axial (E) fat-suppressed T2-weighted images (arrows).
|
of young females.40 These lesions are well demarcated and therefore amenable to surgical curettage and enucleation. The histologic features of this lesion consist of random trabecular woven bone or dystrophic calcification set in a fibrous stroma.
 |
|
FIGURE 14-37 ● Coronal graphic illustration demonstrates a well-defined nonossifying fibroma of the proximal tibia in reddish-brown. Note the sclerotic scalloped borders.
|
 |
|
FIGURE 14-38 ● Anteroposterior (A) and lateral (B) radiographs show nonossifying fibromas in the proximal tibia and fibula (arrows). Coronal T1-weighted images (C and D) demonstrate the low-signal-intensity sclerotic border (arrows). Corresponding coronal (E) and sagittal (F) fat-suppressed T2-weighted fast spin-echo images show areas of hyperintensity (arrows). A contrast-enhanced fat-suppressed T1-weighted image (G) shows mild peripheral enhancement (arrow).
|
 |
|
FIGURE 14-39 ● Coronal graphic illustration of the knees shows multiple bilateral nonossifying fibromas in a patient with Jaffe-Campanacci syndrome. Patients with this syndrome also have extraskeletal abnormalities, such as café-au-lait spots, mental retardation, and hypogonadism.
|
 |
|
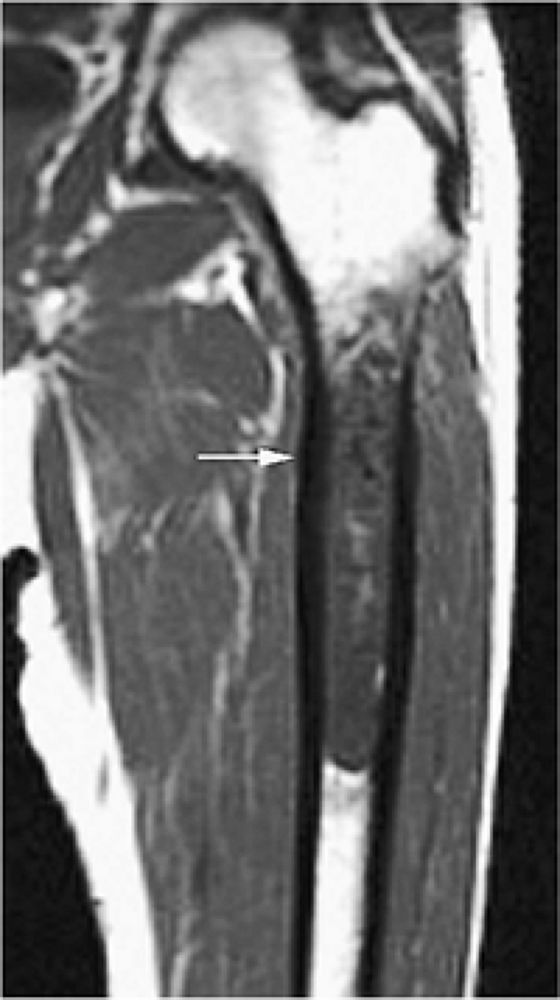
FIGURE 14-40 ● Femoral cortical irregularity distal to the linea aspera (arrows). This area of cortical roughening is usually located medially, along the posterior femoral cortex, as shown on a sagittal proton density-weighted image (A) and a fat-suppressed T2-weighted image (B). Both the periosteal desmoid and distal femoral cortical irregularity may resemble a fibrous cortical defect.
|
caused by a pathologic fracture at the femoral neck (Fig. 14-44). Treatment of fibrous dysplasia involves cortical grafting or implant fixation to stabilize the long bone.8
 |
|
FIGURE 14-41 ● Monostotic fibrous dysplasia of the humerus. Anteroposterior radiograph (A) demonstrates an expansile lesion involving the humeral diaphysis (arrow). Fibrous tissue expansion of the medullary cavity is intermediate in signal intensity (arrows) on coronal T1-weighted image (B). Fibrous tissue expansion of the medullary cavity is intermediate in signal intensity on axial (C) T1-weighted image (arrow) and high in signal intensity (arrow) on a sagittal fat-suppressed T2-weighted fast spin-echo image (D). Fat-suppressed coronal (E) and axial (F) T1-weighted images following the intravenous administration of gadolinium demonstrate peripheral enhancement (arrows).
|
 |
|
FIGURE 14-42 ● Monostotic fibrous dysplasia of the left femoral neck, a common location, demonstrates low signal intensity on a coronal T1-weighted image (A) and increased signal intensity on a fat-suppressed T2-weighted fast spin-echo image (B) (arrows). Note the areas of lower signal intensity on the fat-suppressed T2-weighted image (arrowhead). Coronal (C) and axial (D) fat-suppressed T1-weighted images following the intravenous administration of gadolinium demonstrate peripheral enhancement (arrows).
|
 |
|
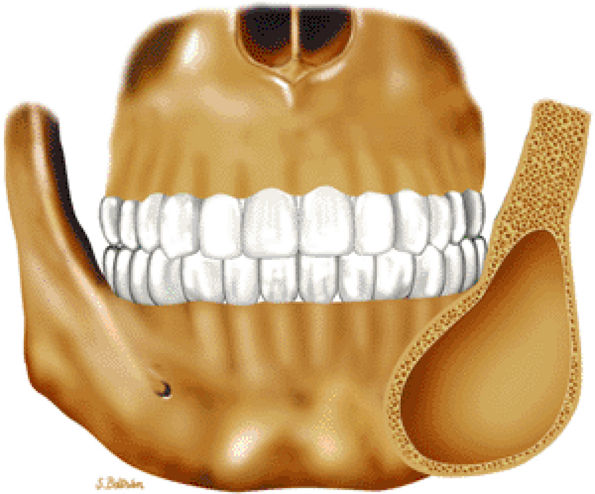
FIGURE 14-43 ● Fibrous dysplasia of the facial bones. Coronal graphic illustration shows an expansile, well-defined lesion involving the angle of the mandible.
|
 |
|
FIGURE 14-44 ● Coronal graphic illustration shows bowing deformity of the proximal femur (shepherd—s crook deformity). Note multiple lucent lesions of polyostotic fibrous dysplasia involving the femur.
|
 |
|
FIGURE 14-45 ● Osteofibrous dysplasia of the tibia is shown in blue on a sagittal graphic illustration. Surrounding sclerosis is shown in light brown. Note the anterior bowing of the tibia, often seen in osteofibrous dysplasia.
|
 |
|
FIGURE 14-46 ● Osteofibrous dysplasia with cortical destruction and reactive edema within the tibialis anterior muscle group. This lesion presented with symptoms of anterior compartment syndrome. (A) T1-weighted and (B) fat-suppressed T2-weighted fast spin-echo coronal images. (C) T1-weighted, (D) fat-suppressed T2-weighted fast spin-echo (arrow), and (E) STIR axial images (arrow).
|
 |
|
FIGURE 14-47 ● Unicameral bone cyst of the calcaneus. Sagittal graphic illustration demonstrates a well-defined lytic lesion with intact adjacent cortex.
|
-
Unicameral bone cysts demonstrate fluid signal on MR imaging without evidence of enhancement.
-
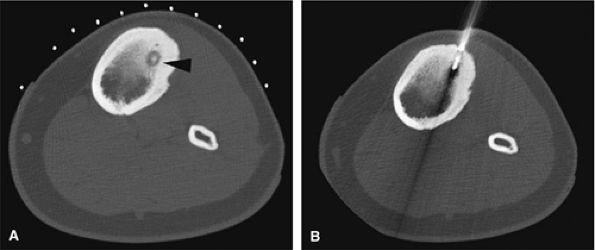
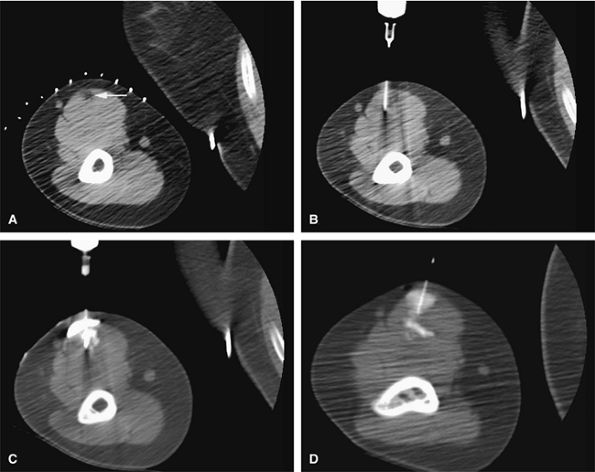
Unicameral and aneurysmal bone cysts can be treated with CT-guided percutaneous injections.
-
Fluid–fluid levels are characteristic of aneurysmal bone cysts.
-
Secondary aneurysmal bone cysts can be seen in a variety of benign and malignant tumors.
-
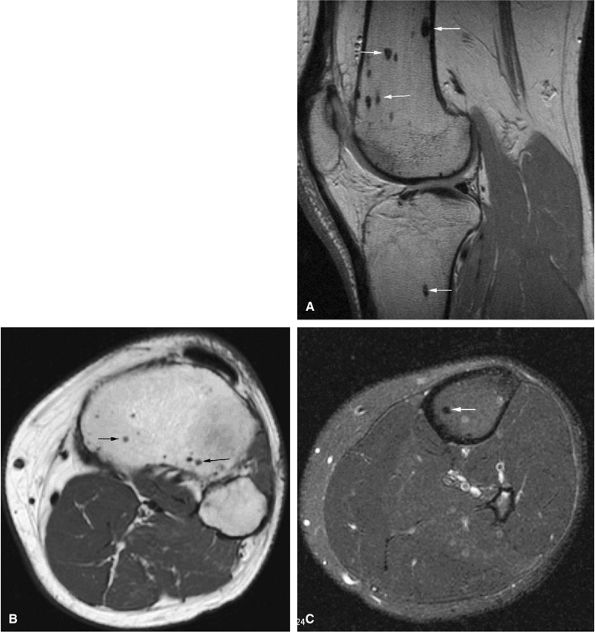
Intraosseous hemangiomas are characterized by fat signal intensity.
-
Intraosseous lipomas follow the signal intensity of fat on all pulse sequences.
-
Langerhans cell histiocytosis is a “great imitator” of various benign and malignant lesions.
-
On T1-weighted images, it is well defined and demonstrates low signal intensity secondary to simple fluid within the cyst.
-
On T2-weighted images, the fluid contents demonstrate uniformly increased signal intensity (Fig. 14-49).
-
Internal hemorrhage may alter T1 and T2 signal characteristics.
-
A low-signal-intensity peripheral border representing reactive sclerosis often demarcates this lesion.66
-
Although fracture may occur as a complication, there should be no associated soft-tissue mass.
 |
|
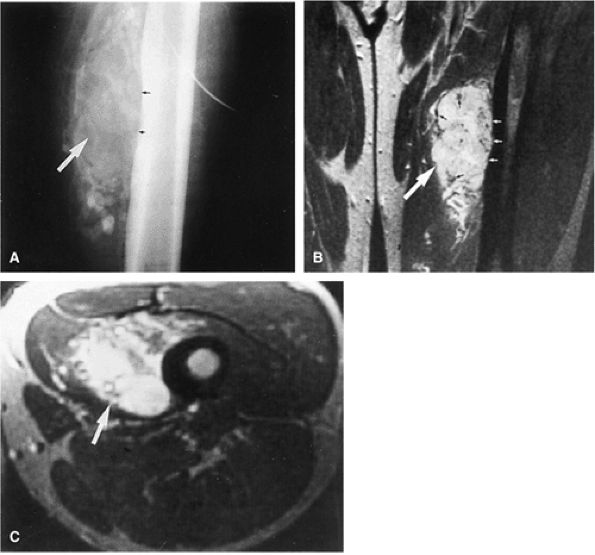
FIGURE 14-48 ● (A) Axial CT images from a percutaneous CT-guided steroid injection demonstrate a well-defined lytic lesion in the humeral metaphysic (arrow). (B) Corticosteroid mixed with iodinated contrast is seen within the lesion following therapy (arrow).
|
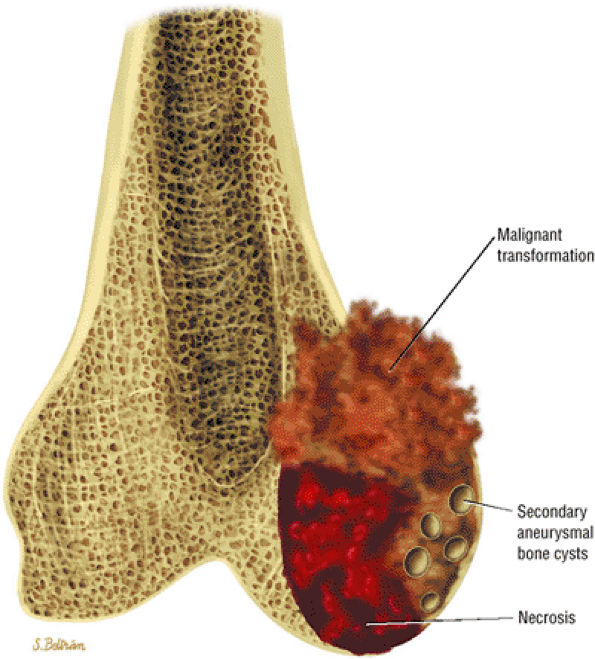
contain varying amounts of blood, fluid, and fibrous tissue. In many cases, they arise from preexisting bone lesions such as a giant cell tumor, osteoblastoma, chondroblastoma, fibrous dysplasia, or chondromyxoid fibroma.72 Histologic features include blood-filled channels supported by a fibrous septum, which contains multinucleated giant cells and osteoid. Careful microscopic assessment is required to rule out the elusive telangiectatic variant of osteosarcoma, which may mimic an aneurysmal bone cyst both clinically and radiographically.72,73,74
 |
|
FIGURE 14-49 ● Unicameral bone cyst (arrow) of the calcaneus, a common location. (A) Lateral radiograph demonstrates a well-defined lytic lesion (arrow). The cystic contents demonstrate low to intermediate signal on a sagittal T1-weighted image (B) and high signal on a sagittal fat-suppressed T2-weighted fast spin-echo image (C). (D) No enhancement is visualized on an axial fat-suppressed T1-weighted image following the intravenous administration of gadolinium.
|
 |
|
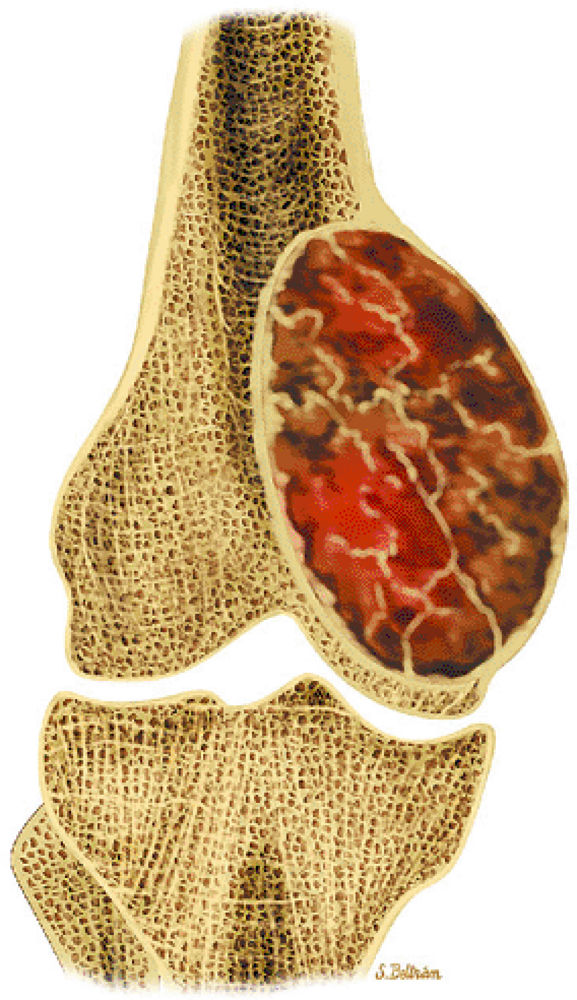
FIGURE 14-50 ● Aneurysmal bone cyst of the distal femur. (A) Sagittal and (B) axial graphic illustrations show an expansile blood-filled lesion with fluid–fluid levels in red.
|
 |
|
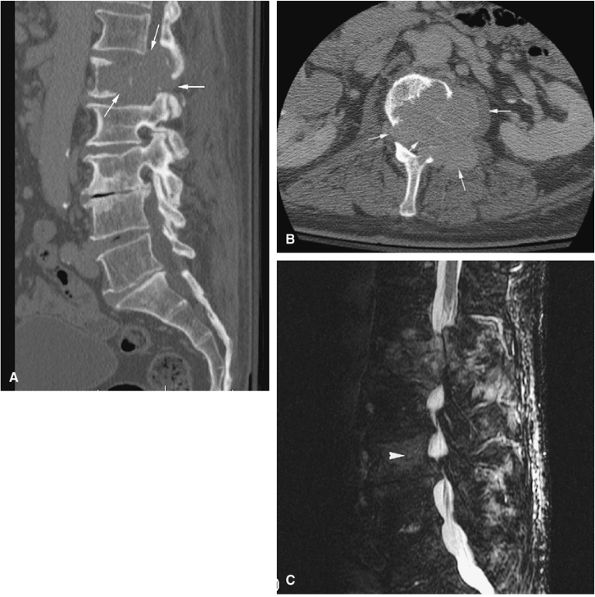
FIGURE 14-51 ● Aneurysmal bone cyst of the spine. An axial CT image of the lower thoracic spine demonstrates a lytic expansile lesion arising from the posterior elements of a thoracic vertebral body (arrows).
|
-
The expansile lesion may have internal septations, fluid–fluid levels, and areas of bright signal intensity on both T1- and T2-weighted images, depending on the chronicity of the associated hemorrhage (Figs. 14-52 and 14-53).77
-
The fluid–fluid level probably represents layering of uncoagulated blood within the lesion.78 On T1-weighted images, increased signal intensity in the gravity-dependent layer represents methemoglobin. It may be difficult to exclude the possibility of malignancy when severe inhomogeneity of signal intensity is observed.
-
Cortical bowing and septation (trabeculation) may be seen in a low-signal-intensity contour of cortical bone.
 |
|
FIGURE 14-52 ● Aneurysmal bone cyst of the talus is eccentric and expansile (arrows), as seen on sagittal T1-weighted image (A). Fluid–fluid levels (arrows) are seen on sagittal (B) and axial (C) fat-suppressed T2-weighted fast spin-echo images and an axial proton density-weighted image (D). Septal enhancement (arrows) is noted on this fat-suppressed T1-weighted axial image (E) following administration of intravenous gadolinium.
|
 |
|
FIGURE 14-53 ● Aneurysmal bone cyst of the sacrum. (A) Coronal T1-weighted image defines the extent (arrows) of this well-marginated mass. (B) Axial fat-suppressed T2-weighted fast spin-echo image shows hyperintense signal intensity of the lesion (arrows). (C) Peripheral enhancement (arrows) is seen on an axial fat-suppressed T1-weighted image following administration of intravenous gadolinium.
|
and are situated in the center of the trigonum calcis, which raises the question of some form of relationship between the two entities. However, the precise explanation remains uncertain.37
 |
|
FIGURE 14-54 ● Hemangioma of the spine is shown in red on a sagittal graphic illustration.
|
 |
|
FIGURE 14-55 ● (A) T1-weighted sagittal image showing thoracic vertebral body involvement with a bright-signal-intensity hemangioma with extension into the posterior elements (arrows). Smaller hemangiomas are present in the lower thoracic vertebral bodies (arrowheads). (B) Corresponding fat-suppressed T1-weighted image after intravenous administration of gadolinium shows marked enhancement of the hemangioma with involvement of the posterior elements (arrows). The smaller hemangiomas demonstrate only minimal enhancement (arrowheads). (C) Hemangioma in a different patient (arrows) has a corduroy appearance on an axial CT image.
|
-
Diffuse fat signal intensity or a thick rind of adipose tissue differentiates intraosseous lipomas from simple cysts in the calcaneus. This tissue demonstrates high signal intensity on T1-weighted images and circumscribes a central hemorrhagic or fluid component, which demonstrates low signal intensity on T1-weighted images and bright signal intensity on T2-weighted images.
-
Central calcifications are of low signal intensity on T1- and T2-weighted images.
-
In addition to their appearance in the calcaneus, intra-osseous lipomas are known to affect the long tubular bones, including the fibula, tibia, and femur.
-
Intraosseous lipomas demonstrate the same signal intensity as that of fat (i.e., bright on T1-weighted images and intermediate on T2-weighted images) and therefore appear black on STIR and fat-suppressed T2-weighted images (Fig. 14-58).
 |
|
FIGURE 14-56 ● A hemangioma of the right iliac bone (arrows) is seen on (A) an axial proton density-weighted image, (B) axial and (C) sagittal fat-suppressed T2-weighted fast spin-echo images, and (D) coronal contrast-enhanced fat-suppressed T1-weighted image. A corresponding axial CT image (E) demonstrates characteristic coarsened trabeculae (arrows).
|
 |
|
FIGURE 14-57 ● Sagittal graphic illustration shows an intraosseous lipoma of the calcaneus in yellow. Central calcifications are shown in tan.
|
 |
|
FIGURE 14-58 ● (A) Lateral radiograph shows an intraosseous lipoma as a lytic area in the calcaneus (arrow). (B) On a sagittal T1-weighted image, the high-signal-intensity fat (arrow) surrounds small low-signal-intensity hemorrhagic fluid contents (arrowhead). (C) On a sagittal fat-suppressed T2-weighted fast spin-echo image, the fat demonstrates decreased signal intensity (arrow), whereas small central fluid contents (arrowhead) generate increased signal intensity. (D) Axial proton density-weighted image demonstrates high-signal-intensity fat (arrow).
|
 |
|
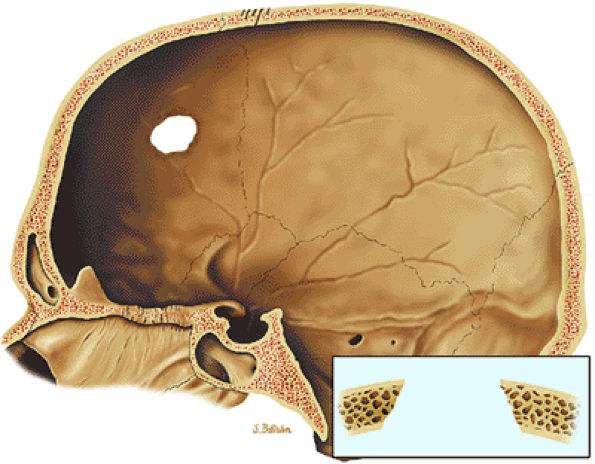
FIGURE 14-59 ● Langerhans cell histiocytosis of the skull. Osteolytic lesion in the frontal bone with sharp margins, giving it a punched-out appearance. Uneven involvement of the inner and outer tables results in beveled appearance.
|
 |
|
FIGURE 14-60 ● Solitary Langerhans cell histiocytosis of the intertrochanteric femur. (A) Coronal T1-weighted image shows areas of low-signal-intensity histiocytic infiltration (arrow). (B) Bright-signal-intensity edema and marrow involvement (arrow) are seen on a fat-suppressed T2-weighted fast spin-echo image.
|
 |
|
FIGURE 14-61 ● Axial CT images from a percutaneous CT-guided steroid injection for treatment of Langerhans cell histiocytosis. (A) A lytic lesion with pathologic fracture (arrow) of the iliac bone. (B) Injection of corticosteroid mixed with iodinated contrast (arrow).
|
-
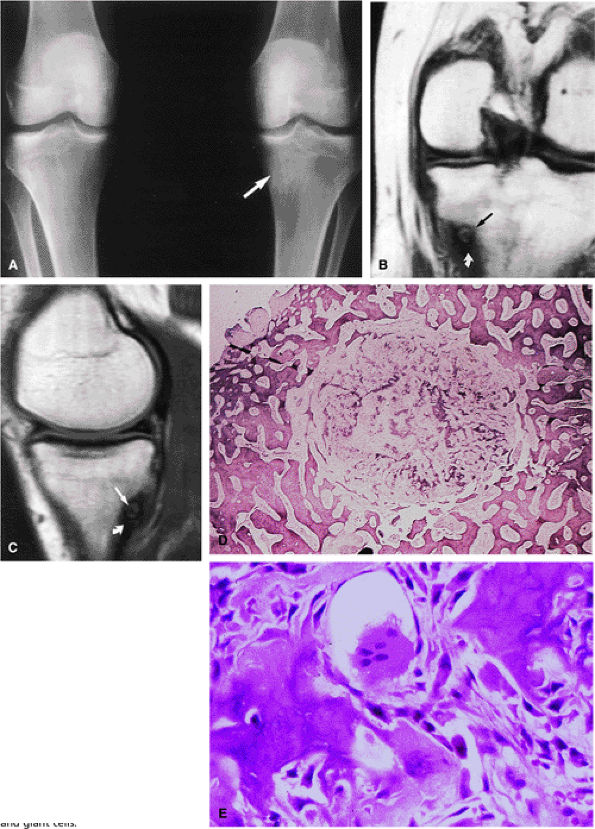
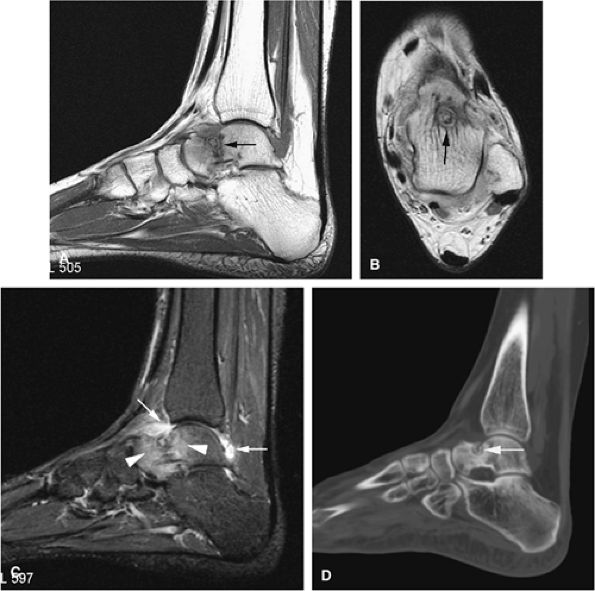
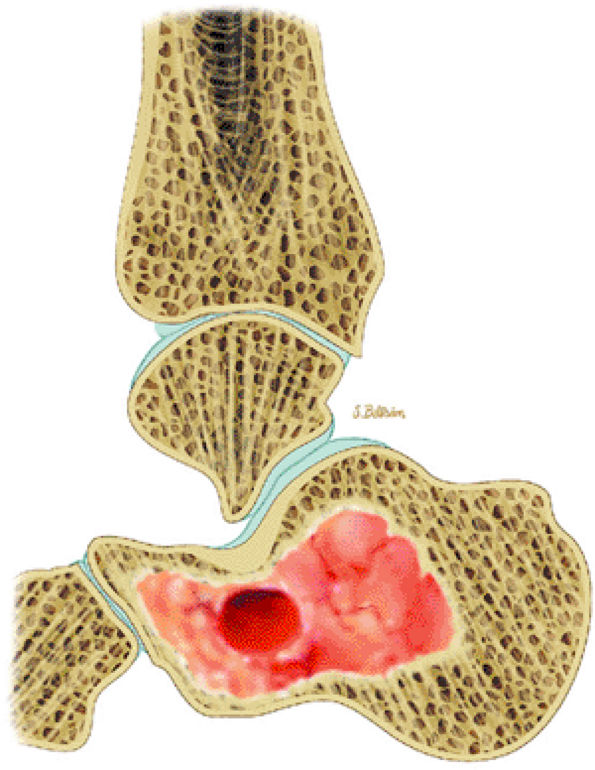
Giant cell tumors originate in the metaphysis and extend into the epiphysis to subchondral bone.
-
Typically, giant cell tumors occur in skeletally mature patients.
-
Giant cell tumors can be aggressive and recur locally.
-
Low to intermediate signal intensity on T1-weighted images and high signal intensity on T2-weighted images (Fig. 14-64)92
-
Heterogeneity in T2-weighted images may represent central areas of liquefaction, hemorrhage, or necrosis (Fig. 14-65).
-
Aoki et al. reported MR detection of hemosiderin in 63% of giant cell tumors.93 The low-signal-intensity hemosiderin is attributed to extravasated erythrocytes in the tumor and the phagocytic function of the tumor cells. Areas of hemosiderin were most evident on gradient-echo sequences.
-
T2, fat-suppressed T2 or proton density fast-spin echo, or STIR images may help to identify areas of tumor recurrence after excision and packing with methylmethacrylate. Recurrent tumors have been identified on MR scans with low to intermediate signal intensity on T1-weighted sequences and high signal intensity on T2-weighted sequences.
-
Fluid–fluid levels are sometimes seen on MR images.94
-
Areas of necrosis (i.e., signal inhomogeneity), cortical erosion, and associated effusions may also be identified on MR images.
-
Intratumoral hemorrhage may produce bright signal intensity on T1- and T2-weighted images, although the tumor generally demonstrates low signal intensity on T1-weighted images and increased signal intensity on T2-weighted images.
-
Soft-tissue involvement and rare joint invasion can be evaluated with MR imaging.95
-
A thin rim of sclerotic bone may be identified at the tumor interface with uninvolved fatty marrow in less aggressive lesions.
-
Contrast inhomogeneity and a multilobular configuration was seen in one case of giant cell tumor involving the flat pubic bone of the pelvis.
 |
|
FIGURE 14-62 ● Secondary phenomena observed in giant cell tumors.
|
 |
|
FIGURE 14-63 ● Giant cell tumor of the distal femur. The tumor extends to the epiphysis.
|
 |
|
FIGURE 14-64 ● Giant cell tumor. (A) Anteroposterior and (B) lateral radiographs show an osteolytic lesion involving the subchondral bone of the tibial plateau. Cortical thinning and expansion can be seen. (C) Coronal T1-weighted image shows subchondral extension of the tumor (arrow). Tumor contents demonstrate low signal intensity on the coronal (C) and axial (D) T1-weighted images and are hyperintense on the coronal (E) and axial (F) T2-weighted images. Peritumoral edema (arrow) is noted on the axial fat-suppressed T2-weighted fast spin-echo image (F).
|
 |
|
FIGURE 14-65 ● Expansile giant cell tumor of the proximal fibula. Anteroposterior radiograph (A) shows a lytic lesion with periosteal reaction (arrow). Coronal T1-weighted image (B) demonstrates low-signal-intensity tumor (arrow). Cystic areas within the tumor (arrows) are shown on axial T2-weighted (C) and fat-suppressed T2-weighted fast spin-echo (D) images. T1-weighted fat-suppressed coronal (E) and axial (F) images after administration of intravenous gadolinium demonstrate enhancement of the lesions. Nonenhancing areas corresponding to cystic/necrotic changes are seen on the axial image (arrowhead). (G) Axial CT image demonstrates low-density cystic/necrotic areas within the tumor (arrows).
|
-
MR imaging is nonspecific in differentiating benign from malignant processes.
-
Most benign and malignant tumors show increased T1 and T2 signal.
-
Cortical destruction, soft-tissue masses, and involvement of neurovascular bundles are more common in malignant tumors.
-
MR imaging findings suggestive of tumor recurrence include new edema, convex margins of the treatment site, and nodular enhancement.
-
With MR imaging, intramedullary marrow involvement, soft-tissue extension, areas of necrosis, skip-lesions, metastases, and postoperative recurrence can be accurately assessed.
-
Osteosarcoma can arise de novo (primary osteosarcoma) or in association with preexisting lesions of bone such as Paget—s disease, prior radiation, or bone infarcts.
-
Telangiectatic osteosarcoma can simulate an aneurysmal bone cyst.
-
Frank cortical disruption, soft-tissue extension, and periosteal reaction in a preexisting enchondroma or osteochondroma are suspicious for malignant transformation to chondrosarcoma.
-
Ewing sarcoma predominately involves the flat bones and diaphyses of long bones.
-
The tibia is involved in 90% of cases of adamantinoma.
-
MR imaging should be performed if there is suspicion of metastatic disease and radiographs are normal.
-
Distinguishing primary lymphoma of bone from secondary involvement is important because the latter has a worse prognosis and is treated differently.
-
The reappearance of edema, characterized by low signal intensity on T1-weighted images and high signal on T2-weighted images
-
A new area of increased signal intensity on T2-weighted images with a corresponding area of intermediate signal intensity on T1-weighted images
-
A change in the contour of a muscle or postoperative surgical field, such that the margins are convex instead of concave
-
New areas of nodular enhancement in the postoperative surgical field
after exposure to a mutagenic event such as irradiation. In osteosarcoma associated with Paget—s disease, bones other than the long bones (e.g., the pelvis, skull, facial bones, and scapula) are involved. Osteosarcomas arising in Paget—s disease have a poorer prognosis than conventional de novo osteosarcomas.61
 |
|
FIGURE 14-66 ● Primary osteosarcoma of bone. Coronal graphic illustrations of the knee and shoulder show osteosarcoma with sclerotic and lytic areas and aggressive periosteal reaction involving the proximal tibia (A), distal femur (B), and proximal humerus (C).
|
-
Telangiectatic osteosarcomas are especially difficult to assess histologically because the viable cells and anaplastic cells are obscured by hemorrhage and necrosis or camouflaged within benign reactive cells of the walls, which simulates an aneurysmal bone cyst (Fig. 14-67).72,74 It was thought to have a worse prognosis than conventional osteosarcoma, but now the prognosis is considered similar. On radiographs, the telangiectatic variant appears lytic because of the lack of demonstrable bone production. MR images show an aggressive, destructive lesion, usually accompanied by an associated soft-tissue mass. The inhomogeneity of signal intensity, with both low- and high-signal-intensity areas on T1- and T2-weighted images and fluid–fluid levels, reflects the high degree of vascularity and the presence of large hemorrhagic cystic spaces (Fig. 14-68).
-
Approximately 10% of primary osteosarcomas are tremendously rich in bone production and are classified as
P.2097
sclerosing or osteoblastic osteosarcoma.96 At times, the bone and osteoid are deposited in massive solid amounts. Frequently, the mineralization extends into the soft tissues.97 Blastic components remain low in signal intensity on T1- and T2-weighted images, but associated peritumoral edema or nonsclerotic areas generate increased signal intensity on T2-weighted or STIR images (Fig. 14-69). -
Chondroblastic osteosarcoma is seen in approximately 5% of cases.96 The generation of chondroid elements, whether benign or malignant, contributes to increased signal intensity on T2-weighted images.
-
Osteosarcomas that produce large amounts of spindly fibroblasts are classified as fibroblastic osteosarcoma, seen in approximately 4% of cases.96 There is no convincing evidence that chondroblastic or fibroblastic subtypes of osteosarcoma have different prognoses.96
-
Central, low-grade osteosarcoma, a rare type of osteosarcoma arising in medullary bone, is so well differentiated that it is frequently mistaken for a benign condition both radiologically and histopathologically. Patients are usually young adults and may have had symptoms for years at the time of presentation. Much of the lesion appears circumscribed, simulating fibrous dysplasia. A search for small foci of cortical destruction may be essential for accurate diagnosis. The prognosis in low-grade osteosarcoma is excellent. Metastases occur late, if ever, but local recurrences may be a serious problem if surgery is inadequate.96 On MR imaging, the low-grade central osteosarcoma may be difficult to distinguish from a conventional osteosarcoma, which has an identical radiographic appearance.
 |
|
FIGURE 14-67 ● Coronal graphic illustration shows telangiectatic osteosarcoma of the distal femur. Hemorrhagic areas are shown in red.
|
 |
|
FIGURE 14-68 ● Telangiectatic osteosarcoma. (A) Coronal T1-weighted and (B) axial T2-weighted images show intraosseous and extraosseous tumor extension (white arrows) with heterogeneous cystic hemorrhagic components (white arrowhead) and fluid–fluid levels (black arrows).
|
-
Periosteal osteosarcoma, which accounts for 0.3% of all osteosarcomas, favors the diaphyseal surface of long tubular bones and forms an irregular thickened cortex. Histologically, hyaline chondrosarcomatous elements are a prominent feature.98
-
Parosteal osteosarcoma occurs most frequently on the metaphyseal surface of long tubular bones within the parosteal soft tissue and forms a lobulated mass. Histologically it is characterized by a fibrous proliferation surrounding parallel lamellar bony spicules. The fibrous component can appear externally bland, mimicking a fibrous dysplasia. Unlike periosteal osteosarcomas, chondrosarcomatous elements are minimal or absent in parosteal osteosarcomas.99,100
-
High-grade surface osteosarcoma is the least common of the surface osteosarcomas. It is typically seen in the second decade of life and is histologically identical to the conventional intramedullary form. These lesions can be distinguished from dedifferentiated parosteal osteosarcoma by a lack of adjacent low-grade areas. The prognosis for high-grade surface osteosarcoma is
P.2098
the worst of surface osteosarcomas and is similar to that of the conventional type.
 |
|
FIGURE 14-69 ● Osteosarcoma of the proximal tibia. Coronal (A) and sagittal (B) T1-weighted images show marrow replacement with cortical break and a soft-tissue mass of intermediate signal (arrows). Areas of sclerosis are hypointense (arrowheads). Osteosarcoma and soft-tissue mass are hyperintense on the sagittal fat-suppressed T2-weighted fast spin-echo image (C). Areas of sclerosis are hypointense (arrowhead). Non-enhancing necrotic areas are demonstrated on axial (D) and sagittal (E) fat-suppressed T1-weighted images after intravenous administration of gadolinium (arrowheads).
|
(Fig. 14-70). The major cause for failure is stress shielding secondary to stem loosening. This is avoided in newer systems with more compliant, stress-sharing fixation devices.
 |
|
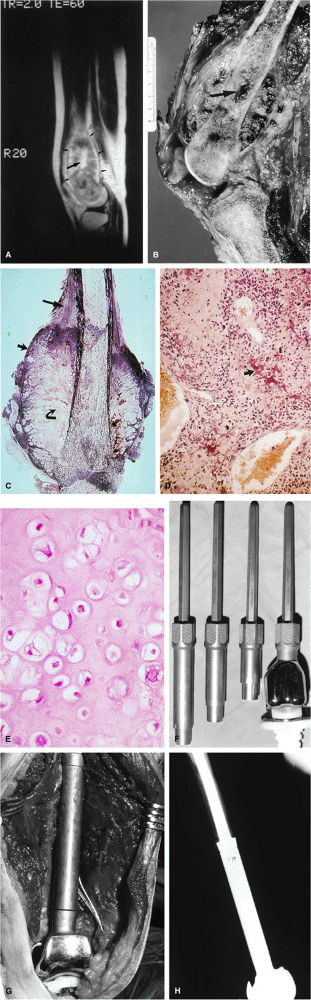
FIGURE 14-70 ● (A) A T2-weighted sagittal image shows osteosarcoma involving the femoral metaphysis (small arrows). Bright contrast portions of the high-signal-intensity tumor represent necrosis with hemorrhage (large arrow). (B) The corresponding gross specimen shows central tumor necrosis (arrow). (C) Macrosection of amputated specimen cut in the coronal plane displaying a large extracortical tumor mass with various tissue types, including young tumor osteoid at the outer edge (short arrow) contrasting with malignant chondroid tissue (curved arrow) that would demonstrate higher signal on T2-weighted images. The long arrow indicates Codman—s reactive triangle. (Reprinted with permission from
Skinner HB, ed. Current diagnosis and treatment in orthopaedics. Norwalk, CT: Appleton & Lange, 1995.
) (D) Low-power photomicrograph of malignant tumor osteoid (arrow). (E) High-power photomicrograph of the malignant chondroid portion of heterogeneous tumor tissue. (F) Photograph of the titanium modular rotating hinge prosthesis used in reconstructive limb-salvage surgery following wide surgical resection of the distal femur. (G) Photograph of the implant at the time of surgical reconstruction prior to wound closure. (H) Radiographic appearance in lateral projection 7 years following surgery. (F and H reprinted with permission from Meyer JL, Vaeth JM, eds. Frontiers in radiation therapy and oncology: organ conservation in curative cancer treatment, vol. 27. Basel: S. Karger AG, 1993.
) |
-
Marrow infiltration can be identified on MR images, even when standard radiographic results are negative or when conventional radiographic findings are misleading.105
-
MR imaging can also be used to differentiate exuberant bone, which is isointense with yellow marrow, from osteosarcoma, which causes both T1 and T2 prolongation.
-
MR scans of aggressive, dedifferentiated osteosarcomas may demonstrate a necrotic, hemorrhagic fluid–fluid level within the more distal marrow cavity.
-
In many cases, there is MR evidence of tumor crossing the physis, although this extension is not evident on conventional radiographs.
-
Lesions that are primarily blastic, and therefore sclerotic on radiographs, demonstrate low signal intensity on both T1- and T2-weighted sequences. However, even in lesions with extensive sclerosis, areas of increased signal intensity may be identified on T2-weighted images.
-
Hemorrhagic components within telangiectatic osteosarcoma demonstrate focal areas of high signal intensity on T1- and T2-weighted images.
-
Skip lesions and multiple sites of involvement are common in multicentric osteosarcoma, which affects a younger age group.107
 |
|
FIGURE 14-71 ● (A) Anteroposterior radiograph showing blastic osteosarcoma as a sclerotic metaphyseal focus with aggressive periosteal reaction (arrows). (B) On a T1-weighted axial image, the lesion is seen as a low-signal-intensity area of marrow replacement with associated soft-tissue extension (arrows). On coronal (C) and axial (D) fat-suppressed T2-weighted fast spin-echo images, hyperintense tumor and soft-tissue component are demonstrated. Soft-tissue component is hyperintense on sagittal fat-suppressed T2-weighted fast spin-echo image (E) (arrows).
|
 |
|
FIGURE 14-72 ● Osteosarcoma of the distal femur. (A) Coronal T1-weighted image demonstrates marrow infiltration (arrowhead) with cortical destruction and extension into the adjacent soft tissues (arrows). (B) On a sagittal proton density-weighted image, aggressive periosteal reaction and soft-tissue extension are demonstrated (arrows). (C) On a coronal fat-suppressed T2-weighted fast spin-echo image, the tumor is hyperintense (black arrows) with hypointense areas corresponding to sclerosis (white arrow). Aggressive periosteal reaction is hyperintense (arrowhead). (D) Coronal contrast-enhanced fat-suppressed T1-weighted image shows central nonenhancing areas, consistent with necrosis (arrows).
|
-
A mottled or speckled pattern of intermediate signal intensity on T1-weighted images and high signal intensity on T2-weighted images, best appreciated on T2-weighted images, which corresponds to tumor matrix, edematous granulation tissue, and hemosiderin deposits
-
A distinct multicystic or bubbly appearance in the cystic pattern, of intermediate to high signal intensity on T1-weighted images and high signal intensity on T2-weighted images, thought to correspond to either blood-filled cysts with viable tumor cells or tumor matrix mixed with edematous granulation tissue. However, foci of residual viable tumor cannot be specifically diagnosed.
-
Skip metastases, a reduction in peritumoral edema, the development of a dark rim of collagenous capsule continuous with the periosteum, bone infarcts, and intramedullary vascular channels can all be identified.
 |
|
FIGURE 14-73 ● Parosteal osteosarcoma. Anterior coronal (A) and axial (B) T1-weighted images show a large lobulated mass of low signal intensity arising from the metadiaphyseal surface of the tibia (arrows). Tumor is hyperintense on sagittal (C) and axial (D) fat-suppressed T2-weighted fast spin-echo images. Tumor enhancement is noted on axial fat-suppressed T1-weighted image (E) following administration of intravenous gadolinium.
|
-
Grade 1 (i.e., well-differentiated) chondrosarcomas consist of pure hyaline cartilage exhibiting mild anaplasia and mild increased cellularity.
-
Cellularity and anaplasia are greatest in poorly differentiated or grade 3 variants.
-
The 5-year survival rates of patients with grades 1, 2, and 3 disease are approximately 90%, 81%, and 43%, respectively.61
-
Grades 1 and 2 neoplasms (i.e., the majority of chondrosarcomas) do not usually metastasize, whereas grade 3 neoplasms tend to form hematogenous metastases.
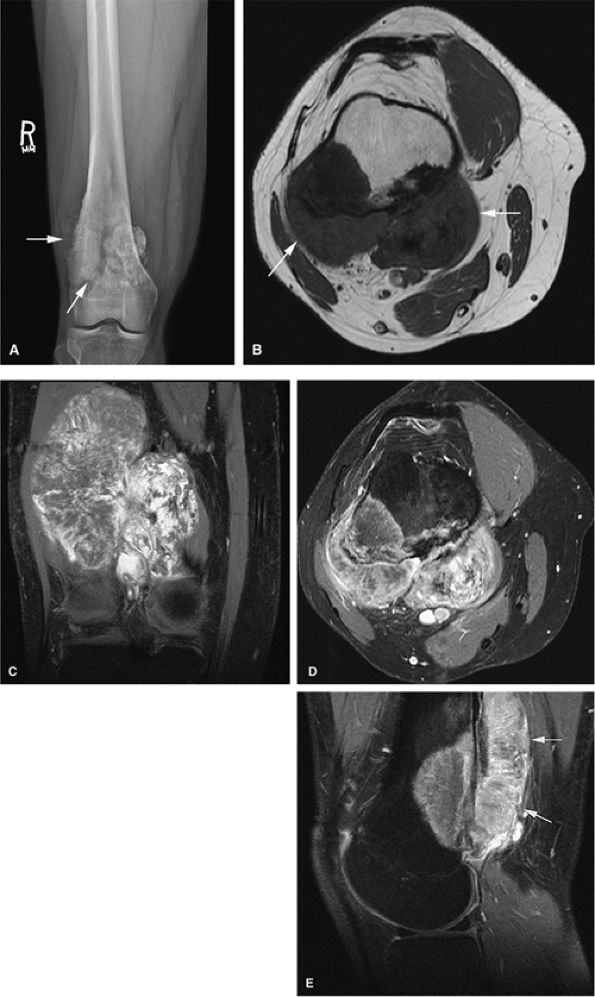
centrally, are composed of characteristic lobules of gray-white translucent tissue with spotty calcification.61 The adjacent cortex may be thickened or eroded, with extension of the neoplasm into the surrounding soft tissues.
 |
|
FIGURE 14-74 ● Chondrosarcoma of the proximal femur (A) and calcaneus (B). Chondroid tissue is shown in blue. Note cortical destruction and soft-tissue extension.
|
with a combination of a metallic Neer prosthesis and a cadaver allograft. Tendinous tags have been left intact for reattachment to the original structures, allowing for excellent limb function for many years to come. Preoperative MR imaging is extremely helpful in planning these reconstructive procedures by providing accurate evaluation of the extent of tumor growth down the medullary canal and out into the surrounding soft tissue. These same preoperative imaging studies assist the prosthesis manufacturers in the design of the prosthetic implant.
 |
|
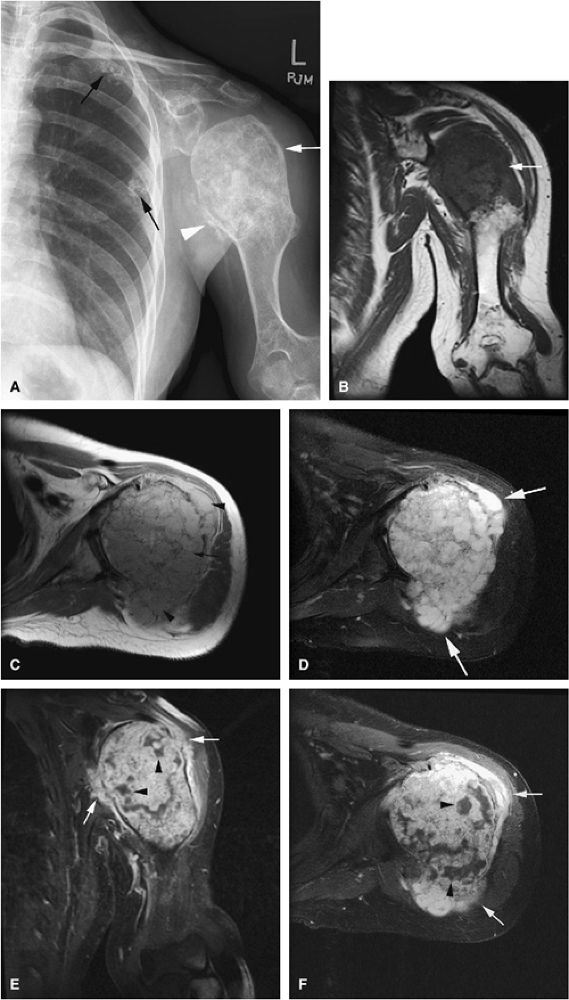
FIGURE 14-75 ● (A) A coronal T1-weighted image shows aggressive destruction of the proximal humerus (curved arrows) with a large soft-tissue component (straight arrow). This is characteristic of chondrosarcoma. Axial T1-weighted (B) and T2*-weighted (C) images show the degree of anterior, posterior, and lateral tumor extension (curved arrows), as well as the degree of marrow expansion (open arrows). (D) Macrosection of tumor breaking out of the humoral head beneath the deltoid muscle with benign enchondral ossification (white arrow), which is seen as signal void on T2-weighted images. (Reprinted with permission from Henderson C, Wilson C, Phillips T, et al., eds. Current cancer diagnosis and treatment. Norwalk, CT: Appleton & Lange, in press.) (E) High-power photomicrograph demonstrating numerous dividing chondroblasts (arrow) typical of chondrosarcoma. (F) Surgical photograph of allograft used in limb-salvage reconstruction following wide resection with rotator cuff tendon (arrow). (G) Long-stem metallic Neer prosthesis with pectoralis tendon allograft (arrow). (H) Photograph of completed alloprosthetic reconstruction with reattachment of the rotator cuff (curved arrow) and pectoralis and latissimus dorsi tendons (straight arrow). (I) Postoperative anteroposterior radiograph with Neer stem cemented into the distal humerus. (G through I reprinted with permission from
Meyer JM, Vaeth JM, eds. Frontiers of radiation therapy and oncology: organ conservation in curative cancer treatment, vol. 27. Basel, S. Karger AG, 1993.
) |
cortical destruction, and the frequent association of an extraosseous component. MR findings include the following:
 |
|
FIGURE 14-76 ● (A) An anteroposterior radiograph of the femur shows characteristic annular and comma-shaped calcifications within central or medullary chondrosarcoma (arrows). (B) Coronal T1-weighted and (C) axial fat-suppressed T2-weighted fast spin-echo images accurately depict marrow involvement. Tumor is hyperintense on the fat-suppressed T2-weighted fast spin-echo image. Calcifications are seen as dark-signal-intensity foci (arrow). (D) Contrast-enhanced axial fat-suppressed T1-weighted image shows cortical thinning posteriorly (arrow).
|
 |
|
FIGURE 14-77 ● Coronal T1-weighted (A) and fat-suppressed T2-weighted (B) fast spin-echo images demonstrate low-grade chondrosarcoma involving the sacrum and ilium. The chondroid matrix is hyperintense on the T2-weighted image. (C) Contrast-enhanced fat-suppressed T1-weighted image demonstrates peripheral enhancement (arrows). Cortical destruction and soft-tissue extension are seen.
|
-
MR imaging can be used to characterize changes of marrow involvement prior to medullary expansion (Fig. 14-76).
-
Fat-suppressed T2-weighted fast spin-echo images are sensitive to associated soft-tissue masses (Fig. 14-77).
-
On T2-weighted images, calcifications are identified as low-signal-intensity foci that contrast with the bright-signal-intensity tumor.
-
A low-signal-intensity fibrous septum may be seen, separating homogeneous high-signal-intensity lobules of hyaline cartilage.78
-
Heterogeneity of signal intensity correlates with higher-grade, more cellular lesions.117
-
Gadolinium administration may produce enhancement in a ring and arc septal pattern (Fig. 14-78).7,64
-
On T2-weighted images, areas of malignant transformation demonstrate greater signal intensity than adjacent enchondromas.
-
Malignant degeneration or transformation can be inferred by the presence of frank cortical disruption, soft-tissue extension, periosteal reaction, and disproportionate size of lesion relative to satellite enchondromas.
-
Although these findings have been confirmed by pathologic evaluation, reliable MR criteria have not been developed to characterize these aggressive cartilage lesions. MR imaging is useful in the evaluation of aggressive extraskeletal mesenchymal chondrosarcoma, where soft tissue origin is common.118 In these extraskeletal lesions, MR imaging demonstrates enhancement, lobulation, and extent of disease, whereas CT is more accurate in characterizing calcifications.
 |
|
FIGURE 14-78 ● (A and B) Axial CT images showing a large chondrosarcoma arising from the left superior pubic ramus. Punctate calcifications (arrows) are well visualized on the CT images. T2-weighted sagittal (C) and axial (D) images show a large heterogeneous cartilage tumor arising from the left pubic ramus. (E) Axial fat-suppressed T1-weighted contrast-enhanced image shows enhancement in a ring and arc septal pattern.
|
is increased to 74%.122 For nonresectable tumors, adjuvant radiation therapy rather than surgery is used in conjunction with chemotherapy. In these cases, the prognosis is less favorable.
 |
|
FIGURE 14-79 ● (A) Sagittal and (B) axial graphic illustrations of the femur and (C) coronal graphic illustration of the ilium show destructive intramedullary Ewing sarcoma with lamellated periosteal reaction. Large soft-tissue component is seen on the axial image (arrows).
|
 |
|
FIGURE 14-80 ● (A) Proton density axial image of a 12-year-old boy with an extensive intermediate-signal soft-tissue abnormality representing extensive round cell infiltrate and edema into the surrounding muscle compartments from a Ewing sarcoma of the femur. (B) Same proton density study after two cycles of chemotherapy, with dramatic shrinkage of the tumor margins (arrow). (C) Photograph of the amputated specimen, with arrow indicating the same tumor margin seen in B. (D) Gross macrosection of same specimen, with extracortical tumor margin indicated by arrow.
|
-
There is usually a substantial soft-tissue component associated with Ewing sarcoma, which is well evaluated with MR imaging. Since MR imaging provides excellent delineation of soft tissues, the extent of muscular and neurovascular involvement in extraosseous Ewing sarcoma can be accurately assessed.
-
In addition, Ewing sarcoma originating in bone marrow can be identified in the early stages, before cortical erosion and periostitis have developed.
-
Multilamellar periosteal reactions and an atypical pattern of cortical thickening and saucerization in Ewing sarcoma have also been identified on MR scans.125 The rare periosteal Ewing sarcoma can be distinguished from the more common medullary and soft-tissue Ewing sarcoma because of its location, predominance in males, and lack of presenting metastases.126
-
MR imaging has been used after chemotherapy to more accurately define tumor margins and assess the interval decrease in adjacent peritumoral edema.
 |
|
FIGURE 14-81 ● Ewing sarcoma of the femur. (A) Coronal T1-weighted MR image demonstrates low-signal-intensity tumor involving the femoral diaphysis with extension into the metaphysis. (B) Coronal and (C) axial fat-suppressed T2-weighted fast spin-echo images show peritumoral edema and soft-tissue components (arrows). Edema, marrow, and soft-tissue components demonstrate low signal intensity on the T1-weighted image and high signal intensity on the T2-weighted images. (D) Axial fat-suppressed T1-weighted image after the administration of intravenous gadolinium shows enhancement of the soft-tissue component (arrows).
|
 |
|
FIGURE 14-82 ● Ewing sarcoma. High-signal-intensity tumor and soft-tissue mass (arrows) are seen on coronal (A) and axial (B) fat-suppressed T2-weighted fast spin-echo images.
|
 |
|
FIGURE 14-83 ● (A) On a T1-weighted image, marrow involvement (arrows) of Ewing sarcoma is seen as foci of decreased signal intensity. (B) On a fat-suppressed T2-weighted fast spin-echo image, foci of involved marrow show increased signal (arrows). (C) Tumor enhancement is seen on contrast-enhanced axial fat-suppressed T1-weighted image.
|
 |
|
FIGURE 14-84 ● A lytic lesion involving the distal tibia from plasmacytoma is shown on a sagittal graphic illustration. Areas of internal hemorrhage are shown in orange.
|
 |
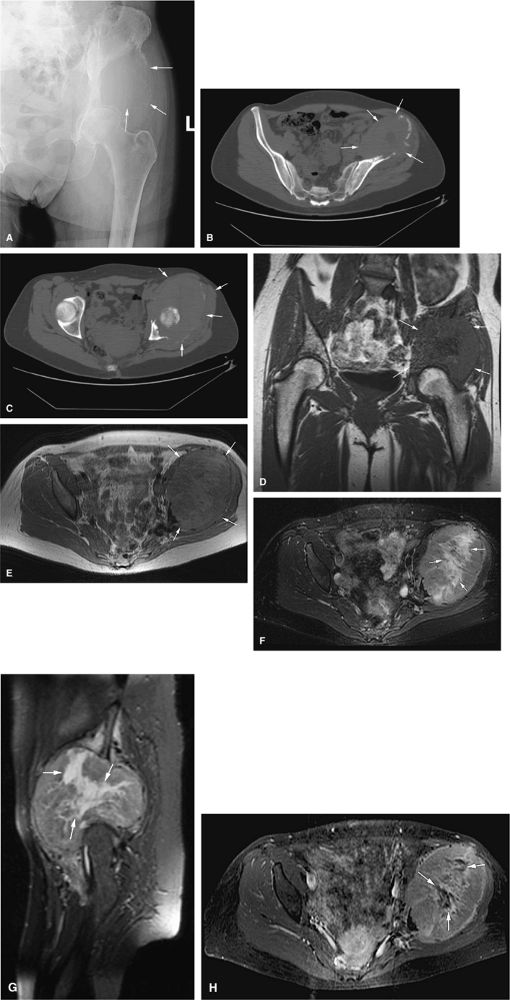
|
FIGURE 14-85 ● Plasmacytoma of the right ilium. (A) Coronal T1-weighted MR image reveals an intermediate-signal-intensity mass (arrows) with aggressive cortical transgression and soft-tissue extension. (B) Axial fat-suppressed T2-weighted fast spin-echo image shows hyperintense tumor and soft-tissue mass (arrows). (C) Axial fat-suppressed T1-weighted image following intravenous administration of contrast demonstrates non-enhancing central areas of necrosis (arrows).
|
Peritumoral edema or small focal areas of hyperintensity may be identified within the tibial cortex. These areas of increased signal intensity may correspond to osteolytic defects adjacent to sclerotic bone (Fig. 14-87). Adamantinomas are characteristically located in the middle third of the tibia and have a cortical or eccentric center.
observed in the absence of a soft-tissue mass. Sequential postcontrast MR images can help to differentiate tumor from perineoplastic edema.9 Osteolytic metastatic lesions, commonly from carcinoma of the lung or breast, often demonstrate a more uniform signal intensity on T1- and T2-weighted images than do mixed sclerotic or osteoblastic deposits from carcinoma of the prostate or medulloblastoma. Lesions of enostosis or osteopoikilosis may mimic blastic metastatic deposits; however, no aggressive features are associated with enostosis or osteopoikilosis (Fig. 14-91).
 |
|
FIGURE 14-86 ● Adamantinoma of the tibia. Sagittal graphic illustration shows an adamantinoma involving the anterolateral cortex of tibia with associated anterior bowing.
|
 |
|
FIGURE 14-87 ● (A) Sagittal T1-weighted images show an eccentric sclerotic adamantinoma in the anterior tibial diaphysis (arrows). (B) The tumor is hypo-intense on the axial T1-weighted image. (C) Axial fat-suppressed T2-weighted fast spin-echo image shows areas of cortical hyperintensity (arrow). (D) Corresponding axial CT image demonstrates sclerotic eccentric tumor with central lucency (arrow).
|
 |
|
FIGURE 14-88 ● Metastatic thyroid cancer. (A) An anteroposterior radiograph shows cortical destruction and a large lytic lesion of the iliac wing (arrows). Axial CT scans (B and C) show destruction of the left iliac wing with a large associated soft-tissue mass (arrows). On coronal T1-weighted (D) and axial proton density-weighted (E) images, the low- to intermediate signal-intensity metastatic tumor and soft-tissue mass are noted (arrows). On the corresponding axial (F) and sagittal (G) STIR images, the metastatic tumor (arrows) demonstrates intermediate signal intensity, with central areas of fluid signal, indicating necrosis. (H) The axial fat-suppressed T1-weighted image following administration of intravenous gadolinium shows central nonenhancing areas, indicating necrosis (arrows).
|
 |
|
FIGURE 14-89 ● Metastatic lung cancer to the foot. Coronal graphic illustration shows a metastatic lesion with a pathologic fracture (arrow) involving the metatarsal. Metastases to the hands and feet are usually from lung cancer.
|
 |
|
FIGURE 14-90 ● Metastatic renal cell carcinoma involving the L1 and L3 vertebral bodies is seen on sagittal (A) and axial (B) CT images. The CT scan reveals the lytic destruction (arrows) in precise detail. (C) This sagittal STIR image shows hyperintense tumor with involvement of the posterior elements and extension into the spinal canal, causing cord compression. Marrow infiltration of the L3 vertebral body (arrowhead) is noted.
|
 |
|
FIGURE 14-91 ● Asymptomatic low-signal-intensity multiple bone islands are seen on a sagittal proton density-weighted image (A), an axial T1-weighted image (B), and an axial fat-suppressed T2-weighted image (C) of the knee. The morphology and distribution of these bone islands are characteristic of osteopoikilosis (arrows).
|
 |
|
FIGURE 14-92 ● Primary lymphoma of bone is shown as a hemorrhagic intramedullary mass in red on coronal graphic illustrations of the knee (A) and distal forearm (B).
|
 |
|
FIGURE 14-93 ● Primary lymphoma of bone involving the distal femur. (A) Coronal T1-weighted images show low-signal-intensity lymphomatous marrow replacement crossing the physeal scar and involving the subchondral bone. (B) An extraosseous soft-tissue component is present on the axial T1-weighted image (arrows). (C) This sagittal proton density-weighted image demonstrates lymphomatous involvement of intermediate signal with associated soft-tissue component (arrows). On (D) sagittal and (E) axial fat-suppressed T2-weighted fast spin-echo images, the tumor is of intermediate signal and hyperintense compared to adjacent bone marrow. Associated soft-tissue mass (arrows) and surrounding bone marrow edema (black arrowhead) are noted. (F) Coronal and (G) axial contrast-enhanced fat-suppressed T1-weighted images show enhancement of the tumor with nonenhancing areas (arrows) representing necrosis.
|
-
Ability to assess associated cortical and marrow involvement
-
Improved depiction of the tissue planes surrounding the lesion and muscle textural patterns
-
Ability to assess neurovascular involvement
-
Benign soft-tissue tumors are usually homogeneous and well marginated.
-
Lipomas follow the signal intensity of fat on all pulse sequences. Low-signal-intensity septations may be present.
-
Hemangiomas are ill defined, with areas of high T1 signal due to fat or slow-flowing blood.
-
If MR imaging is nondiagnostic for hemangioma, it is important to obtain radiographs, since phleboliths can be missed on MR examinations.
-
Fibromatosis represents a group of benign disorders characterized by fibrous growth and a tendency to infiltrate adjacent tissues and to recur. They may appear to be very aggressive and may be mistaken for sarcoma.
-
Juvenile fibromatosis demonstrates low signal on T1- and T2-weighted images.
-
Benign peripheral nerve sheath tumors are best seen on long axis (coronal or sagittal) imaging planes and appear as fusiform masses entering and exiting a nerve.
 |
|
FIGURE 14-94 ● Subcutaneous lipoma, shown in yellow, of the anterior thigh.
|
 |
|
FIGURE 14-95 ● A soft-tissue lipoma (arrows) located in the posterior chest wall, superficial to the deltoid muscle, demonstrates subcutaneous fat signal intensity on an axial T1-weighted image (A), which suppresses on the fat-suppressed T2-weighted fast spin-echo image (B). (C) No enhancement is seen on the corresponding fat-suppressed T1-weighted image after intravenous gadolinium administration.
|
 |
|
FIGURE 14-96 ● Intramuscular lipoma of the vastus intermedius (arrows) showing fat signal intensity on a T1-weighted axial image (A), which suppresses on the fat-suppressed T1-weighted coronal image (B) after intravenous gadolinium administration. No significant enhancement is seen.
|
 |
|
FIGURE 14-97 ● Intramuscular lipoma of the shoulder (arrows) demonstrates bright fat signal intensity on coronal T1-weighted image (A). Fat signal suppresses on the corresponding coronal (B) and axial (C) fat-suppressed T2-weighted fast spin-echo images.
|
 |
|
FIGURE 14-98 ● Axial graphic illustration demonstrates ill-defined intramuscular lipoma (in yellow) of the thigh.
|
 |
|
FIGURE 14-99 ● Large infiltrative lipoma of the calf demonstrates high signal intensity on coronal (A) and axial (B) T1-weighted images and low signal on corresponding coronal (C) and axial (D) fat-suppressed T2-weighted fast spin-echo images. (E) No significant enhancement is seen on the contrast-enhanced axial T1-weighted fat-suppressed image.
|
 |
|
FIGURE 14-100 ● Axial graphic illustrations showing lipomatosis of the chest and abdominal wall in yellow. (A) Diffuse infiltration of the paraspinal muscles and left chest wall and (B) infiltration of the paraspinal muscles and left abdominal wall.
|
cortical bone. Hemangiomas can be treated by CT-guided percutaneous ethanol injection (Fig. 14-105).151,152,153,154,155,156
 |
|
FIGURE 14-101 ● Cavernous hemangioma of the forearm is shown in red. Central phleboliths are shown in gray.
|
 |
|
FIGURE 14-102 ● Hemangioma of the hand with calcified phleboliths. Extensive soft-tissue swelling involving the thumb, index finger, and thenar region is noted.
|
 |
|
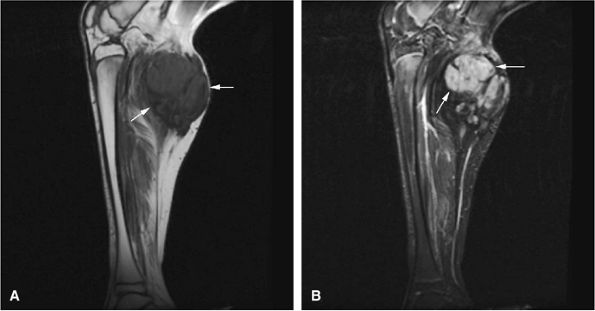
FIGURE 14-103 ● Hemangioma within the vastus medialis (arrows) demonstrates high signal intensity on a coronal T1-weighted image (A) and bright signal intensity on coronal (B) fat-suppressed T2-weighted fast spin-echo images. (C) Hemangioma within the vastus medialis (arrow) demonstrates bright signal intensity on axial fat-suppressed T2-weighted fast spin-echo images. Fat-suppressed T1-weighted image following the intravenous administration of gadolinium (D) shows enhancement of the lesion.
|
 |
|
FIGURE 14-104 ● Intramuscular hemangioma of the brachialis muscle (arrows). Sagittal (A) and axial (B) T1-weighted and corresponding fat-suppressed T2-weighted sagittal (C) and axial (D) images show an ill-defined serpiginous soft-tissue mass. Fat content within the hemangioma is bright on the T1-weighted images (A and B) and suppresses on the fat-suppressed T2-weighted fast spin-echo images (C and D).
|
 |
|
FIGURE 14-105 ● Axial CT images from alcohol ablation of intramuscular hemangioma of the biceps. (A) A soft-tissue mass is noted on this pretreatment image. Fat within the lesion is hypodense (arrow). (B through D) Injection of iodinated contrast and ethanol is demonstrated on axial CT images.
|
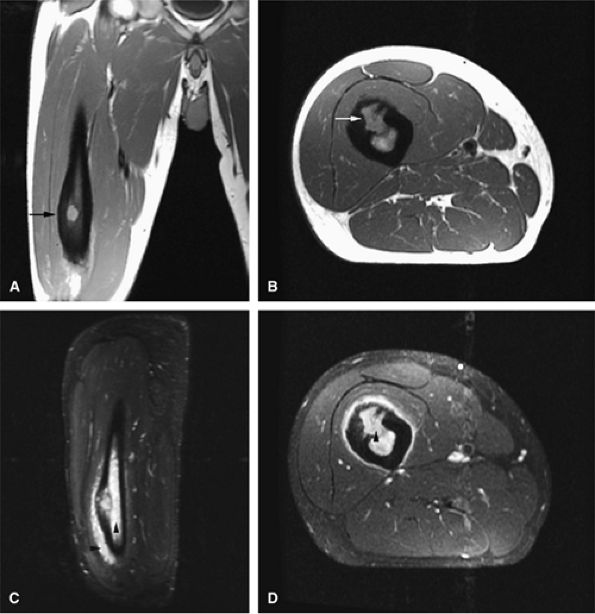
to adjacent skeletal muscle.157 Increased signal intensity on T1-weighted images can be attributed to fat, protein, or both. Lesions of fibromatosis may also show varying degrees of increased signal intensity on T2, T2*, and STIR sequences (Fig. 14-107). Axial and sagittal MR images are useful in assessing the fibrous lesions of plantar fibromatosis. These fibrous nodules, which involve the plantar aponeurosis, demonstrate low signal intensity on T1- and T2-weighted sequences (Figs. 14-108 and 14-109).
 |
|
FIGURE 14-106 ● (A) Hemangiopericytoma of the vastus medialis and intermedius muscles shows hypervascularity (large arrow) and erosion of the adjacent cortex (small arrows) on an anteroposterior radiograph. T2-weighted coronal (B) and axial (C) images show low-signal-intensity hypervascularity (small black arrows), cortical erosion (small white arrows), and bright signal intensity (large arrow).
|
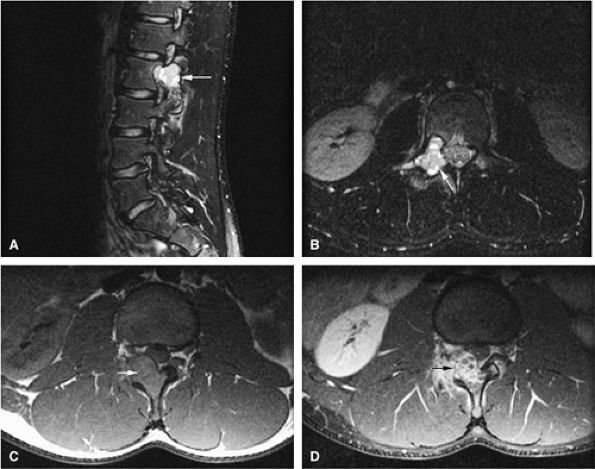
neurovascular structures. They exhibit the same signal intensity as fluid on T1- and T2-weighted images (Fig. 14-112).160
 |
|
FIGURE 14-107 ● Fibromatosis of the calf. (A) Sagittal T1-weighted and (B) fat-suppressed T2-weighted fast spin-echo images show a soft-tissue mass in the upper calf. The tumor is of intermediate signal intensity on the T1-weighted image and demonstrates high signal intensity with low-signal-intensity fibrous stroma on the fat-suppressed T2-weighted images (arrows).
|
 |
|
FIGURE 14-108 ● Plantar fibromatosis is seen as a heterogeneous mass in gray infiltrating the adjacent muscles.
|
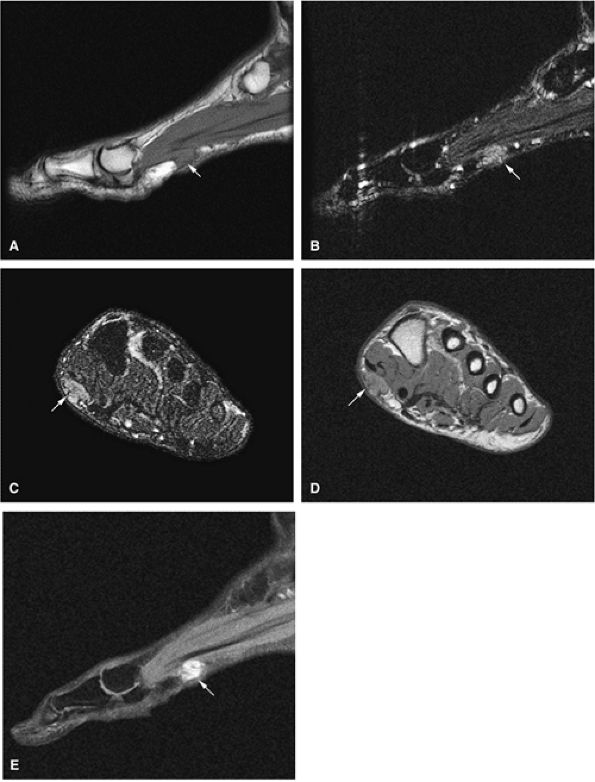 |
|
FIGURE 14-109 ● Plantar fibromatosis (arrows). A soft-tissue mass is shown at the plantar surface of the foot on (A) a sagittal T1-weighted image, sagittal (B) and axial (C) STIR images, and (D) an axial proton density-weighted image. The mass is of intermediate signal on the T1- and proton density-weighted images and displays intermediate to low signal on the STIR image. (E) There is enhancement on this post-contrast fat-suppressed T1-weighted sagittal image.
|
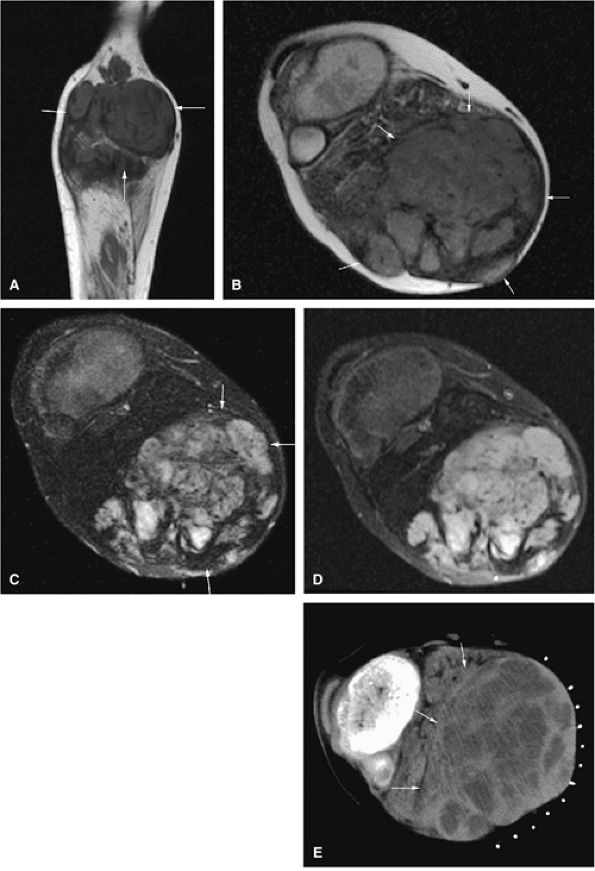 |
|
FIGURE 14-110 ● Desmoid tumor of the calf (arrows). Coronal (A) and axial (B) T1-weighted images show a large heterogeneous soft-tissue mass in the posterior calf. (C) On an axial fat-suppressed T2-weighted fast spin-echo image, the mass is of intermediate signal with low-signal fibrous strands. (D) A contrast-enhanced axial fat-suppressed T1-weighted image shows heterogeneous enhancement. (E) A corresponding axial CT image demonstrates a hetero-geneous mass with areas of low density.
|
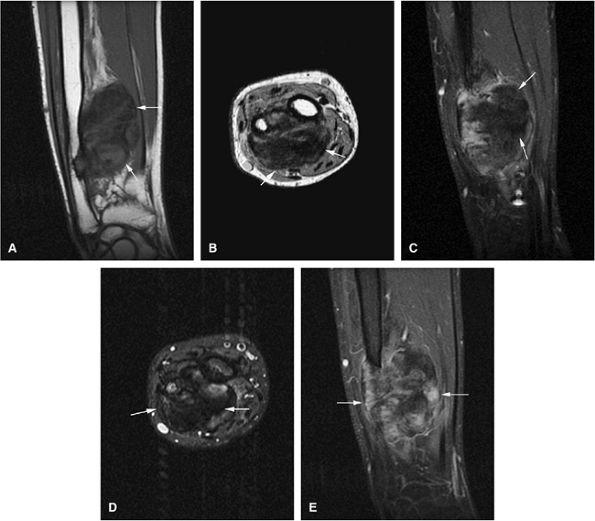 |
|
FIGURE 14-111 ● Juvenile fibromatosis of the forearm. Fibrous tissue demonstrates low signal intensity (arrows) on coronal (A) and axial (B) T1-weighted images and sagittal (C) and axial (D) fat-suppressed T2-weighted fast spin-echo images. Enhancement is noted on a coronal T1-weighted fat-suppressed image (E) after intravenous administration of gadolinium.
|
-
Solitary localized nodules
-
Diffuse thickening of skin and subcutaneous tissues
-
“Plexiform” tumors representing worm-like multinodular growths that expand to contiguous major or minor nerves
involves the neuroectoderm, mesoderm, and endoderm and is associated with multiple neurofibromas. The plexiform pattern is characteristic of neurofibromatosis (Fig. 14-113).146
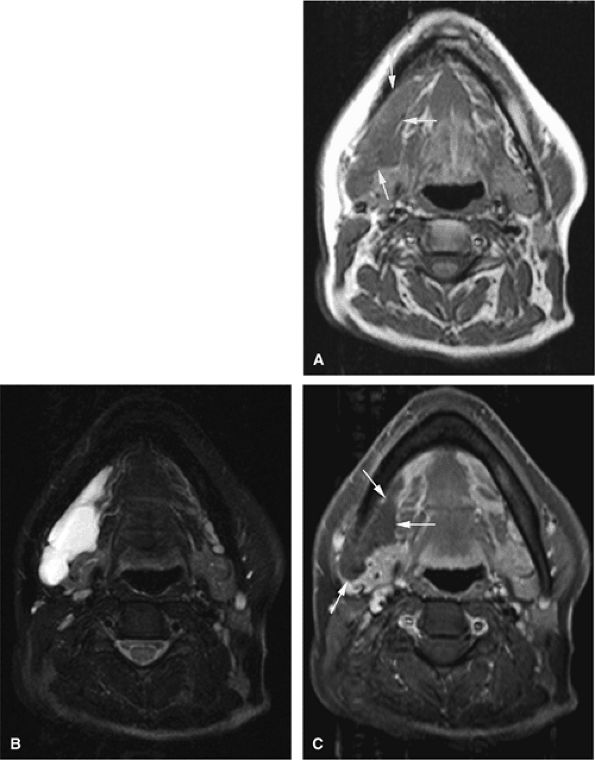 |
|
FIGURE 14-112 ● Cystic hygroma of the parapharyngeal space. (A) Axial T1-weighted image shows areas of low signal intensity (arrows) deep to the right mandible. (B) On the corresponding axial fat-suppressed T2-weighted fast spin-echo image, the fluid-filled cystic structure demonstrates high signal intensity. (C) No enhancement of the mass is seen on this fat-suppressed axial T1-weighted image after administration of gadolinium (arrows).
|
-
They demonstrate low to intermediate signal intensity on T1-weighted images and uniform bright signal intensity on T2-weighted images and on gadolinium-enhanced T1-weighted images.
-
The target sign with a center of low signal due to collagen and condensed Schwann cells is frequently seen (Fig. 14-115).161
-
In patients with neurofibromatosis, MR imaging is used not only to evaluate the soft-tissue extent of disease, but also to assess spinal canal, adjacent cortical bone, and marrow involvement.162
-
Plexiform neurofibromas may be distinguished from non-plexiform types by the presence of longitudinal tracking along neural fascicles in a lobulated fashion (Figs. 14-116 and 14-117).
 |
|
FIGURE 14-113 ● Multiple spinal plexiform neurofibromas in a patient with neurofibromatosis type 1. Hemorrhage within a lesion is shown in red.
|
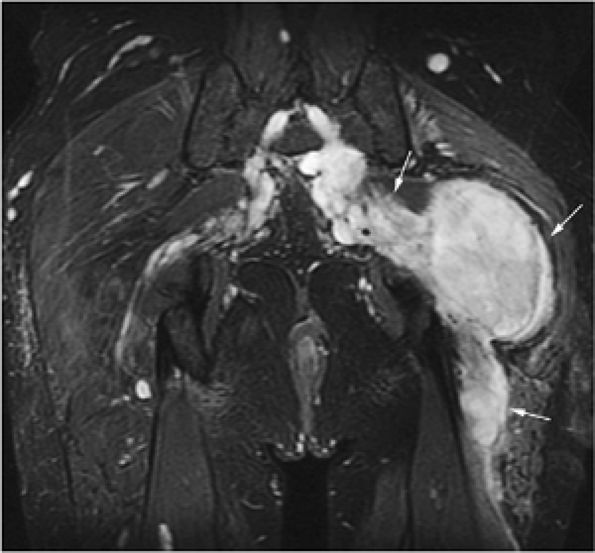 |
|
FIGURE 14-114 ● Large neurofibroma (arrows) arising from the sciatic nerve in a patient with neurofibromatosis type 1. The tumor is hyperintense on the coronal fat-suppressed T2-weighted fast spin-echo image. There is enlargement of the sciatic nerve.
|
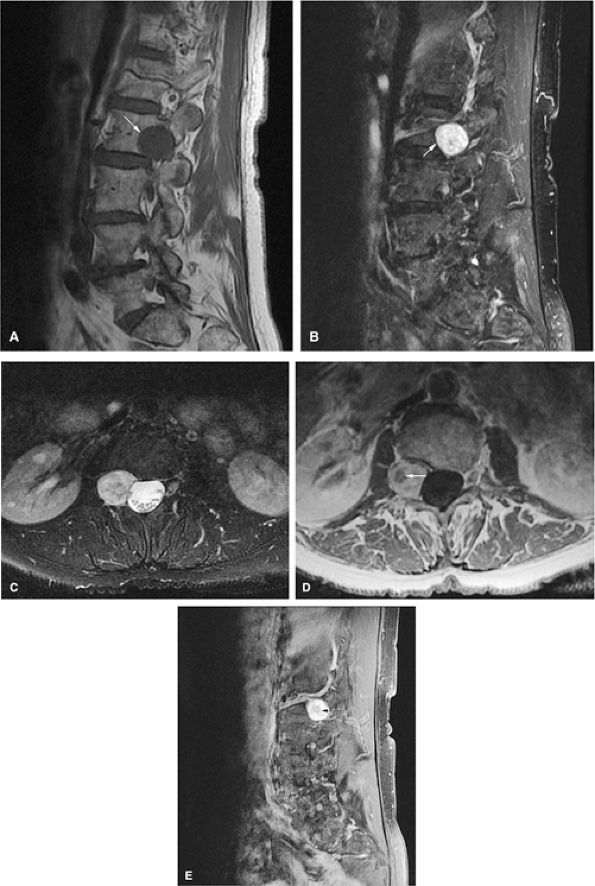 |
|
FIGURE 14-115 ● Schwannoma arising from the lumbar spine. (A) A sagittal T1-weighted image showing a circumscribed hypointense mass (arrow) causing expansion of the neural foramen and scalloping of the L2 vertebral body. The schwannoma is hyperintense on sagittal fat-suppressed T2-weighted fast spin-echo images (B) (arrow). (C) The schwannoma is hyperintense on axial fat-suppressed T2-weighted fast spin-echo images. An axial contrast-enhanced T1-weighted image (D) and a sagittal contrast-enhanced T1-weighted image with fat suppression (E) demonstrate the target sign with a central low-signal-intensity area and surrounding hyperintensity (arrows).
|
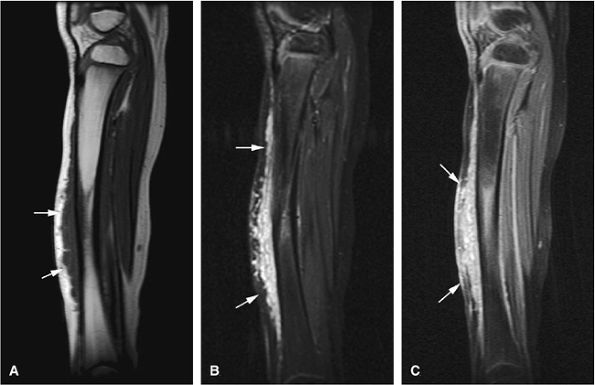 |
|
FIGURE 14-116 ● Plexiform neurofibroma (arrows) in a child with neurofibromatosis type 1. An extensive lobular soft-tissue mass is seen extending along the anterior tibia. It displays low signal on a sagittal T1-weighted image (A) and high signal on the corresponding fat-suppressed T2-weighted fast spin-echo image (B). (C) Contrast enhancement of the mass is seen on a sagittal fat-suppressed T1-weighted image following administration of intravenous gadolinium. Tibial dysplasia with bowing is noted.
|
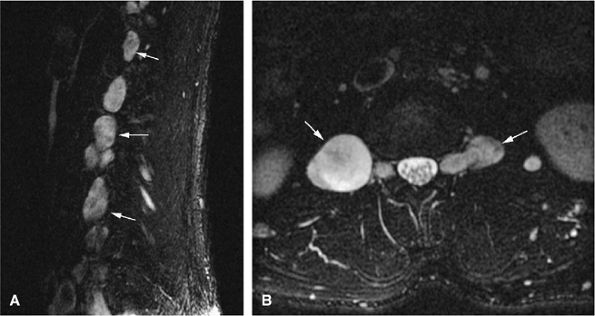 |
|
FIGURE 14-117 ● Sagittal (A) and axial (B) fat-suppressed T2-weighted fast spin-echo images display multiple T2 hyperintense plexiform neurofibromas (arrows) arising from the lumbar spine in a patient with neurofibromatosis type 1. No compression of the spinal canal is seen.
|
-
Liposarcomas often do not contain visible fat on MR images.
-
Myxoid liposarcomas may appear as cystic lesions on T2-weighted images, so gadolinium contrast is necessary to diagnose solid lesions.
-
Consider malignant transformation when a preexisting neurofibroma enlarges.
-
FDG-PET is useful in detecting malignant change in plexiform neurofibromas.
-
Synovial sarcomas do not arise from synovium or joints.
-
Synovial sarcomas can be misdiagnosed as benign lesions, such as ganglions, if no intravenous contrast is administered.
-
Malignant fibrous histiocytoma often presents as a hemorrhagic mass, and extensive areas of hemorrhage can obscure the underlying neoplasm. Therefore, intravenous contrast is required for evaluation of suspected hematomas.
-
Well differentiated
-
Round cell
-
Myxoid
-
Pleomorphic
-
On T1-weighted images, lesions with a greater cellular component may demonstrate lower signal intensity relative to fatty elements.
-
Focal areas of malignant change within a lipomatous matrix demonstrate low to intermediate signal intensity on T1-weighted sequences and high signal intensity on T2-weighted and contrast-enhanced sequences (Fig. 14-120).165
-
Well-differentiated liposarcomas demonstrate fat composition with thick septa, which are hyperintense on T2-weighted images.159
-
Although well-differentiated subtypes contain fat, other histopathologic types may not demonstrate fat signal intensity.
-
Myxoid liposarcomas are hyperintense on fat-suppressed T2-weighted fast spin-echo images (Fig. 14-121). Gadolinium enhancement may help to demonstrate central myxoid degeneration, not always seen on T2-weighted images.
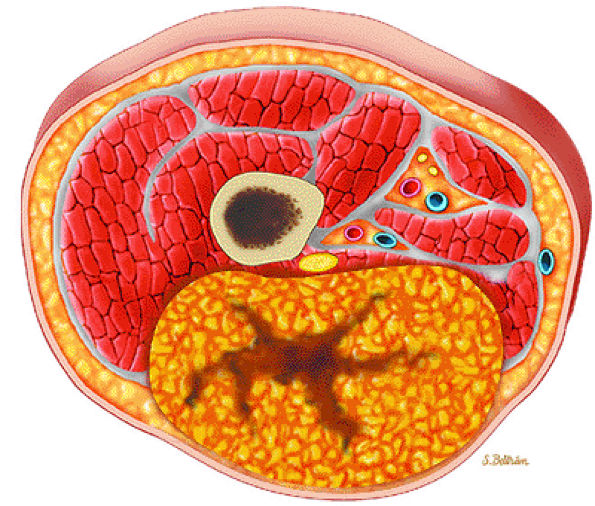 |
|
FIGURE 14-118 ● Axial graphic illustration showing liposarcoma in yellow. Central areas of necrosis are shown in brown.
|
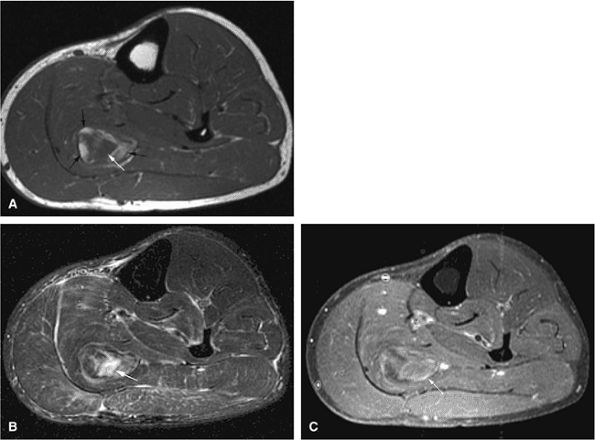 |
|
FIGURE 14-119 ● (A) T1-weighted axial image through the lower leg displays a high-signal-intensity lipomatous mass in the soleus muscle (black arrows). Central areas of low signal intensity are present (white arrow). Corresponding axial fat-suppressed T2-weighted fast spin-echo image (B) and axial fat-suppressed T1-weighted contrast-enhanced image (C) show sarcomatous change as high signal intensity and enhancement (arrows).
|
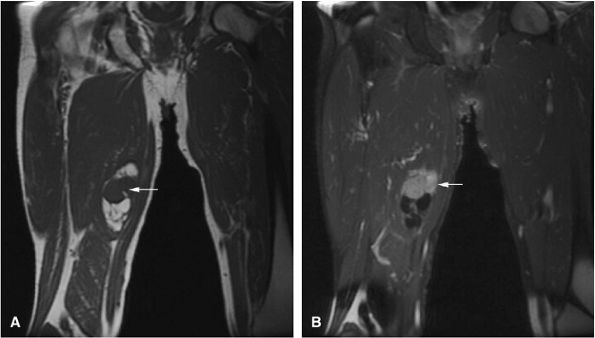 |
|
FIGURE 14-120 ● Liposarcoma of the medial thigh. (A) Coronal T1-weighted image and (B) coronal contrast-enhanced fat-suppressed T1-weighted image demonstrate a mixture of high- and low-signal abnormalities. Sarcomatous change is low signal on the T1-weighted image and demonstrates enhancement on the fat-suppressed T1-weighted image following administration of intravenous gadolinium (arrows).
|
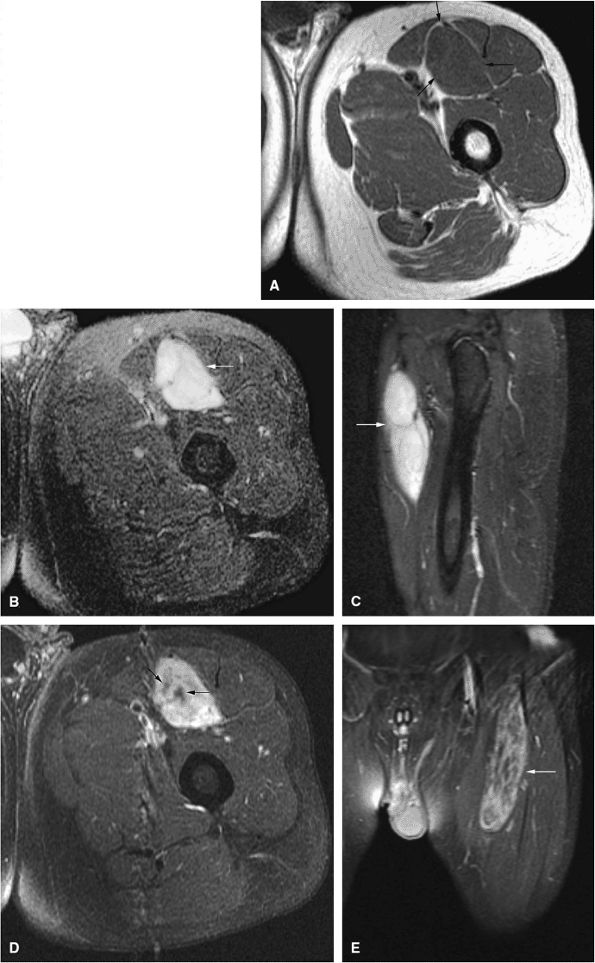 |
|
FIGURE 14-121 ● Myxoid liposarcoma of the anterior thigh (arrows). (A) Axial T1-weighted image demonstrates a low-signal soft-tissue mass, isointense to muscle, located between the sartorius, vastus intermedius, and rectus femoris muscles. The mass appears cystic and hyperintense on axial (B) and sagittal (C) fat-suppressed T2-weighted fast spin-echo images. Axial (D) and coronal (E) fat-suppressed T1-weighted images after the administration of intravenous gadolinium show heterogeneous enhancement, indicating a solid mass.
|
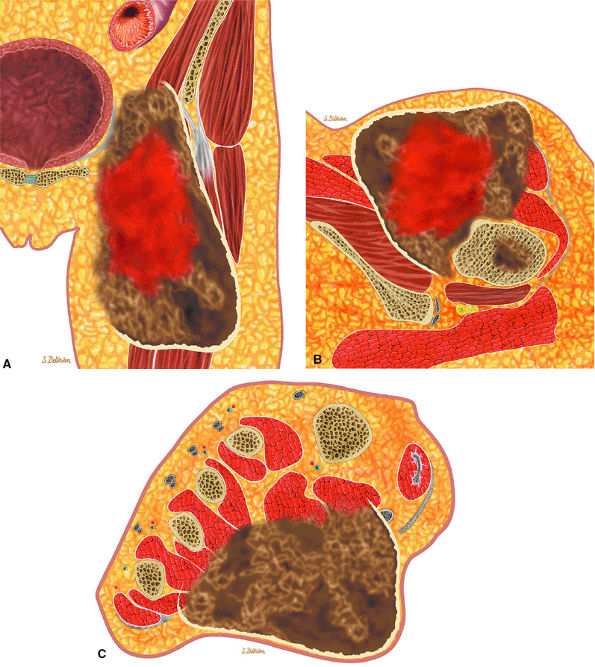 |
|
FIGURE 14-122 ● Leiomyosarcoma of the thigh on coronal (A) and axial (B) graphic illustrations. Bone metastasis is shown in brown. Axial graphic illustration (C) shows leiomyosarcoma of the foot.
|
-
Synovial sarcomas display low to intermediate signal intensity on T1-weighted images and are homogeneously bright on T2-weighted images. It is important to note that the increased signal intensity on T2 or fat-suppressed T2-weighted fast spin-echo sequences is less than that of fluid, and it should not be mistaken for a cystic fluid collection or ganglion if intermediate-signal-intensity areas are present.
-
Small areas of central necrosis can be seen as regions of higher signal intensity (Fig. 14-127).
-
Focal calcifications, although detected on MR images, are better delineated on CT scans or radiographs (Fig. 14-128).
-
A heterogeneous, multilocular mass with internal septation may be the characteristic feature on MR images. Extensive loculations with multiple fluid–fluid levels secondary to hemorrhage have also been observed.170
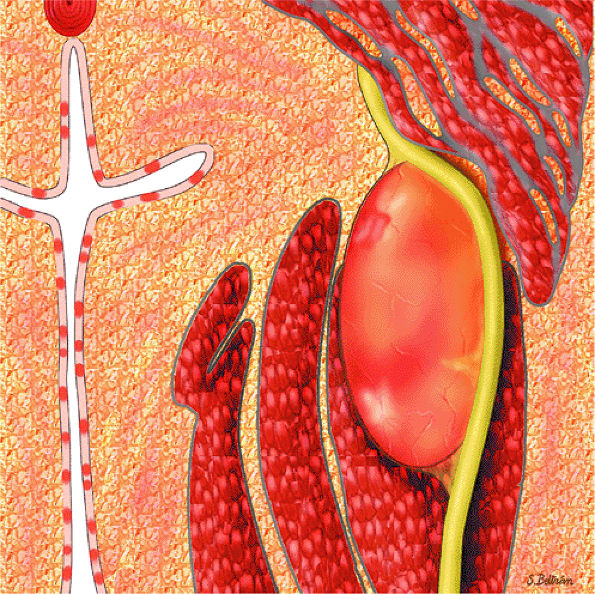 |
|
FIGURE 14-123 ● Malignant peripheral nerve sheath tumor associated with neurofibromatosis. Coronal graphic illustration shows a large fusiform mass in the thigh. The sciatic nerve is seen entering and exiting the mass. Numerous superficial neurofibromas are present.
|
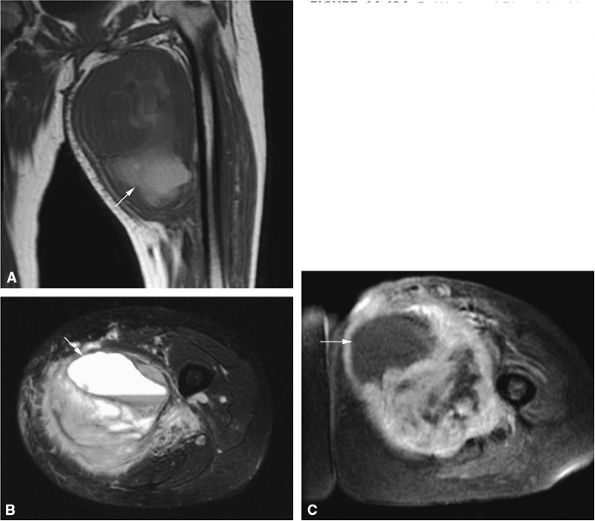 |
|
FIGURE 14-124 ● (A) Coronal T1-weighted image of a malignant peripheral nerve sheath tumor of the adductor compartment shows high-signal hemorrhage (arrow) within the tumor. (B) Axial fat-suppressed T2-weighted fast spin-echo image shows a hyperintense cystic area (arrow) with a fluid–fluid level, corresponding to the hemorrhage. (C) Axial fat-suppressed T1-weighted image after the intravenous administration of gadolinium shows large nonenhancing hemorrhagic area (arrow) within the tumor.
|
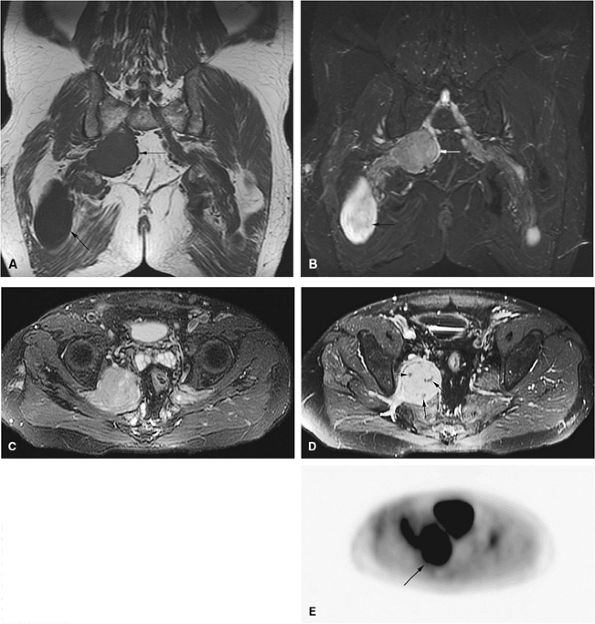 |
|
FIGURE 14-125 ● Malignant peripheral nerve sheath tumor arising from a plexiform neuro-fibroma in a patient with neurofibromatosis type 1. (A) Coronal T1-weighted image shows two large masses arising from the right sciatic nerve (arrows). Enlargement of the left sciatic nerve is also noted. (B) Corresponding coronal fat-suppressed T2-weighted fast spin-echo image demonstrates typical T2 hyperintensity of the more inferior mass (black arrow), likely representing a benign neurofibroma. The superior mass is of intermediate signal intensity (white arrow). (C) Axial fat-suppressed T2-weighted fast spin-echo image demonstrates heterogeneity and intermediate signal of the more superior mass arising from the sciatic nerve. (D) The corresponding axial contrast-enhanced fat-suppressed T1-weighted image shows heterogeneous enhancement, with nonenhancing areas (arrows) representing necrosis. (E) An axial image from a whole-body PET scan shows markedly increased FDG uptake within the mass (arrow), indicating malignant transformation.
|
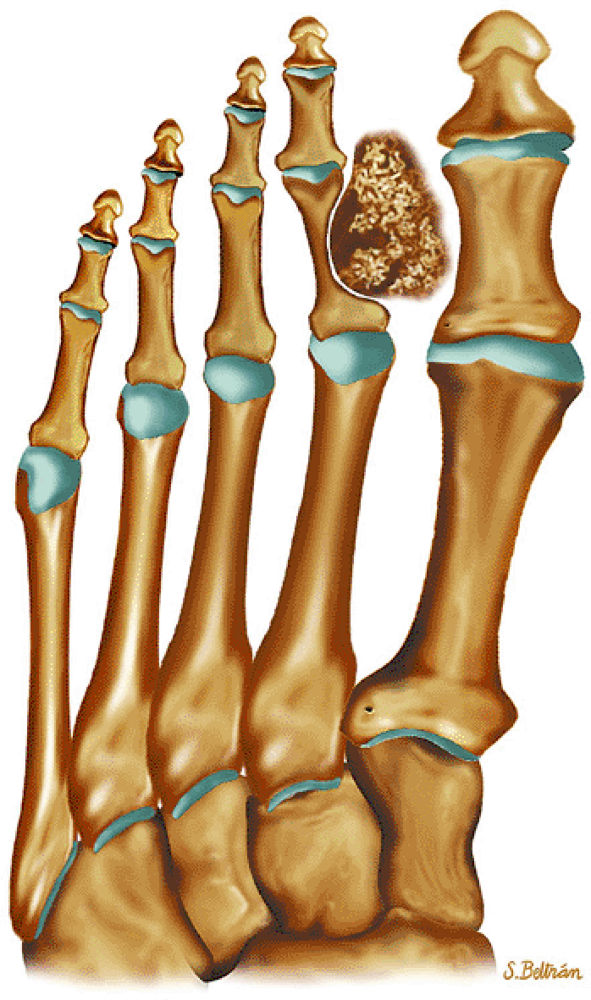 |
|
FIGURE 14-126 ● Coronal graphic illustration shows a synovial sarcoma of the foot in gray. Internal calcifications are present. The mass erodes the proximal phalanx of the second toe.
|
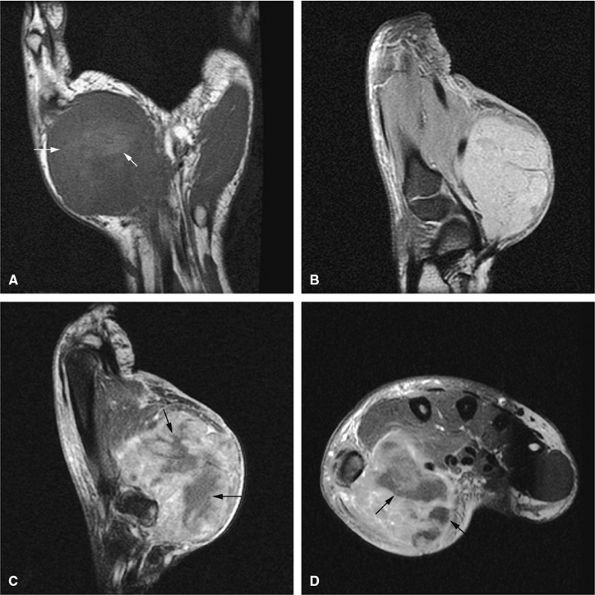 |
|
FIGURE 14-127 ● Large synovial sarcoma of the thenar eminence. (A) Coronal T1-weighted image demonstrates a large heterogeneous mass within the thenar eminence. Areas of high signal are consistent with hemorrhage/necrosis (arrows). (B) Sagittal fat-suppressed T2-weighted fast spin-echo image shows hyperintensity of the mass. Sagittal (C) and axial (D) contrast-enhanced fat-suppressed T1-weighted images show heterogeneous enhancement, with nonenhancing areas (arrows) corresponding to necrosis/hemorrhage.
|
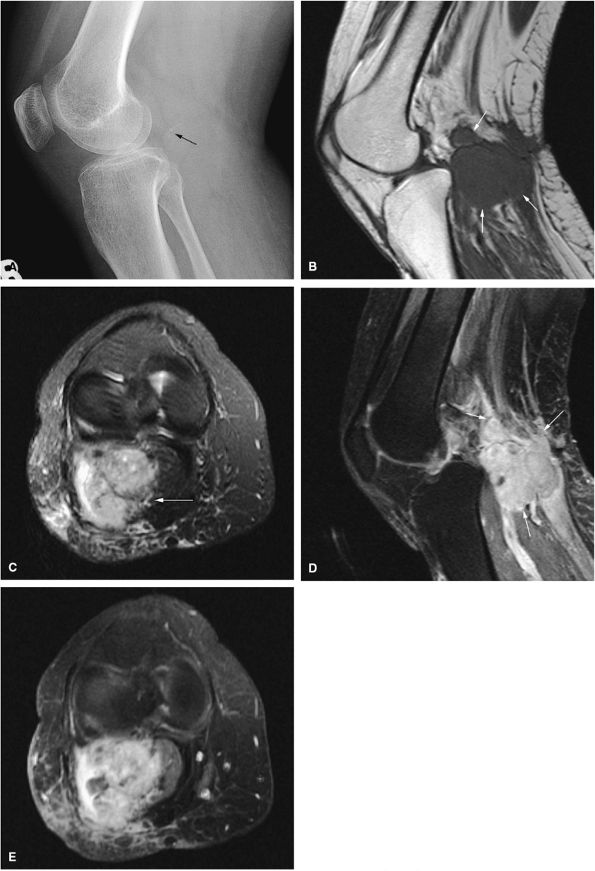 |
|
FIGURE 14-128 ● Synovial sarcoma of the popliteal fossa. (A) Lateral radiograph shows subtle calcifications in the popliteal fossa (arrow). (B) Sagittal T1-weighted image demonstrates a large lobulated soft-tissue mass of low to intermediate signal intensity (arrows). (C) The mass is hyperintense on an axial fat-suppressed T2-weighted fast spin-echo image (arrow). After administration of intravenous gadolinium, the corresponding sagittal (D) and axial (E) fat-suppressed T1-weighted images show a lobulated heterogeneously enhancing soft-tissue mass (arrows).
|
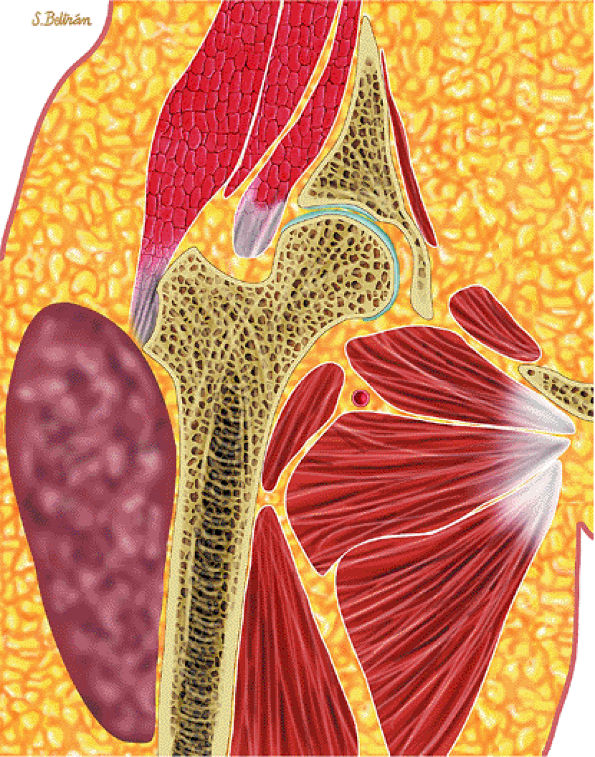 |
|
FIGURE 14-129 ● Pleomorphic malignant fibrous histiocytoma. Coronal graphic illustration shows a large soft-tissue mass in the lateral thigh.
|
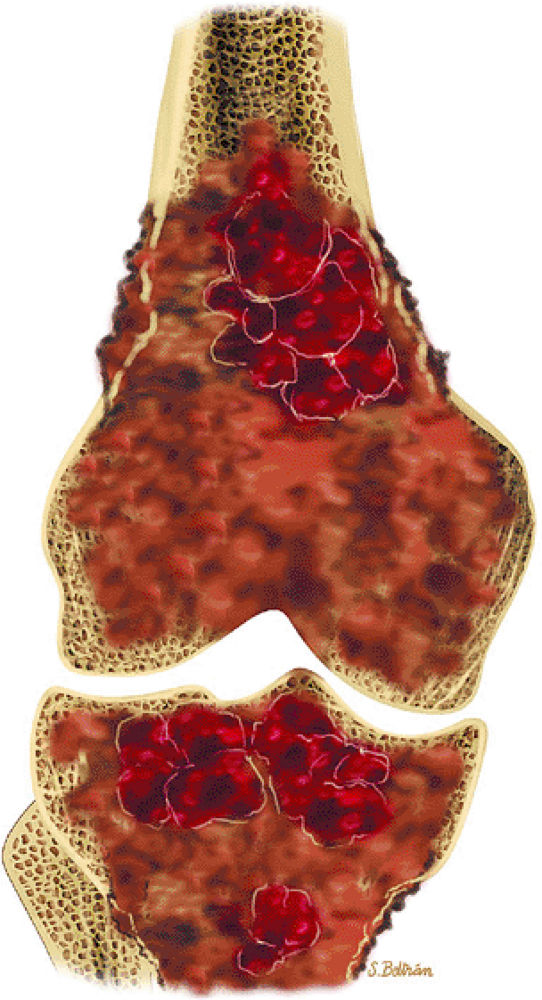 |
|
FIGURE 14-130 ● Malignant fibrous histiocytoma of bone. Coronal graphic illustration shows an intramedullary tumor of the distal femur and proximal tibia with hemorrhagic and necrotic changes and cortical disruption.
|
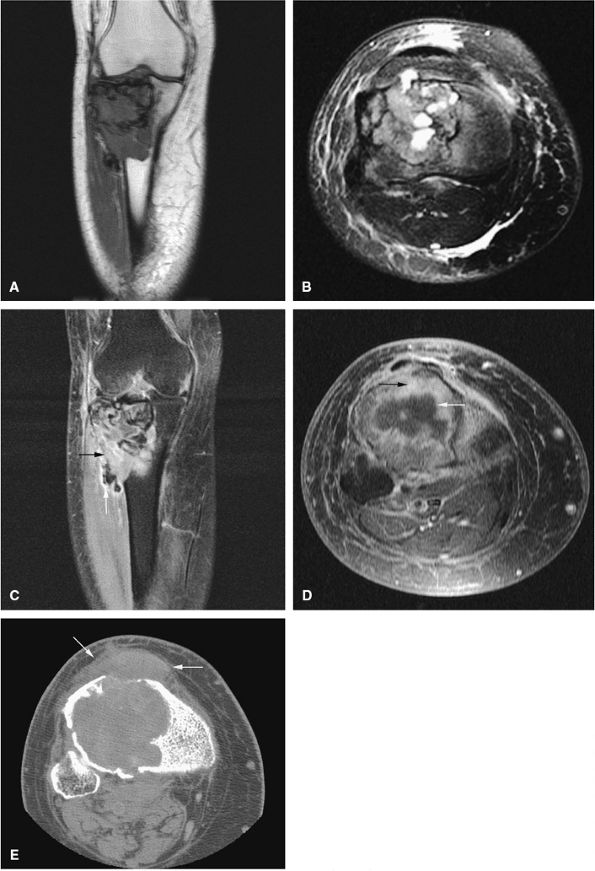 |
|
FIGURE 14-131 ● Malignant fibrous histiocytoma of the proximal tibia is shown on (A) a coronal T1-weighted image, (B) an axial fat-suppressed T2-weighted fast spin-echo image, and fat-suppressed contrast-enhanced T1-weighted coronal (C) and axial (D) images. On the contrast-enhanced images (C and D), tumor necrosis is hypointense (white arrows), whereas viable tumor enhances (black arrows). (E) Axial CT image demonstrates cortical destruction and associated soft-tissue mass (arrows).
|
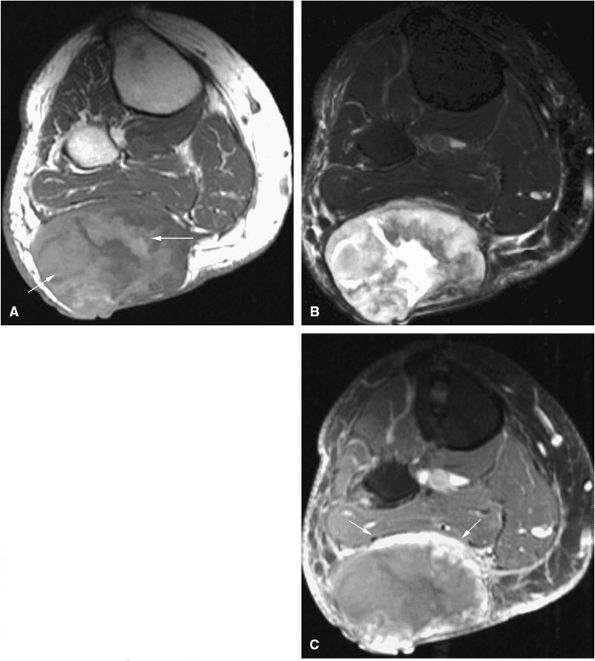 |
|
FIGURE 14-132 ● Malignant fibrous histiocytoma is seen as a large soft-tissue mass involving the posterior calf. (A) The axial T1-weighted image demonstrates areas of high signal intensity, consistent with hemorrhage (arrows). The mass is of heterogeneous signal intensity on the fat-suppressed T2-weighted fast spin-echo image (B) and demonstrates rim enhancement (arrows) on the fat-suppressed T1-weighted axial image following administration of intravenous gadolinium (C).
|
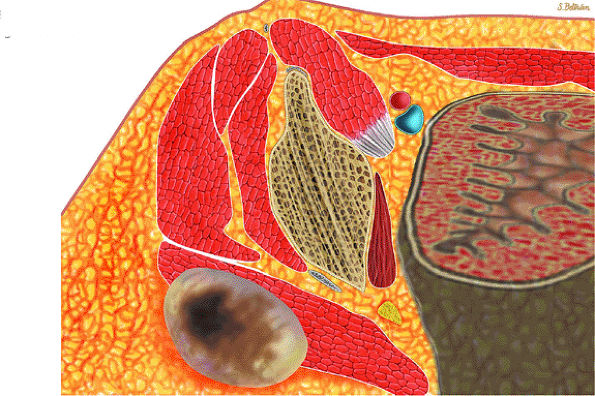 |
|
FIGURE 14-133 ● Fibrosarcoma of soft tissues. Axial graphic illustration shows a heterogeneous mass in the gluteus maximus with central necrosis.
|
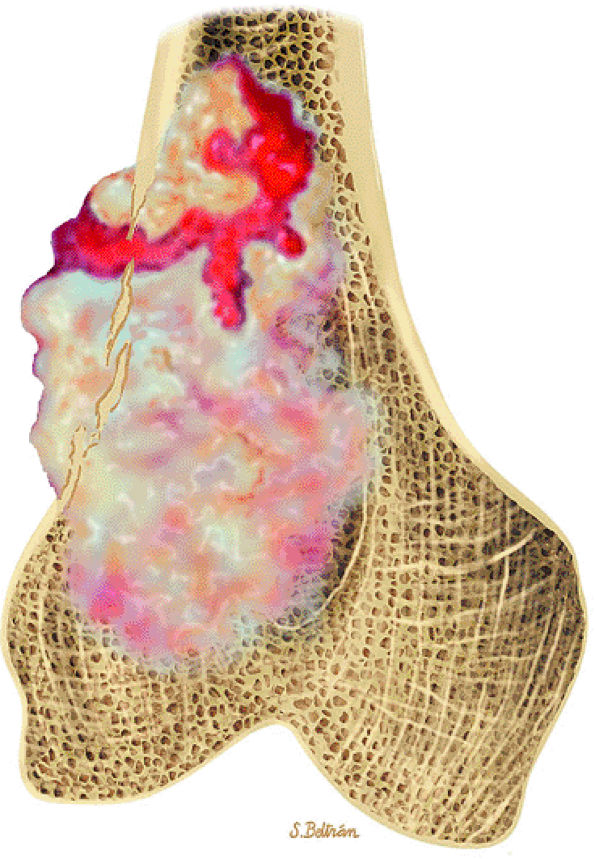 |
|
FIGURE 14-134 ● Fibrosarcoma of bone. Coronal graphic illustration shows a gray-white to tan mass in the distal femur with cortical destruction and soft-tissue extension. Internal hemorrhage is shown in red.
|
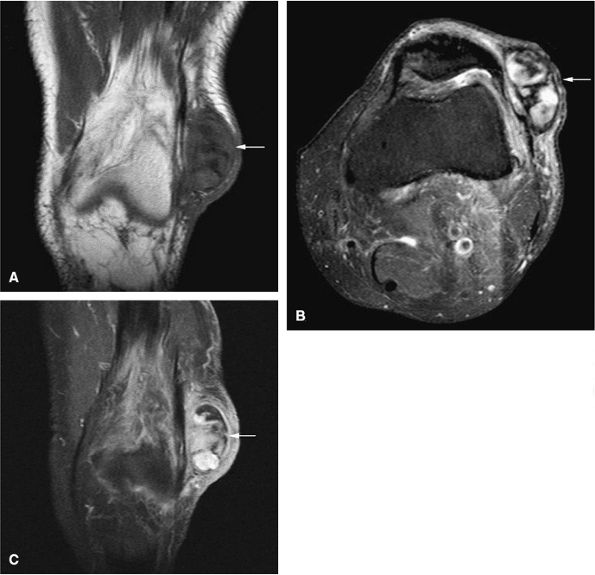 |
|
FIGURE 14-135 ● Soft-tissue fibrosarcoma presenting as a heterogeneous mass at the lateral aspect of the knee (arrows). (A) Coronal T1-weighted, (B) axial fat-suppressed T2-weighted, and (C) coronal fat-suppressed T1-weighted contrast-enhanced images show subcutaneous tumor mass.
|
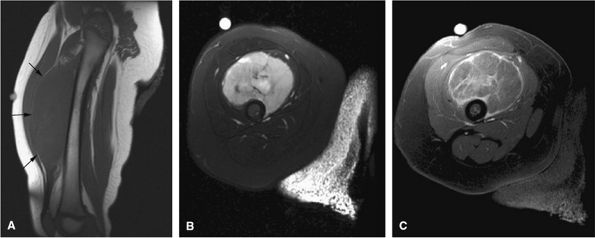 |
|
FIGURE 14-136 ● Soft-tissue fibrosarcoma of the thigh in a newborn. The tumor demonstrates low signal intensity on a T1-weighted sagittal image (A) (arrows) and high signal intensity on a fat-suppressed T2-weighted axial fast spin-echo image (B). Septal enhancement is noted on the axial fat-suppressed T1-weighted image following administration of intravenous gadolinium (C).
|
-
Myositis ossificans may be mistaken for soft-tissue tumor on MR imaging.
-
CT scans or radiographs are often more helpful in showing peripheral calcifications and diagnosing myositis ossificans.
-
Central fatty marrow signal is characteristic for bone infarcts.
-
Subacute hemorrhage is hyperintense on T1-weighted images.
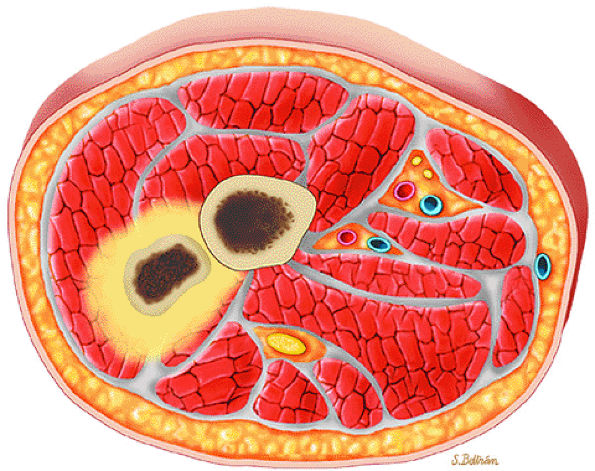 |
|
FIGURE 14-137 ● Myositis ossificans shows peripheral mineralization with surrounding edema.
|
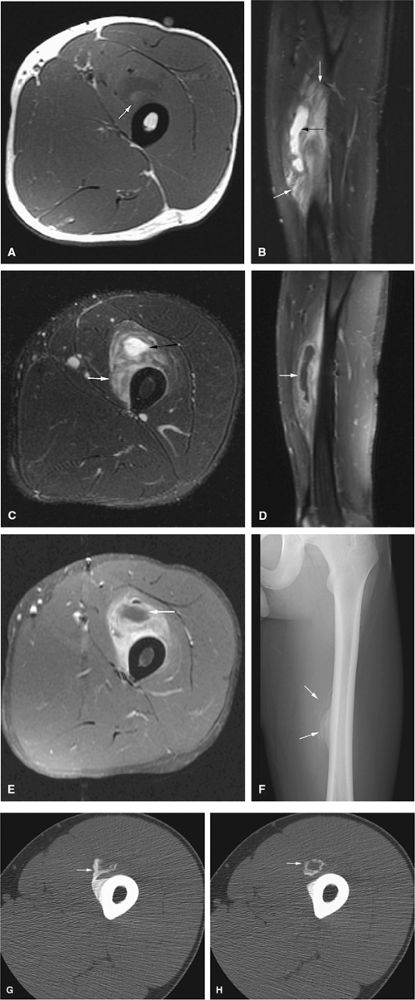 |
|
FIGURE 14-138 ● Myositis ossificans of the thigh. Axial T1-weighted image (A) demonstrates a heterogeneous soft-tissue mass with high T1 signal (arrow) in the anterior thigh. On the sagittal (B) and axial (C) fat-suppressed T2-weighted fast spin-echo images, central cystic areas (black arrows) and marked surrounding edema (white arrows) are noted. Sagittal (D) and axial (E) fat-suppressed T1-weighted contrast-enhanced images show central nonenhancing cystic areas (arrows) and surrounding enhancement. On MR images, the lesion has an aggressive appearance and might be mistaken for a soft-tissue sarcoma. Anteroposterior radiograph (F) demonstrates characteristic peripheral calcifications in the area of the soft-tissue lesion (arrows), confirming the diagnosis of myositis ossificans. Axial CT images (G and H) demonstrate characteristic peripheral calcifications in the area of the soft-tissue lesion (arrows), confirming the diagnosis of myositis ossificans.
|
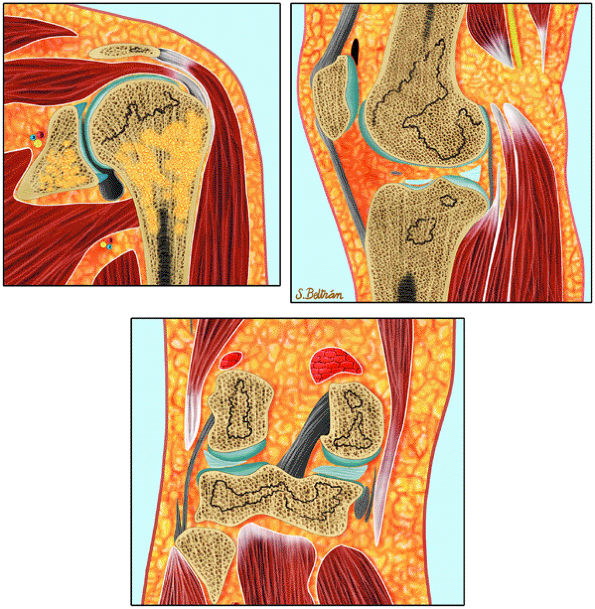 |
|
FIGURE 14-139 ● Bone infarcts of the shoulder and knee with characteristic serpentine lines.
|
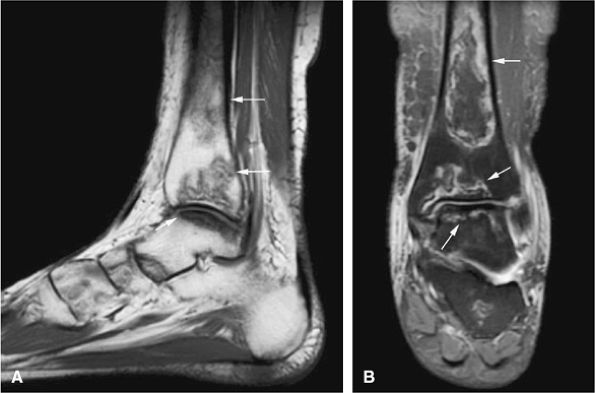 |
|
FIGURE 14-140 ● (A) Low-signal-intensity circumscribed bone infarcts are present in the distal tibia and talus (arrows), as seen on a sagittal T1-weighted image. (B) The infarcts are hyperintense on this coronal fat-suppressed T2-weighted fast spin-echo image (arrows). Central fatty marrow signal intensity is characteristic of bone infarction.
|
 |
|
FIGURE 14-141 ● Axial graphic illustration shows organized hematoma of the chest wall in red.
|
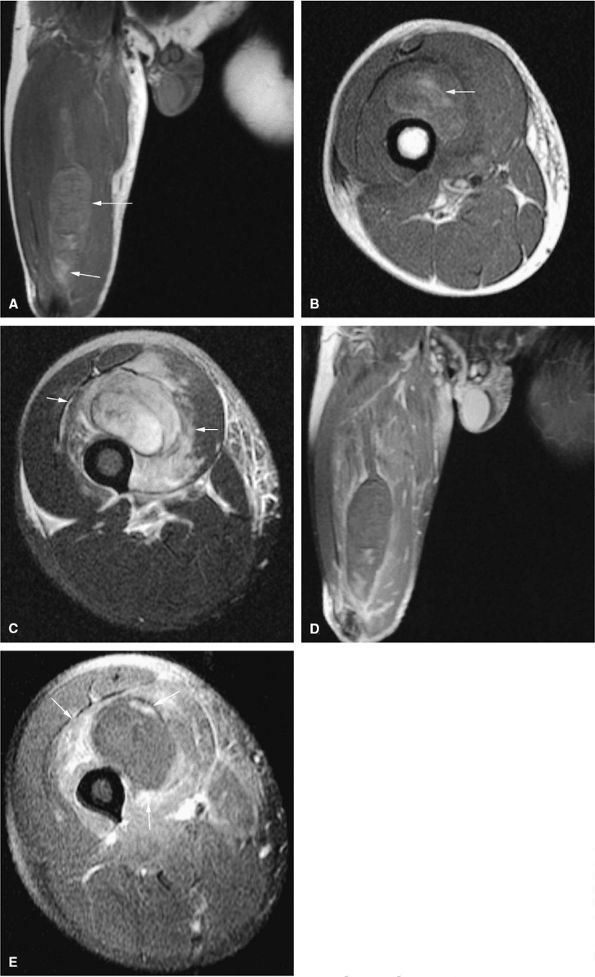 |
|
FIGURE 14-142 ● Intramuscular hematoma of the vastus intermedius occurring along the myotendinous junction. A soft-tissue mass with areas of high signal intensity is seen on coronal (A) and axial (B) T1-weighted images (arrows). (C) Marked surrounding edema is noted on this axial fat-suppressed T2-weighted fast spin-echo image (arrows). Following the administration of intravenous gadolinium, there is only mild surrounding enhancement on the coronal (D) and axial (E) fat-suppressed T1-weighted images (arrows).
|
 |
|
FIGURE 14-143 ● A synovial wrist ganglion (arrows) is seen on both axial T1-weighted (A) and fat-suppressed T2-weighted (B) fast spin-echo images. Mucinous synovial contents demonstrate intermediate signal intensity on the T1-weighted images and high signal intensity on the fat-suppressed T2-weighted images.
|