Marrow Imaging


13 – Marrow Imaging

Chapter 13
Marrow Imaging
Miriam A. Bredella
David W. Stoller
There is a range of advantages and disadvantages to the variety of imaging techniques used in bone marrow assessment:
  • Conventional radiographic techniques are insensitive to many marrow infiltrations and tumors and are limited in providing accurate bone marrow characterization. As a result, there is frequently significant trabecular or cancellous destruction before disease progression is detected on standard radiographs.
  • Computed tomography (CT), although accurate for detecting gross metastatic disease of the spine, has limited sensitivity in imaging primary and metastatic marrow neoplasms. Changes in the CT attenuation value of medullary bone can be nonspecific and do not occur until pathology is well established.
  • Radionuclide bone scanning, the standard method for screening the skeleton for metastatic disease, is relatively insensitive to certain marrow neoplasms, such as leukemia, lymphoma, and myeloma. In addition, very aggressive metastatic tumors may yield false-negative findings on radionuclide scans.
  • Positron emission tomography (PET) using 2-F18-fluoro-2-deoxy-D-glucose (FDG) has a high sensitivity for the identification of early bone marrow infiltration by malignant neoplasms.1,2
  • Magnetic resonance (MR) imaging has the major benefit of imaging bone marrow directly. Multiplanar MR imaging provides the excellent spatial and contrast resolution necessary to differentiate the signal intensities of fatty (yellow) marrow elements from hematopoietic (red) marrow elements. MR imaging has thus become the diagnostic gold standard for diseases that involve or target the bone marrow.

P.1978


Normal Bone Marrow
The normal distribution and MR appearance of bone marrow changes with age.3,4,5,6 An understanding of these variations is important in examining MR patterns in appendicular skeletal locations and determining whether they are potential disease processes or normal variations of marrow. The general status of marrow in adults is best assessed on MR images in the coronal plane of the pelvis and sagittal plane of the spine, unless symptoms indicate disease elsewhere.
Structure, Function, and Development
The bone marrow is the site of production of circulating blood elements (i.e., granulocytes, erythrocytes, monocytes, platelets, and uncommitted lymphocytes). Sustained cellular production is dependent on stem cells, which exhibit properties of both continuous self-replication and differentiation into specific cell lines. The tremendous flexibility of stem cells in the production of blood cellular elements is related to their proliferative activity, which is dependent on the microenvironment (i.e., cell-to-cell interaction) and on humoral feedback.7,8 The earliest stem cells give rise to more restricted stem cells, which exhibit less multipotentiality and decreased ability for self-replication. With further differentiation, committed progenitors are formed and mature along a single hematopoietic pathway. In the presence of colony-stimulating factors, these progenitor cells can be grown in vitro to form cell colonies known as colony-forming units.9
The marrow cavity is divided into compartments by plates of bony trabeculae. There are two types of marrow, red and yellow.
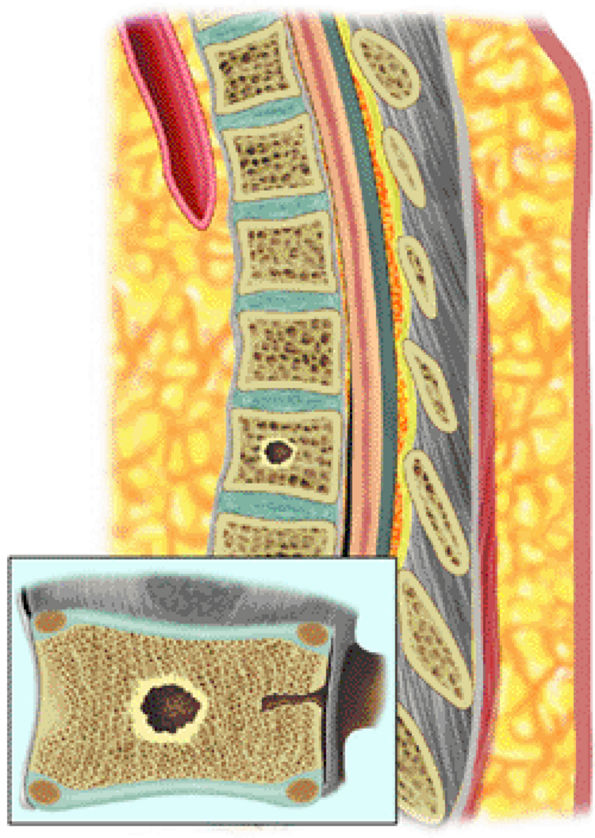
  • Red (hematopoietic) marrow is hematopoietically active bone marrow located within the spaces defined by the trabeculae. It is semifluid in consistency and is composed of the various hematopoietic stem cells and their progeny in assorted stages of granulocytic, erythrocytic, and megakaryocytic development. Uncommitted lymphocytes, as well as lymphoid nodules, are also present in the red marrow. The hematopoietic cellular elements are supported by reticulum cells and fat cells. Red marrow contains approximately 40% water, 40% fat, and 20% protein.6 The vascular system consists of centrally located nutrient arteries that send out branches that terminate in capillary beds within the bone. Postcapillary venules re-enter the marrow cavity and coalesce to form venous sinuses. Hematopoietic cell production follows the vascular arrangement, forming active hematopoietic islands between the sinusoids. Bone marrow lacks lymphatic channels.10,11
  • Hematopoietically inactive marrow, or marrow not involved in blood cell production, is referred to as yellow marrow. Because yellow marrow is predominantly composed of fat, it is sometimes called fatty marrow. It contains approximately 15% water, 80% fat, and 5% protein.
Red to Yellow Marrow Conversion
Hematopoiesis begins in utero, at approximately 19 gestational days, within the yolk sac. By week 16 of gestation, the main sites of fetal hematopoiesis are the liver and spleen. After week 24 of gestation, marrow becomes the main organ of hematopoiesis. At birth, active hematopoiesis (i.e., red marrow) is present throughout the entire skeleton, including the epiphyses (Fig. 13.1). Normal physiologic conversion of red to yellow marrow occurs during growth in a predictable and orderly fashion12 and is complete by 25 years of age, when the adult pattern is established (Fig. 13.2). Although distribution of red marrow varies from person to person, it is usually symmetric in the same person.
The cellularity of red marrow varies with age and site. In the newborn, red marrow cellularity approaches 100%. In the adult, fat cells generally occupy approximately 50% of active red marrow. However, the cellularity of marrow also varies with site. For example, at 50 years of age, the average cellularity is 75% in the vertebrae, 60% in the sternum, and 50% in the iliac crests.11,12 In the adult, red marrow is primarily concentrated

P.1979


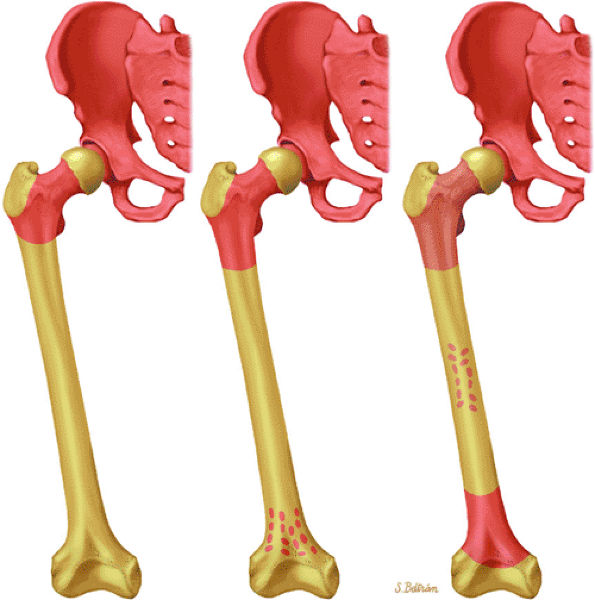
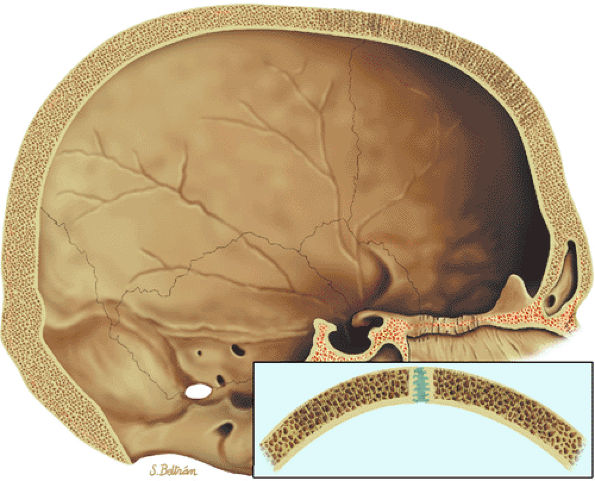
in the appendicular and axial (i.e., spinal) skeletons. The prevalence of fatty marrow within the spine increases with advancing age. In osteoporosis, fat replacement is associated with loss of cancellous (i.e., trabecular) bone. Early in the normal ossification process, yellow marrow replaces the hyaline cartilage template in the epiphysis and apophysis.

FIGURE 13.1 ● Normal red marrow in an infant. Coronal T1-weighted image demonstrates normal red marrow involving the entire skeleton, including the epiphyses (arrows).
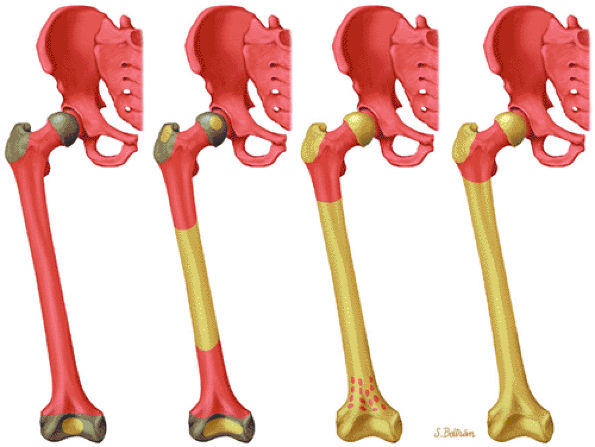
FIGURE 13.2 ● Bone marrow conversion from birth to adulthood. Graphic illustration demonstrating marrow distribution as a function of age with conversion of red marrow to yellow marrow.
Reconversion of Yellow to Red Marrow
Reconversion of yellow to red marrow occurs in the reverse order from that seen in the normal, physiologically maturing skeleton. In other words, it starts in the axial skeleton and proceeds in a proximal-to-distal direction in the appendicular skeleton. For example, hematopoiesis occurs in the proximal metaphysis in the premature skeleton; therefore, reconversion of long bones occurs first in the proximal metaphysis and then in the distal metaphysis. The process of reconversion of yellow to red is triggered by the body—s demand for increased blood cell production, which may be caused by stress, anemia, or marrow replacement. The extent of reconversion depends on the duration and severity of the initiating cause. Relatively extensive reconversion is seen in long-standing chronic anemias such as sickle cell anemia or thalassemia major (Fig. 13.3).13 This process favors sites of residual red marrow stores.
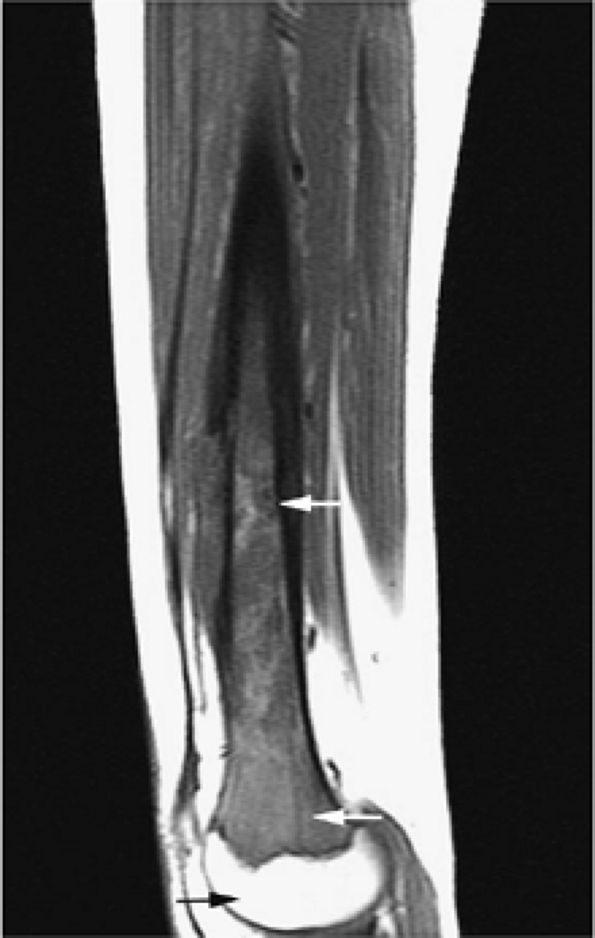
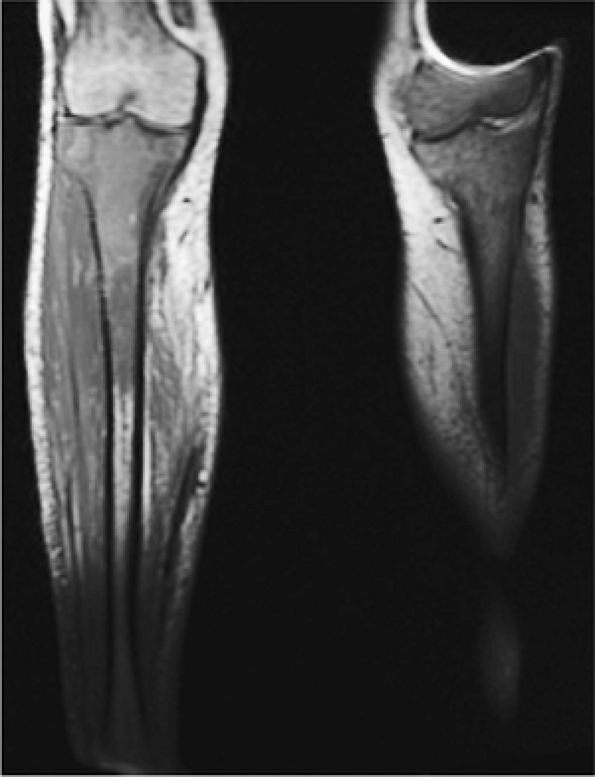
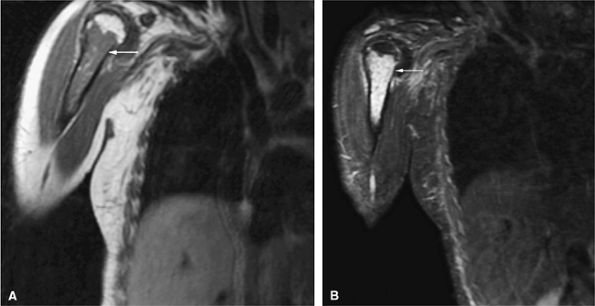
FIGURE 13.3 ● Reconversion of yellow marrow to red marrow in a patient receiving chemotherapy for Ewing sarcoma. This sagittal T1-weighted image demonstrates red marrow involving the metaphysis and diaphysis (white arrows), whereas yellow marrow remains present in the epiphysis (black arrow).

P.1980


MR Appearance of Normal Marrow
In yellow marrow, hydrogen protons exist in hydrophobic side groups with short T1 relaxation times.14,15 The bright signal intensity of yellow marrow reflects the shortened T1 relaxation time of fat. The differences in signal intensities of yellow and red marrow result primarily from differences in their proportional amounts of water and fat; the proportions are approximately equal in red marrow, but there is significantly more fat (80%) in yellow marrow.6 The role of protein, which constitutes 20% of red marrow and 5% of yellow marrow, in modifying signal intensity is less clear, because protein may exist either in a bound state, with a long T1 relaxation time, or in solution, with a short T1 relaxation time.14,16
The normal MR appearance of red and yellow marrow includes the following features:
  • On T1-weighted and conventional T2-weighted images, yellow marrow demonstrates the bright signal intensity of fat.
  • Yellow marrow is low signal intensity on short inversion time recovery (STIR) images, in which signal from fat is nulled (Fig. 13.4). The signal intensity of fat marrow is also reduced on fat-suppressed T2-weighted spin-echo or fat-suppressed T2-weighted fast spin-echo sequences,17 and it appears darker when using fat-suppression techniques with sequences having longer repetition times (TR) and echo times (TE).
  • Red marrow demonstrates low signal intensity on T1-weighted images, reflecting its increased water content, and intermediate signal intensity with progressive T2 weighting.
  • Normal red marrow demonstrates T1 signal that is equal to or higher than adjacent muscle or intervertebral disks.
  • Red and yellow marrow contrast differences become less distinct on heavily T2-weighted protocols with TR greater than 2,500 msec.
  • With suppression of the signal from fat on STIR images, areas of red marrow demonstrate higher signal intensity than areas of yellow marrow.
As discussed earlier, the maturing skeleton undergoes a process of red to yellow marrow conversion beginning in the hands and feet and progressing to the peripheral and then central skeleton.4,6 In the long bones of the appendicular skeleton, red marrow conversion occurs first in the diaphysis and progresses to the distal and then proximal metaphysis18 (Fig. 13.5). In the femoral diaphysis, high-signal-intensity fatty marrow is observed as early as 3 months of age, with marrow heterogeneity at 12 months, and homogeneous high signal intensity after 5 years of age.19 In the adult, the proximal two thirds of the femur and humerus contain a higher concentration of red marrow stores (Fig. 13.6), accounting for the appearance on T1-weighted images of low-signal-intensity inhomogeneity against a background matrix of fatty marrow of bright signal intensity.20 Uniform fatty marrow within the long bones of the humerus or femur, without any red marrow inhomogeneity, is within the spectrum of normal findings. Marrow heterogeneity in the pelvis tends to be most prominent in the acetabulum from birth to 24 years of age. In other locations, marrow signal intensity increases with age.21 In the sacrum, the lateral masses have a higher fat content and a more heterogeneous signal intensity than the vertebral bodies.22 In

P.1981


P.1982


addition, the sacral lateral masses demonstrate brighter signal intensity in male than in female subjects.

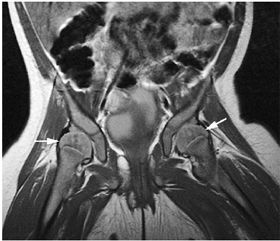
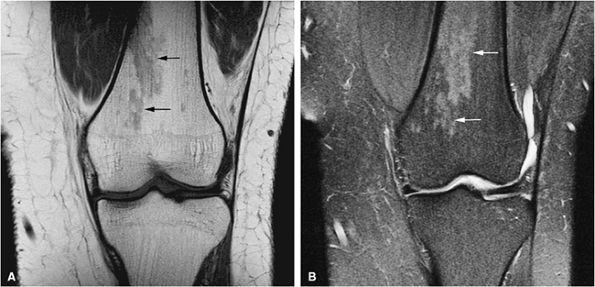
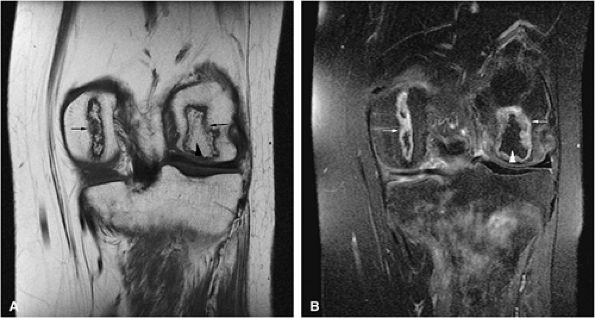
FIGURE 13.4 ● (A) Coronal T1-weighted image shows normal yellow marrow of the proximal femurs (black arrows). Residual red marrow in the femoral metaphyses is of intermediate signal (white arrows). (B) Yellow marrow is dark on the corresponding coronal STIR image (arrows). Areas of red marrow demonstrate higher signal intensity than areas of yellow marrow (arrowheads).
FIGURE 13.5 ● (A) Residual metaphyseal red marrow is seen as patchy regions of low signal intensity (black arrows) on a T1-weighted coronal image. (B) The red marrow is hyperintense on the corresponding fat-suppressed T2-weighted fast spin-echo image (white arrows).
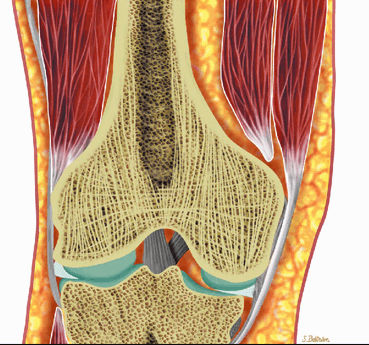
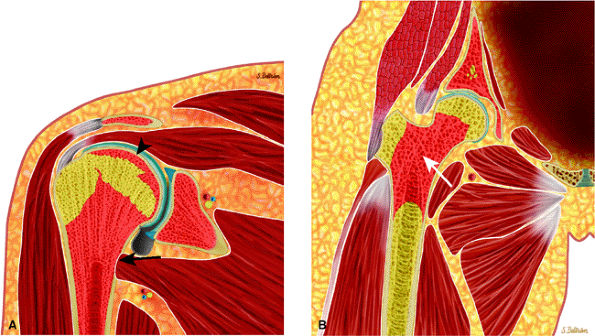
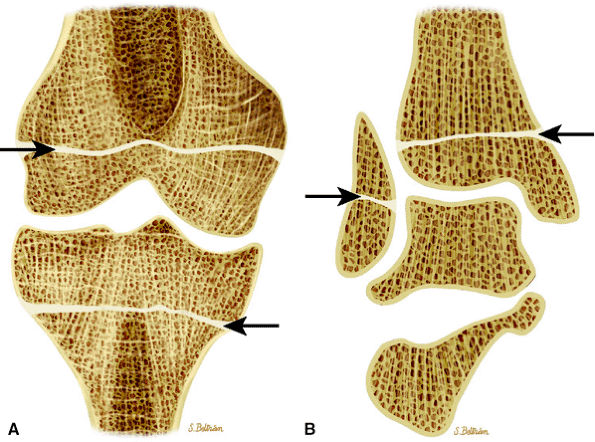
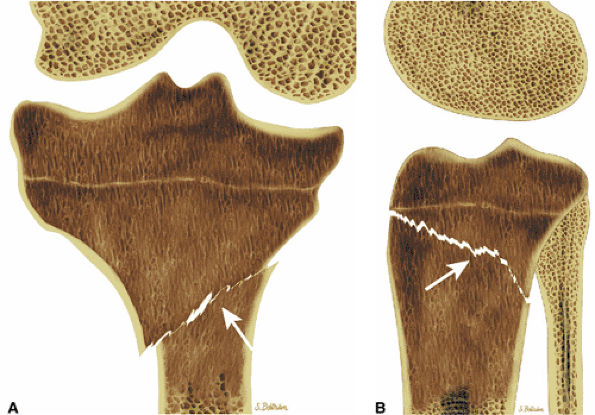
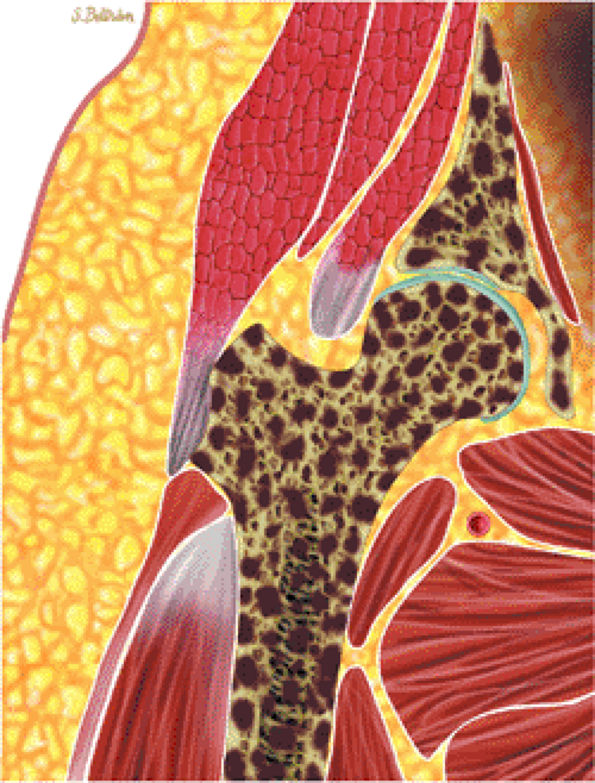
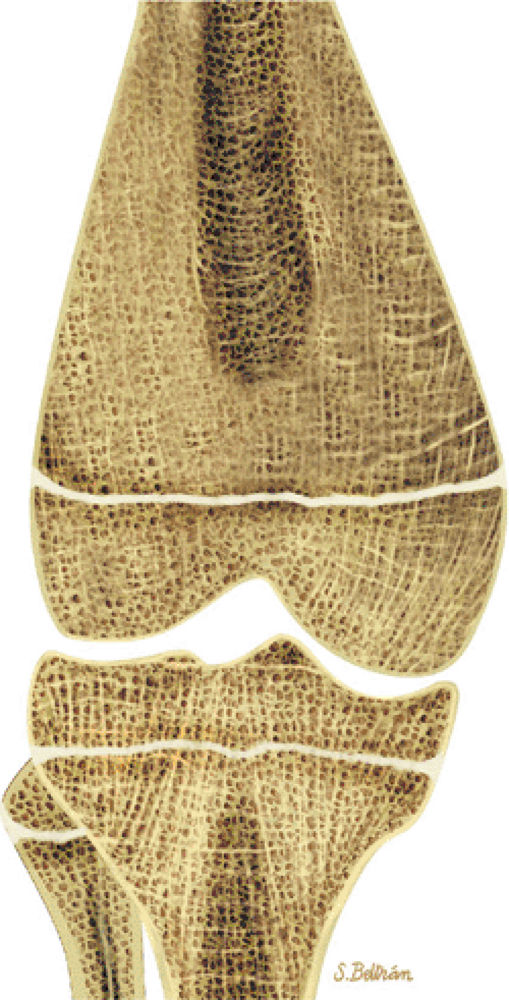
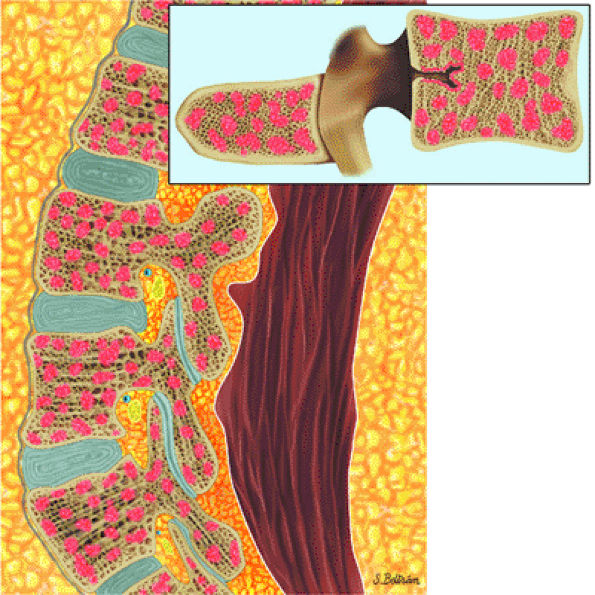
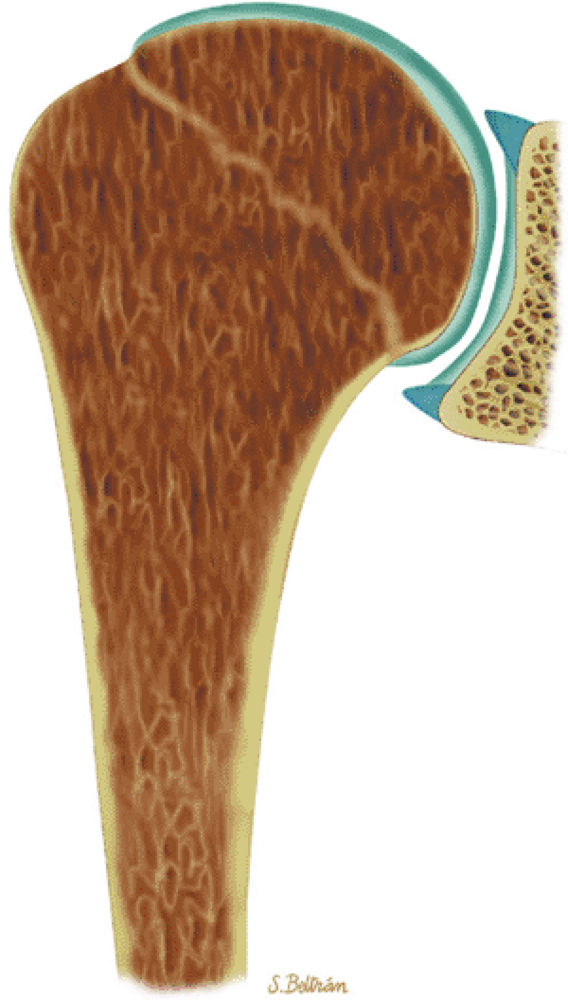
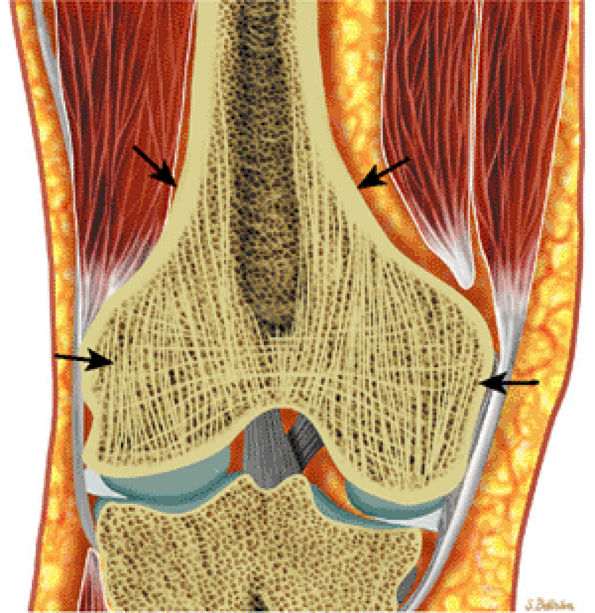
FIGURE 13.6 ● Normal red marrow. Coronal graphic illustrations of the shoulder (A) and hip (B) demonstrate the normal appearance of residual red marrow in the humeral (black arrow) and femoral (white arrow) metaphyses. Note the curvilinear distribution of red marrow involving the medial humeral head (black arrowhead), a normal finding.
Mirowitz23 described extension of hematopoietic marrow (residual or reconverted) within the humeral epiphysis. This site, proximal to the humeral metaphysis, does not usually contain hematopoietic marrow,23 although its presence has also been noted in the proximal femoral epiphysis.24 Although hematopoietic bone marrow is not usually visualized within the epiphysis of long bones in adults, these findings are considered normal. Females are more likely to demonstrate epiphyseal hematopoietic marrow, a finding that correlates with a more prominent pattern of hematopoietic marrow within the proximal humeral metaphysis. A curvilinear distribution of marrow usually involves the medial humeral head (see Fig. 13.6A), and central epiphyseal hematopoietic marrow, in a patchy or globular pattern, is less common. Small differences in the amount and distribution of red marrow from side to side are normal, but marked asymmetry is suspicious for a marrow-infiltrating disease process. Focal islands of yellow marrow are common in the spine around the central venous channels in the vertebral bodies (Fig. 13.7).
Marrow Imaging Techniques
Spin-Echo and Fast Spin-Echo Imaging
Since both benign and malignant disorders that target the marrow have long T1 and T2 values and high proton density, imaging protocols for marrow characterization use T1-weighted spin-echo sequences. T2-weighted spin-echo sequences have less contrast in the range of commonly used TRs (i.e., approximately 2,000 msec), and long TR and TE times (i.e., TR values of 2,000–3,000 msec and TE values greater than 80 msec) would be necessary to optimize contrast. However, since many lesions become isointense with marrow on intermediate-weighted sequences, T1-weighted images with TR values between 400 and 700 msec and short TEs (<30 msec) are required.
Lower contrast, as well as artifacts caused by moving high-signal-intensity fat, may degrade the diagnostic quality of conventional T1- and T2-weighted spin-echo images. Conventional MR imaging may also be of limited value when contrast is intrinsically low due to small differences in signal between tumors and adjacent fat, especially on long TR/TE sequences. The clinical usefulness of marrow MR imaging can be substantially expanded by combining T1-weighted spin-echo and STIR sequences. Fat-suppressed T2-weighted or fat-suppressed T2-weighted fast spin-echo techniques, however, have primarily replaced conventional non–fat-suppressed T2-weighted sequences in evaluating marrow pathology.17 Fast spin-echo imaging acquires multiple lines of K-space during a single TR. This makes it possible to keep imaging time relatively short when acquiring high-resolution T2-weighted images with ultralong TRs.25 With fast spin-echo pulse sequences, the initial 90° pulse is followed by the acquisition of 2 to 16 echoes. The echo-train length represents the number of echoes selected. Echo space is the time between each echo. Acquisition time is decreased by increasing the echo train. Because of the high fat signal intensity intrinsic to this sequence, fat suppression must be added to increase the sensitivity of this technique for routine use in bone marrow imaging. The blurring effect of fast spin-echo sequences is decreased with shorter echo-train lengths, longer TEs, and increased matrix resolution.
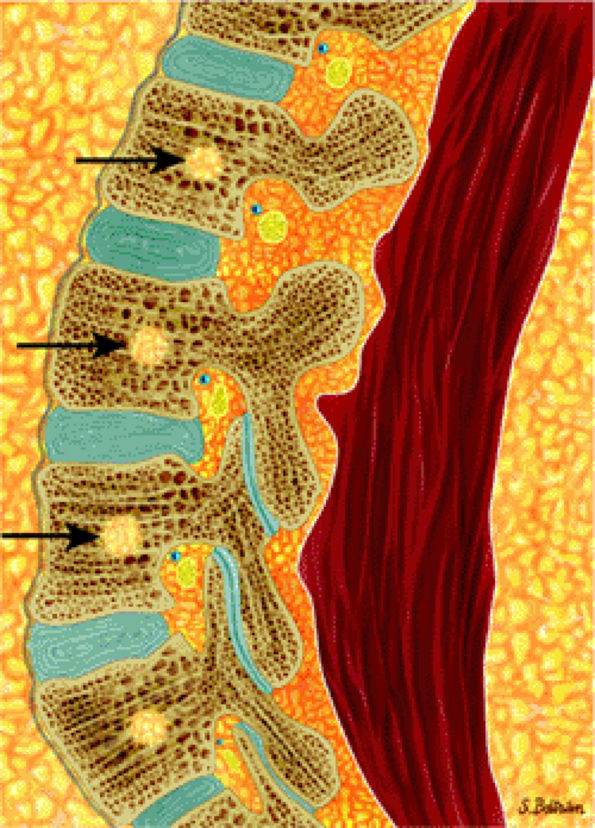
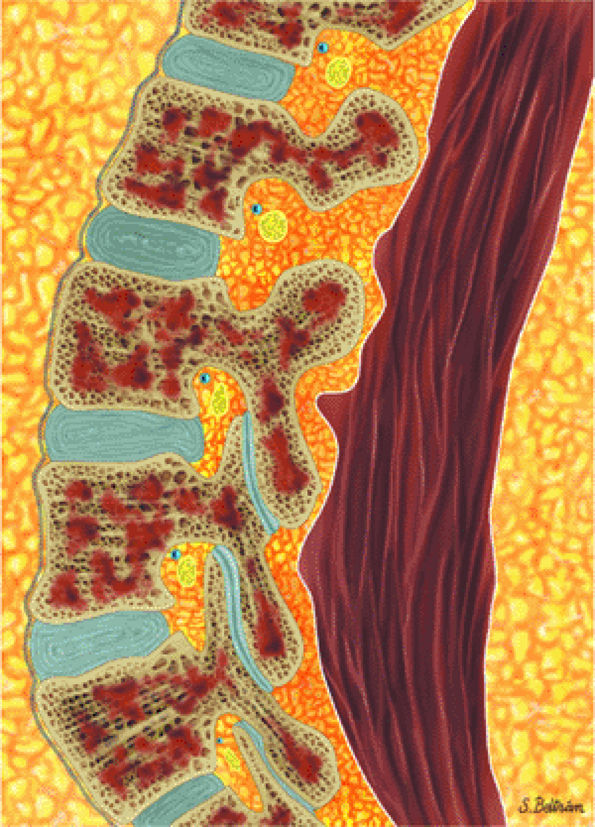
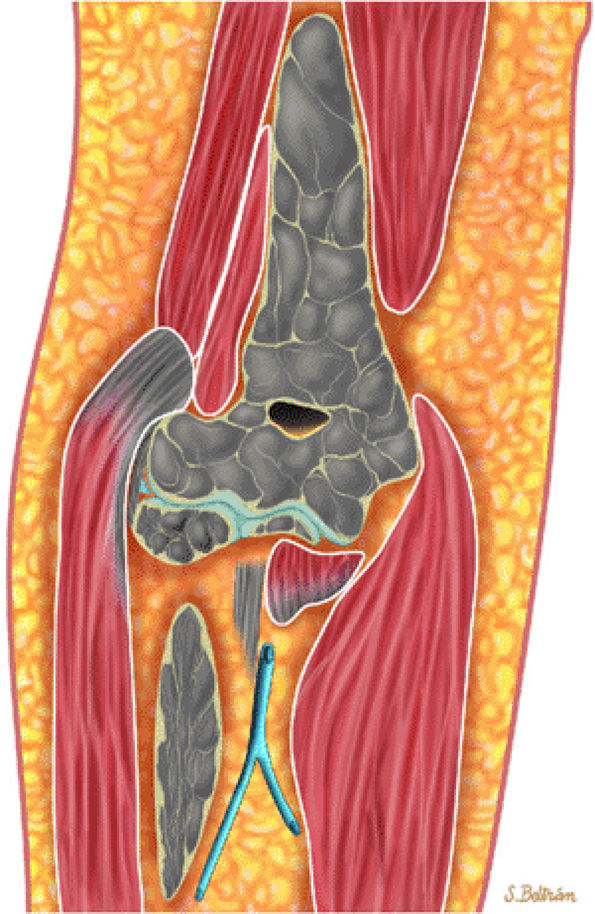
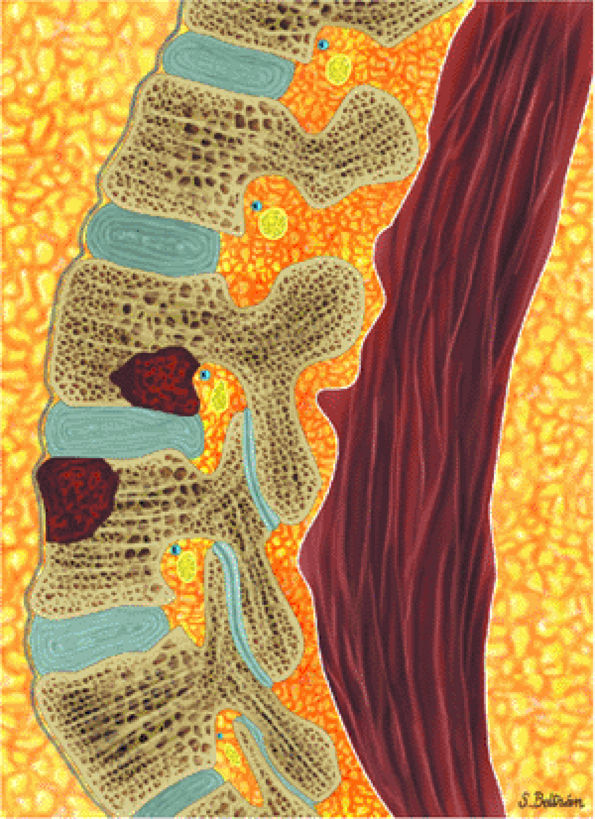
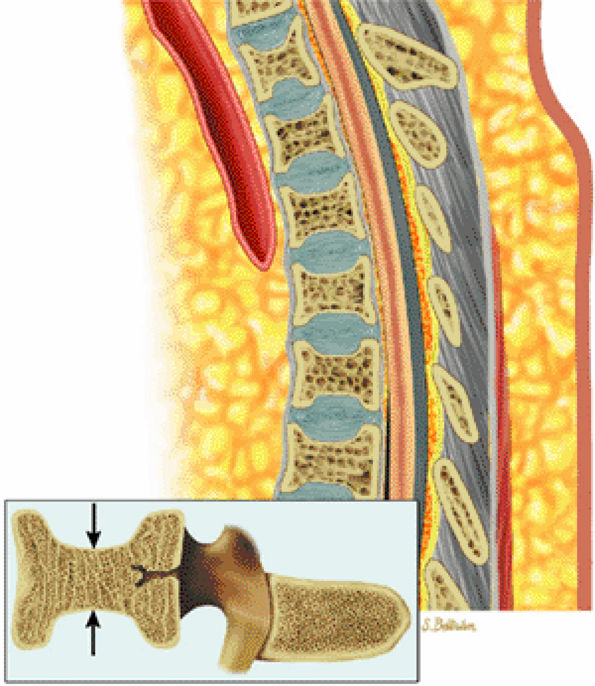
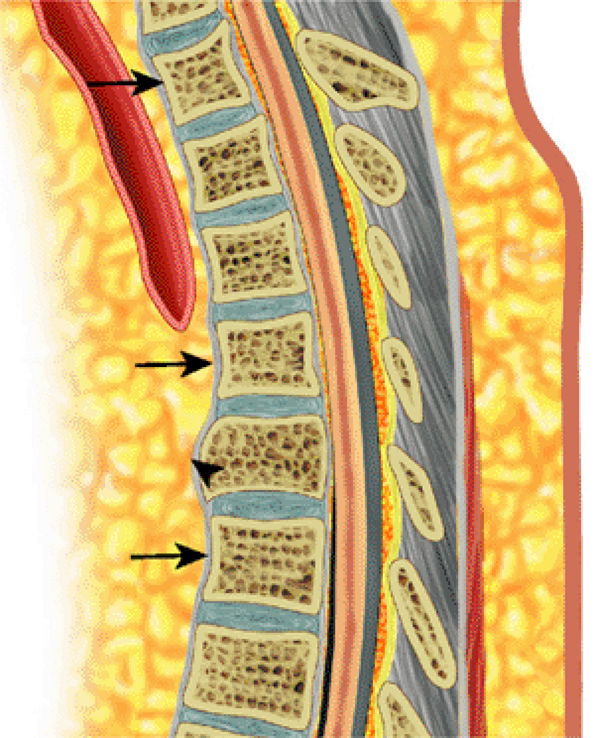
FIGURE 13.7 ● Sagittal graphic illustration of the lumbar spine shows normal marrow heterogeneity with foci of fatty marrow in the vertebral bodies (arrows).
STIR Imaging
The STIR technique is highly T1-weighted. The initial 180° RF excitation pulse is followed by a standard spin-echo pulse sequence at a given inversion time (TI). The strength of the signal that is returned from the spin-echo sequence is proportional to the absolute magnitude of the Z component of the bulk magnetization vector at the instant of the 90° pulse; therefore, a TI can be determined for which fat, which has a short T1, will not emit a signal.
This type of inversion recovery technique (with a short TI) was initially used to eliminate the subcutaneous fat signal responsible for motion and breathing artifacts. It also suppresses the signal from normal medullary fat, which allows the signal emanating from abnormal tissues to be more easily

P.1983


detected; it has therefore proven to be highly sensitive for diseases within the medullary space of bone. The following STIR characteristics give rise to the clinical advantages:

  • Additive T1 and T2 contrast
  • Marked suppression of the high signal from fat
  • Twice the magnetization range of spin-echo sequences
These characteristics produce extraordinarily high contrast that makes the lesion more conspicuous while preserving the low signal-to-noise ratio. By selecting inversion times that occur at the null point during the recovery of signal after an inverting 180° RF pulse, the signal from structures of known TI relaxation times can be selectively suppressed.
The STIR sequence described above suppresses the signal from fat, which is the predominant component of marrow in normal adults. T1 is prolonged in most pathologic conditions affecting the marrow, and the T1 of fatty marrow is short; therefore, there is excellent contrast on STIR images, a considerable advantage over routine spin-echo imaging.
The following findings are characteristic of STIR images:
  • Fat is black.
  • Combinations of red and yellow marrow are light gray (i.e., intermediate).
  • Most marrow tumors are bright white.
  • Although red marrow demonstrates increased signal intensity on STIR images, most pathologic conditions involving marrow replacement or infiltration generate greater signal intensities. Fibrous tissue, calcification, and hemosiderin deposits are low in signal intensity, whereas fluid, edema, or recent hemorrhage are bright. Muscle remains intermediate in signal intensity.
  • STIR sequences reflect the age-dependent differences in the percentage of hematopoietic marrow.
The fast spin-echo STIR technique decreases imaging time significantly and produces diagnostic accuracy comparable to that of conventional STIR sequences.25 Both fat-suppressed T2-weighted fast spin-echo and fast spin-echo STIR sequences used in conjunction with T1-weighted images represent the key imaging protocols for optimizing marrow tissue contrast.
Gradient-Echo Recall Imaging
Gradient-echo recall techniques have become increasingly popular, primarily because of their ability to increase the rate of data acquisition and decrease scan times. Parameters for gradient echo recall include the following:
  • The initial excitation pulse is an RF pulse that typically possesses a flip angle of less than 90°. If a 90° flip angle is used, the Z component of the bulk magnetization vector is zero after the excitation pulse, and a period of time on the order of T1 is needed for the Z component of the bulk magnetization vector to recover and to allow a second pulse sequence to generate significant signal. If the excitation pulse is less than 90°, however, the Z component of the bulk magnetization vector is not decreased to zero, and the subsequent excitation pulse can be separated from the first by a TR significantly less than T1. In addition, the resultant signal is maximized by using free induction decay for data acquisition instead of a standard SE, with its associated long TE and signal drop-off.
  • To balance phase shifts from the readout frequency gradient so that all phase shifts are only those specifically introduced by the phase and encoding gradients, the initial readout gradient is negative and cancels phase shifts introduced by the positive component of the frequency-encoded gradient during acquisition of the signal. A reversal occurs between the negative and positive gradient; thus, the term gradient reversal techniques is used.
  • By using partial flip angles, TR values can be markedly shortened. Because image acquisition time is directly proportional to the value of TR, marked time savings over SE techniques can be attained. However, because the contrast parameters sampled by the gradient-echo technique are predominantly T2*, the high contrast between soft tissues normally obtained by spin-echo techniques is not routinely seen on gradient-echo images. It is possible to select parameters to provide contrast somewhat similar to standard spin-echo imaging.
Gradient-echo techniques are sensitive to magnetic field inhomogeneities, chemical-shift frequencies, and magnetic susceptibility; therefore, they are prone to motion and distortion artifacts of tissue interfaces with different magnetic susceptibilities. Advantages of gradient-echo techniques include:
  • Effective T2 weighting
  • High resolution
  • Adequate signal-to-noise ratio without the need for interslice spacing
These advantages make this a useful complement to T1 spin-echo imaging. In addition, 3D Fourier transform volume acquisitions, which allow up to 120 images to a slice thickness of 0.7 mm, can be retrospectively reformatted. Susceptibility effects can be used to identify calcium or areas of hemorrhage.
The following findings are characteristic on gradient-echo recall images:
  • The low-signal-intensity contrast of gradient-echo images is not secondary to fat suppression, as with STIR images; therefore, many marrow neoplasms or infiltrative disease processes do not demonstrate increased signal intensity when compared with corresponding STIR images.
  • Red marrow stores do not demonstrate increased signal intensity on gradient-echo images and may be difficult to differentiate from fatty marrow.
  • A high proportion of trabecular bone in areas such as the epiphysis may further modify gradient-echo contrast (decreasing effective transverse relaxation times), resulting in decreased signal intensity in these areas.26
Chemical-Shift Imaging
Chemical-shift imaging is used to produce images that emphasize either the water or fat component of marrow by temporal separation of their respective returning MR signals.27 Red and yellow marrow differentiation is thus possible on T1-weighted

P.1984


images. Differences in resonant frequencies of fat and water protons (3.5 ppm or 75–150 Hz) allow for temporal dephasing after RF pulse excitation. This property is used to develop water and fat images by emphasizing in-phase or out-of-phase tissue properties, thus suppressing fat or water signal.

Magnetic Resonance Survey Evaluation
The protocol for an MR survey examination for marrow evaluation uses T1-weighted coronal images of the pelvis and proximal femurs, which are adult sites of red marrow concentration. These images are acquired with large (40 cm) fields of view to include assessment of lumbosacral spine marrow. Coronal STIR images are obtained to null fat signal and identify abnormal T1 or T2 prolongation. Fat-suppressed T2-weighted fast spin-echo sequences may be used when thin slice or multiplanar imaging is required in a limited period of time.
Components of an MR survey include:
  • Axial T1-weighted, fat-suppressed T2-weighted fast spin-echo or STIR images may be obtained at specific sites of suspected pathologic processes and are important in determining cross-sectional marrow involvement. T1-weighted images are particularly valuable in evaluating blastic processes, which are low in signal on STIR images.
  • Gadolinium-enhanced axial images may improve the visibility of lesions, especially in cases with soft-tissue or cord involvement.
  • Sagittal T1-weighted and STIR images are routinely acquired to evaluate suspected spinal malignancies.
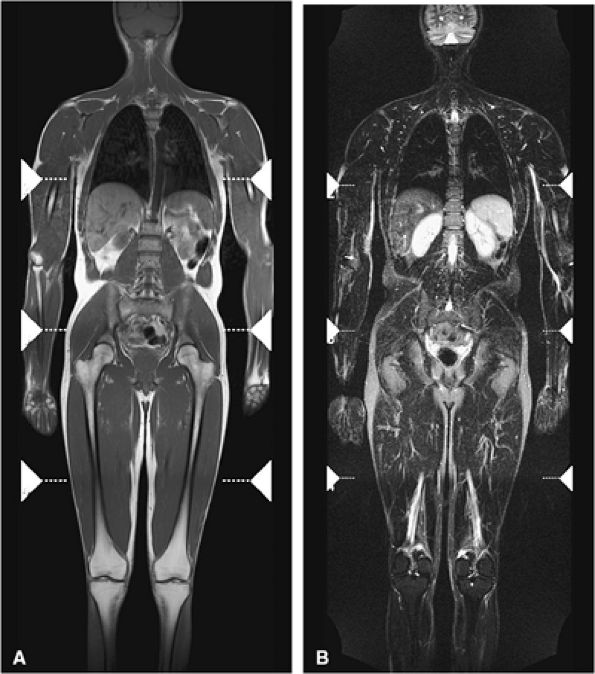
FIGURE 13.8 ● Whole-body MR imaging using coronal T1-weighted (A) and coronal STIR (B) sequences. Whole-body MRI is a sensitive and fast technique for evaluating the entire skeleton for abnormalities.
Whole-Body MR Imaging
Whole-body fast MR imaging protocols have recently been shown to be an effective and time-efficient means of evaluating the entire skeleton for metastases, multiple myeloma, and staging of head and neck cancers and lymphoma.28,29,30,31 Studies comparing whole-body STIR MR imaging with bone scintigraphy in patients with suspected metastatic disease have shown that MR imaging is more sensitive than bone scintigraphy in lesion detection.31,32 Using fast MR sequences, whole-body MR imaging has been shown to be superior to bone scan in detecting lesions in the extremities, pelvis, and spine and provides additional important information about tumor morphology, tumor extension, and neurologic complications. Whole-body MR imaging is also used to detect response to therapy.33 Recent protocols have been shown to significantly decrease acquisition times,34,35,36 and most adults may be completely imaged from head to toe using a standard body coil (Fig. 13.8). In

P.1985


comparing whole-body MR imaging using a rolling table platform with bone scintigraphy, excellent correlation between the two modalities in lesion detection has been demonstrated, and the examination time was 40 minutes or less.35

Whole-body MR imaging can also be used to evaluate patients who present with metastatic disease and an unknown primary malignancy. Studies have shown that although whole-body MR imaging did not find the primary malignancy in all cases, it was competitive with other methods for detection of an unknown primary malignancy, including clinical examination, serology, conventional chest radiographs, bone scintigraphy, and CT.32,37
Bone Marrow Pathology
Malignant Disorders
Leukemia
Acute Leukemias
Acute leukemias are the 20th most common cause of cancer deaths at all ages and as a group represent the most common malignant disease in childhood. This aggressive group of disorders arises at the primitive stem cell level and is usually classified as either lymphocytic or myelogenous in type, based on the cytologic features of the blast cell. Further classification of the leukemic blasts, based on immunologic markers, cytogenetics, and electron microscopy, provides useful prognostic and therapeutic information. Eighty percent of patients with acute lymphocytic (lymphoblastic) leukemia are children, and 90% of patients with acute myelogenous leukemia are adults.38,39
The majority of acute leukemias arise de novo, although they may represent the final stage of a progression from a preleukemic state (i.e., myelodysplasia) or the end stage of a chronic myeloproliferative disorder such as chronic myelogenous leukemia. The distinguishing feature of the acute phase is the uncontrolled growth of poorly differentiated blast cells. These cells rapidly accumulate in the marrow, suppressing the normal marrow elements and resulting in the commonly observed clinical symptoms of fatigue, weakness, infections, and hemorrhage.
Marrow involvement in acute leukemia is typically diffuse (Fig. 13.9) and is characterized by monotonous infiltration of immature cells in a hypercellular marrow. In occasional cases of myeloblastic leukemia, particularly in very old patients, the marrow is normocellular or even hypocellular.12 Leukemic expansion in the marrow may elicit symptoms of skeletal tenderness or swelling of the larger joints.6 Transverse radiolucent bands involving the metaphyses can be seen in 40% to 53% of patients with acute lymphocytic leukemia. These “leukemic lines” represent leukemic infiltrates (Fig. 13.10).
FIGURE 13.9 ● Sagittal graphic illustration shows diffuse leukemic bone marrow infiltration of the lumbar spine (shown in brown).
Clinical Assessment
Clinical assessment of leukemia involves posterior iliac crest aspiration for bone marrow biopsy and peripheral blood smear analysis. Peripheral disturbances in hematopoiesis are often nonspecific and frequently occur prior to significant increases in marrow blast cells. In relapse, acute leukemia may present with focal or irregular areas of infiltration, which may represent surviving rests of treated tumor cells. This appearance is more patchy and irregularly marginated than that usually seen with focal metastatic disease.
MR Appearance
In both children and adults, leukemic marrow involvement is homogeneous, diffuse, and symmetric (Figs. 13.11 and 13.12).

P.1986


Focal infiltration is more commonly seen in myelogenous leukemia (Fig. 13.13). The following findings are typical:

FIGURE 13.10 ● Coronal graphic illustrations of the knee (A) and ankle (B) show transverse lucent metaphyseal bands due to leukemic infiltration. “Leukemic lines” are seen in 40% to 53% of patients with acute lymphocytic leukemia.
  • On T1-weighted images, leukemic hypercellularity is seen as low-signal-intensity replacement of higher-signal-intensity marrow fat (Fig. 13.14).
  • Due to the greater proportion of hematopoietic marrow in children, there is an overlap in the appearance of normal low-signal-intensity cellular hematopoietic marrow and low- to intermediate-intensity hypercellular leukemic marrow.
  • Quantitative measurements of T1 relaxation times have shown prolongation in patients with leukemia and

    P.1987


    leukemia in relapse.40,41,42,43 These assessments, however, are not specific for the diagnosis of leukemia. Prolongation of the T1 relaxation time is also seen in metastatic rhabdomyosarcoma or neuroblastoma. Normal bone marrow has a T1 relaxation time of 350 to 650 msec. At initial diagnosis of leukemia or in leukemia in relapse, T1 relaxation times of 750 msec have been identified. Further studies are needed to confirm the clinical significance of differences in T1 values among initial diagnosis, remission, and relapse.44

  • Conventional T2-weighted images may show increases in signal intensity in acute leukemia. Unlike the situation with metastatic disease, however, T2-weighted images may not be sensitive to leukemic hypercellularity.
  • Quantitative measurement of T2 relaxation times in leukemia has not shown any significant difference from control marrow.
  • Chemical-shift imaging has also been used to identify pathologic marrow. Relative changes in the fat fraction show the greatest potential for understanding changes in bone marrow signal intensity and changes occurring with relapse.41,45 Chemical-shift imaging may be more useful in adult patients because of the greater difference in the fat and water fraction of bone marrow.
  • P.1988


  • STIR techniques offer superior contrast for demonstrating increased signal intensity in leukemic marrow, exceeding that displayed by normal hematopoietic cells. Nulling of fat signal intensity facilitates the detection of both focal and diffuse leukemic infiltrates (Fig. 13.15).
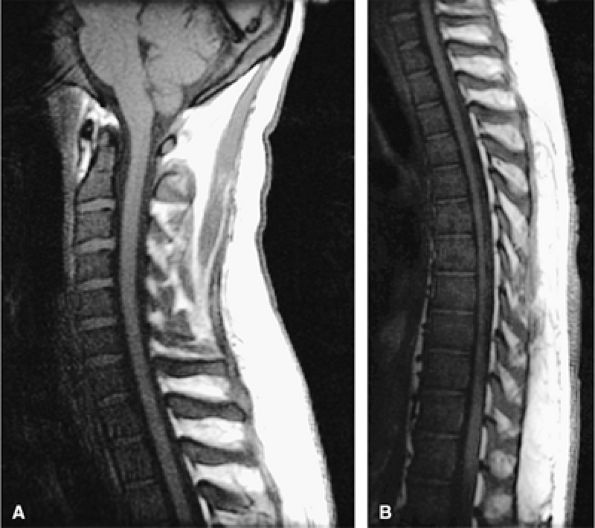
FIGURE 13.11 ● Diffuse low-signal-intensity leukemic infiltration of marrow occurs in acute lymphocytic leukemia, as seen on T1-weighted sagittal images of the cervical (A) and thoracolumbar (B) spine.
FIGURE 13.12 ● Abnormal low-signal-intensity marrow of the bilateral lower extremities due to leukemic infiltration, seen on a coronal T1-weighted image. Note extension of leukemic infiltrates into the epiphyses.
FIGURE 13.13 ● Axial graphic illustration demonstrates focal abnormal bone marrow of the femoral metaphysis with surrounding edema.
FIGURE 13.14 ● Low-signal-intensity leukemic infiltrates extending into the epiphysis are seen on this T1-weighted coronal image of the elbow. Extension of marrow inhomogeneity crossing the physis is an abnormal finding that may be seen in acute myelogenous leukemia.
FIGURE 13.15 ● In a patient with acute lymphocytic leukemia, marrow infiltration demonstrates low signal intensity on a coronal T1-weighted image of the upper arm (A). The marrow infiltration is of high signal intensity on the corresponding coronal STIR image (B) (arrows).
Post-Chemotherapy Appearance of Marrow
Patients with acute leukemia or chronic myelogenous leukemia in blast crisis are treated aggressively with myelotoxic drugs. This treatment results in cellular depletion (i.e., hypoplasia) of the marrow, accompanied by edema and fibrin deposition. Total depletion of the marrow may occur in a month or less, depending on the schedule of chemotherapy treatments and the sensitivity of the leukemic cells. As leukemic depletion progresses, fat cells (i.e., yellow marrow) regenerate. Normally, this phase of hypoplasia is followed by regeneration of hematopoietic elements (i.e., red marrow). Occasionally, however, extensive post-chemotherapy fibrosis develops. The fibrosis can be focal or widespread and may be accompanied by bone formation.46,47
Chemotherapy produces a spectrum of MR changes in normal and leukemia marrow, including metastatic disease. These changes include:
  • Marrow hypoplasia, characterized by the appearance of fatty marrow, demonstrates high signal intensity on T1-weighted images and intermediate signal intensity on T2-weighted images.
  • With chemical-shift imaging, it is possible to demonstrate sequential increases in bone marrow fat fractions in patients in clinical remission during chemotherapy treatment for acute leukemia.48
  • Marrow fibrosis demonstrates low signal intensity on T1- and T2-weighted images.
  • Reconversion of normal fatty marrow to hematopoietic marrow is seen as areas of decreased signal intensity on T1-weighted images and intermediate to mildly increased signal intensity on STIR images. When reconversion takes place adjacent to an area of signal intensity from fat in treated marrow, there is a reversal of the initial imaging signal intensity characteristics from pretreatment bone marrow to post-chemotherapy marrow (Fig. 13.16). Immediately after chemotherapy, marrow edema may falsely exaggerate the extent of disease progression. Follow-up examination can be performed to document a more accurate baseline.
In acute myeloid leukemia, MR imaging can demonstrate changes in bulk T1 during treatment that correlate with changes in bone marrow cellularity. However, these findings do not predict a favorable response to treatment.49
Chronic Leukemias
In contrast to acute leukemias, the malignant cell line in chronic leukemias has a limited capacity for differentiation and function in the initial stages of the disease process. As the disease progresses, thrombocytopenia and granulocytopenia develop, as they do in patients with acute leukemia. Compared with acute leukemias, the chronic leukemias are characterized by a long course with prolonged survival. As mentioned, chemotherapy, which is used aggressively in acute myelogenous leukemia and produces significant bone marrow hypoplasia or aplasia, has a secondary role in the management of chronic leukemias, which tend to have a more indolent course.
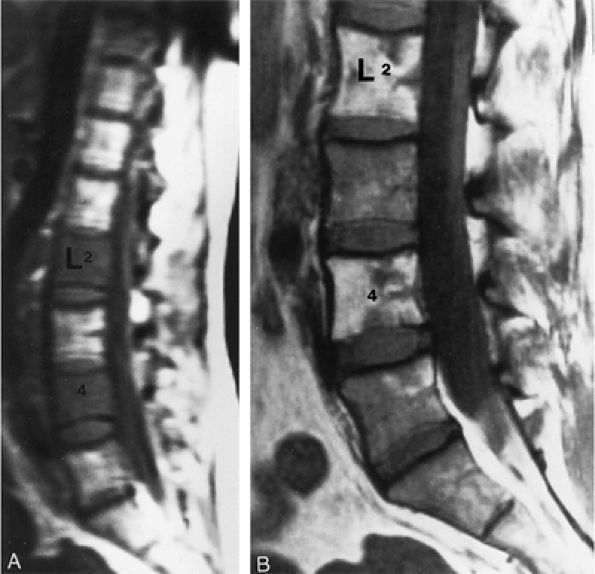
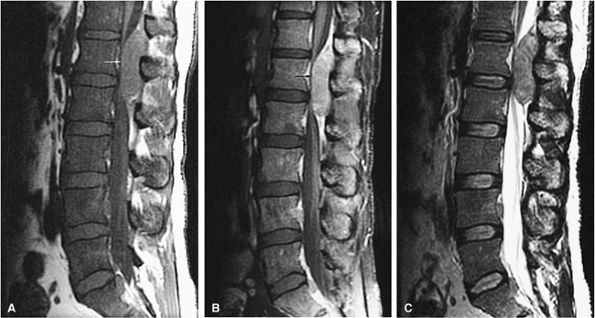
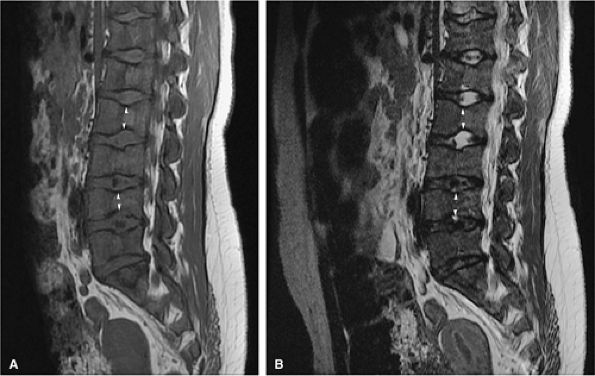
FIGURE 13.16 ● Marrow response to chemotherapy. T1-weighted images of the lumbar spine before chemotherapy (A) and after chemotherapy (B) for metastatic colon carcinoma. Metastatic disease demonstrates low signal intensity at L2 and L4 prior to chemotherapy. High-signal-intensity fatty replacement can be seen after chemotherapy. Adjacent uninvolved vertebral bodies also show a flip-flop in signal intensity as the red marrow is activated.

P.1989


Chronic Lymphocytic Leukemia
Chronic lymphocytic leukemia represents the most common form of leukemia in the United States; it is twice as common as chronic myelogenous leukemia. Ninety percent of patients with chronic lymphocytic leukemia are more than 50 years of age, and the disease shows a male predilection.50 Lymph node involvement is present in the majority of patients. Chronic lymphocytic leukemia is characterized by abnormal clones of immunologically incompetent lymphocytes. Patients may be asymptomatic or the disease may be stable at the time of diagnosis; in this case, treatment with alkylating agents is withheld. Although bone marrow analysis is not required to establish the diagnosis, examination reveals a hypercellular marrow with morphologically mature lymphocytes.
Myeloproliferative Disorders
The myeloproliferative disorders, a form of chronic leukemia, are a group of syndromes characterized by abnormal proliferation of bone marrow cell lines, which all arise from a common pluripotential stem cell. These stem cells produce the progenitor erythroid, granulocytic, monocytic, and megakaryocytic cell lines. The myeloproliferative syndromes include polycythemia vera, primary myelofibrosis with myeloid metaplasia, essential thrombocythemia, and chronic myelogenous leukemia. All of these disorders result in new clones that have a proliferative advantage over the normal marrow cells, which they gradually replace, and all have genetic instability, which predisposes to the development of an acute leukemia. The probability of progression to acute leukemia is greatest in chronic myelogenous leukemia, leading to chronic myelogenous leukemia in blast crisis.51
The diagnostic features of chronic myelogenous leukemia are the Philadelphia chromosome marker (a translocation between chromosomes 9 and 22) and decreased leukocyte alkaline phosphatase activity in circulating granulocytes. Chronic myelogenous leukemia in blast crisis represents 20% of acute leukemias and usually occurs in the fourth decade of life. Histopathologically, the bone marrow shows granulocytic hyperplasia with marked hypercellularity, an increased myeloid to erythroid cell ratio, and variable fibrosis (Fig. 13.17).50,52 Splenomegaly, which is sometimes massive, is found in nearly all cases. Chemotherapy does not increase survival time in chronic myelogenous leukemia, and induction of remission is not possible without bone marrow transplantation.
Splenomegaly, a leukoerythroblastic peripheral smear, and fibrotic marrow with occasional osteosclerosis characterize agnogenic myeloid metaplasia with primary myelofibrosis.53 The marrow fibrosis commonly results in a dry aspirate. Bone marrow biopsy demonstrates hypercellularity with an increased number of megakaryocytes, increased fibrosis, and decreased fat content. The cause of the myelofibrosis appears to be related to growth factor and factor IV produced by abnormal megakaryocytes.54 Vascular clumps of hematopoietic cells are found in distended marrow sinusoids. Increased hemosiderin may be present, secondary to repeated blood transfusions used to correct associated anemia or loss of iron uptake due to lack of effective erythropoiesis.
Secondary causes of myelofibrosis are numerous and include metastatic carcinoma, leukemia, lymphomas, tuberculosis, Gaucher disease, Paget—s disease, irradiation, and toxin exposure.51
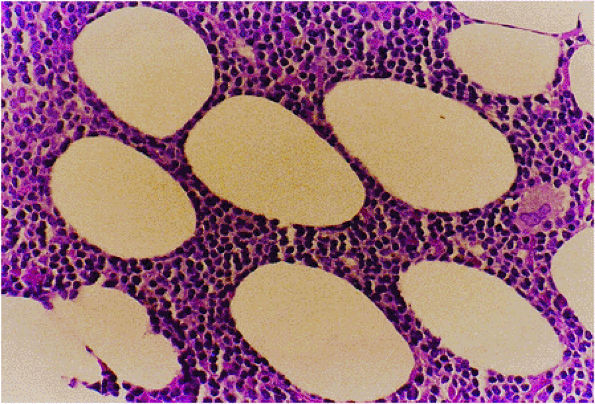
FIGURE 13.17 ● Chronic myelogenous leukemia. Hypercellular marrow consisting largely of myeloid precursors (H & E; original magnification × 100).
FIGURE 13.18 ● In chronic myelogenous leu-kemia, diffuse marrow involvement infiltrates regions of previous red marrow stores in the femurs (curved arrows) and acetabulum (straight black arrows) and demonstrates low signal intensity on a T1-weighted image (A) and high signal intensity on a corresponding STIR image (B). The sites where yellow marrow is spared (the greater trochanter and femoral epiphysis) demonstrate high signal intensity on the T1-weighted image and low signal intensity (from the nulled fat signal) on the STIR sequence (white arrows).
FIGURE 13.19 ● Diffuse marrow infiltration of the ankle in a patient with chronic myelogenous leukemia. Sagittal T1-weighted image (A) shows diffuse low-signal leukemic infiltration, which is bright on the corresponding sagittal STIR image (B).

P.1990


P.1991


MR Appearance
Most chronic leukemias tend not to involve yellow marrow areas and in adults are characterized by a moderate to marked decrease in red marrow signal on T1-weighted images. Since red to yellow marrow conversion is complete in adults, leukemic involvement is more likely to be identified in the axial skeleton, pelvis, and proximal femurs (Fig. 13.18). In children, leukemic involvement is more likely to be identified in the more peripheral sites of red marrow stores, such as the metaphysis, with diaphyseal or epiphyseal extension. Marrow cellularity can also be noninvasively assessed with MR imaging.
The following MR findings are characteristic:
  • In the acute phase of chronic leukemia, particularly in chronic myelogenous leukemia patients in blast crisis, there is almost complete replacement of both red and yellow marrow areas. The decreased signal on T1-weighted sequences represents replacement of marrow fat by tumor cells, which have a significantly longer T1 relaxation time. On STIR images, tumor cells appear as areas of white on a black or gray background (Fig. 13.19).
  • P.1992


    P.1993


  • Severe anemias or other marrow-invasive processes may have a similar MR appearance. Multiple myeloma is more variable but is generally less symmetrical, more patchy, and irregular in distribution.55,56
  • In primary myelofibrosis, T1-weighted images show patchy marrow involvement with low signal intensity on T1- and T2-weighted images (Fig. 13.20). With STIR techniques, the imaging characteristics of areas of involvement are identical to those of normal hematopoietic marrow (i.e., intermediate to mild increased signal intensity).57,58,59
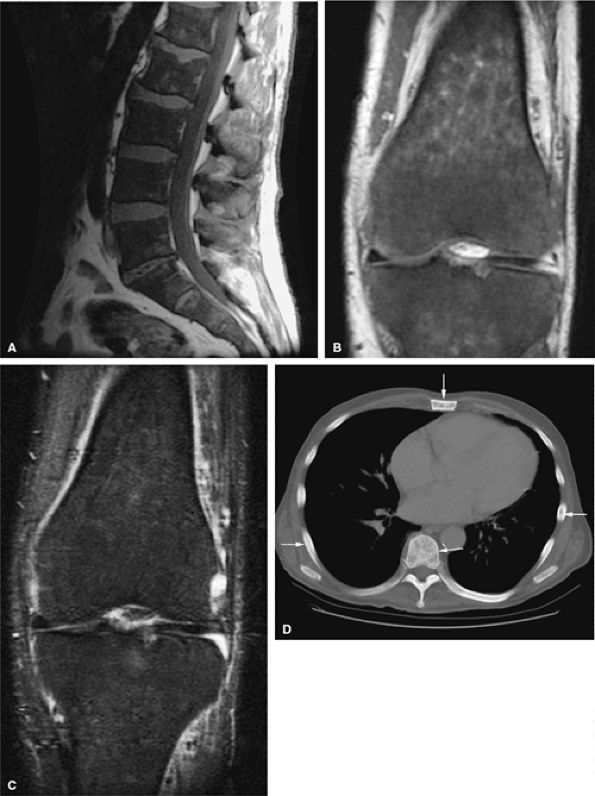
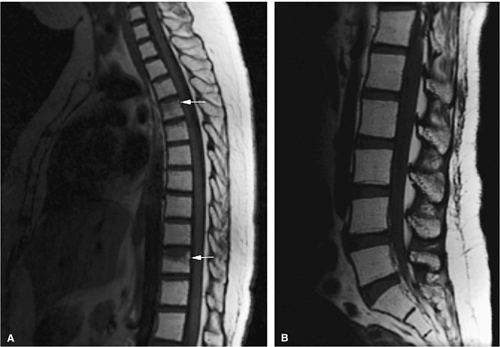
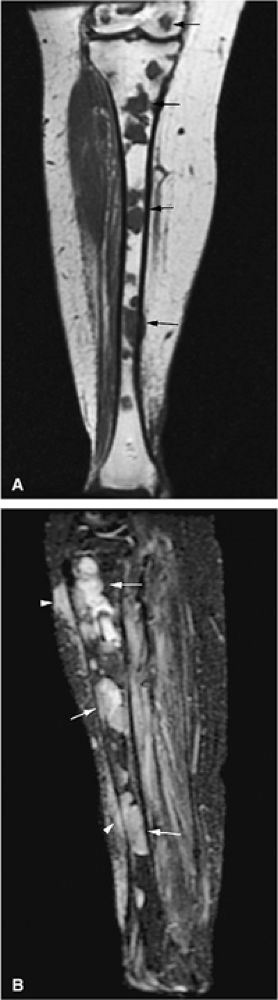
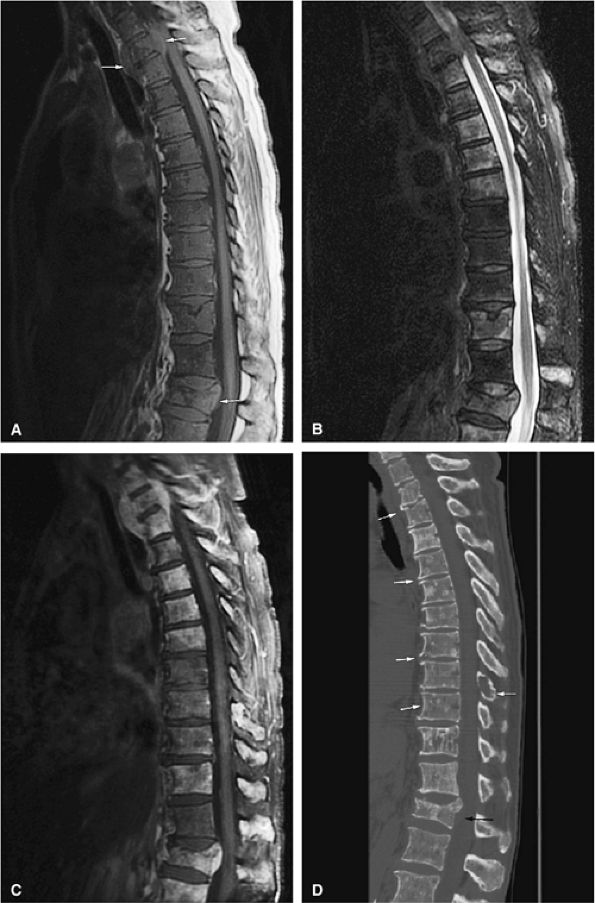
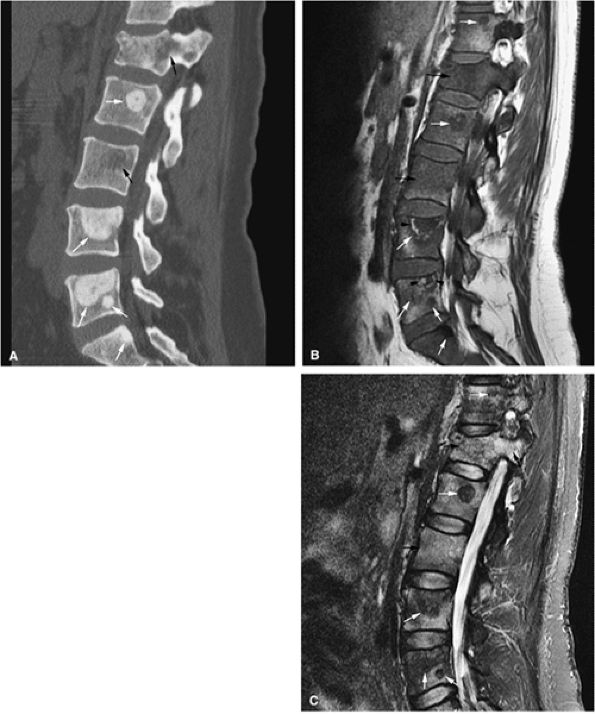
FIGURE 13.20 ● Extensive myelofibrosis following chemotherapy for leukemia. (A) The bone marrow exhibits diffuse marrow fibrosis, which is of low signal intensity on a sagittal T1-weighted image of the lumbar spine. Low-signal-intensity myelofibrotic marrow is seen on these coronal T1-weighted (B) and fat-suppressed T2-weighted (C) images of the knee. (D) Abnormal sclerosis of the spine, sternum, and ribs is seen on the axial CT image (arrows).
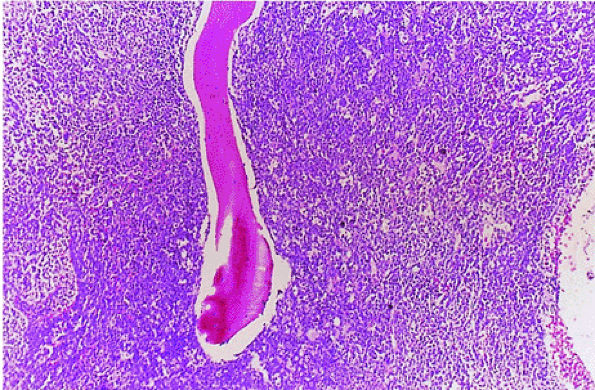
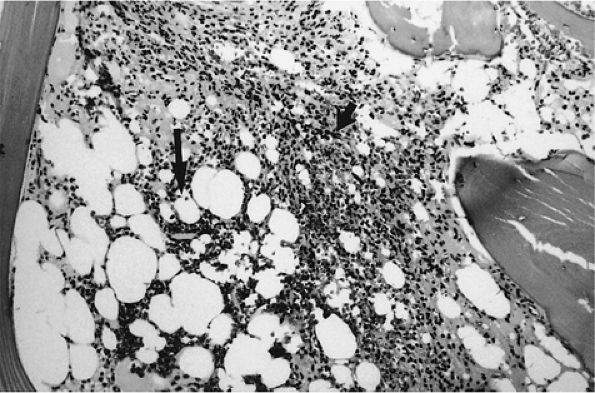
FIGURE 13.21 ● Bone marrow cellularity is low (i.e., 40:60 cell-to-fat ratio) in hairy cell leukemia. Mononuclear cells (short arrow) enveloped in reticulin form solid areas and infiltrate between the remaining fat cells (large arrow) (H & E; original magnification × 100).
Hairy Cell Leukemia
Hairy cell leukemia, representing 2% of all leukemias, is a form of chronic leukemia that evolves from B lymphocytes.50 It typically occurs in men and classically presents as pancytopenia with splenomegaly. The distribution of marrow involvement is irregular and patchy, with a propensity for focal marrow involvement. Focal or extensive involvement with reticulin limits productive marrow aspirations. Bone core biopsy, the definitive diagnostic procedure, reveals mononuclear cells in clusters or sheets within a fine reticulin mesh in a patchy or diffuse pattern. The marrow may be hypercellular or hypocellular (Fig. 13.21).60
Hairy cells are reactive to tartrate-resistant acid phosphatase, which distinguishes hairy cell leukemia from other lymphoproliferative malignancies.61 MR imaging demonstrates both a patchy lymphoma-like marrow pattern and a second pattern with a diffuse marrow infiltrate that resembles the distribution of chronic myelogenous leukemia (Fig. 13.22).62
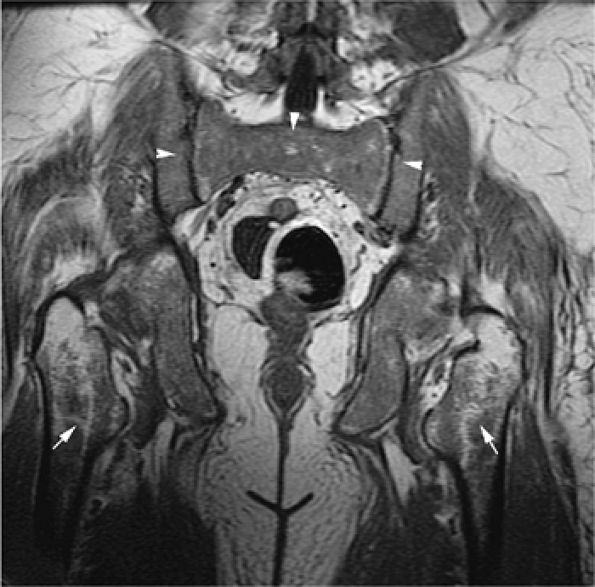
FIGURE 13.22 ● The patchy (arrows) and diffuse (arrowheads) pattern of leukemic marrow infiltration in hairy cell leukemia demonstrates low signal intensity on a coronal T1-weighted image of the pelvis.
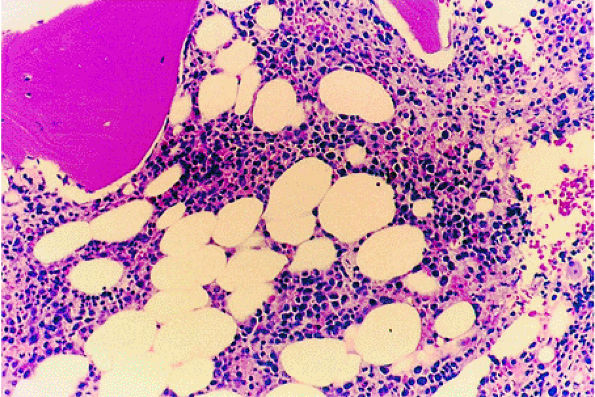
FIGURE 13.23 ● Idiopathic neutropenia after colony-stimulating factor therapy. Immature myeloid precursors can be seen in the interstitial space (H & E; original magnification × 400).

P.1994


Hematopoietic Growth Factors
Recent advances in biomolecular research have contributed to the isolation and molecular cloning of the colony-stimulating factors, which are capable of stimulating bone marrow hematopoietic progenitor cells. Recombinant granulocyte macrophage–colony-stimulating factor (GM-CSF) and granulocyte–colony-stimulating factor (G-CSF) have been used to stimulate neutrophil production in many clinical situations, including aplastic anemia, myelodysplasia, idiopathic neutropenia (Fig. 13.23), and cyclic neutropenia. These drugs have also been used following myelotoxic chemotherapy for disorders such as pediatric musculoskeletal tumors and breast carcinomas.63,64 The hematopoietic growth factors predominately induce granulocytosis. Changes in bone marrow in patients treated with GM-CSF and G-CSF include increased marrow cellularity with a significant prominence of myeloid precursors, an appearance that may histologically mimic a myeloproliferative disorder.65,66
Reconversion from fatty to hematopoietic marrow may simulate diffuse bone marrow disease by showing hypointensity on T1-weighted images and diffuse hyperintensity on STIR sequences (Fig. 13.24). MR marrow changes usually follow increases in peripheral blood neutrophil levels. The

P.1995


proximal femoral metaphysis and spine are common sites of marrow reconversion.33,67

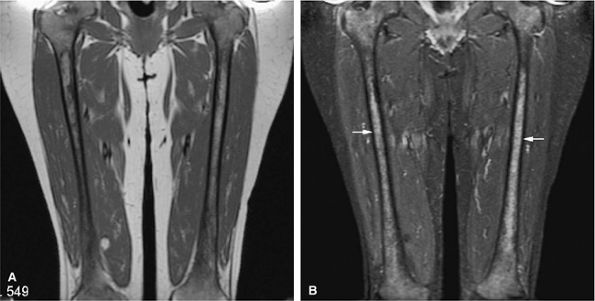
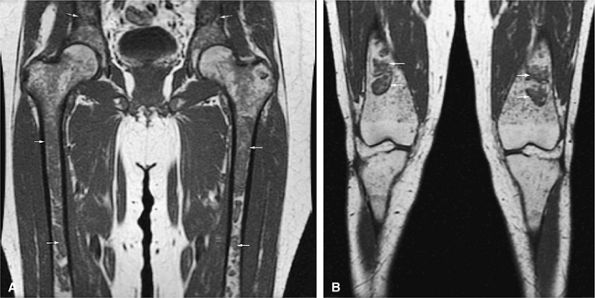
FIGURE 13.24 ● Abnormal bone marrow signal following administration of G-CSF. There is diffuse low signal on a coronal T1-weighted image of the thighs (A), which is hyperintense on the corresponding STIR image (B). G-CSF produces STIR hyperintensity, which can simulate diffuse marrow malignancies or leukemia (arrows). Bone marrow biopsy may be recommended in this situation.
Bone Marrow Transplantation
Over the past decade, the treatment of hematologic malignancies, including the use of maximum-dosage multiagent chemotherapy or radiation therapy, has become progressively more intensive. However, maximally intensive multiagent chemotherapeutic regimens result in significant side effects, notably lethal bone marrow cytotoxicity. Bone marrow transplantation is an attempt to circumvent this side effect by providing stem cells to repopulate normal marrow elements. Marrow available for transplantation is of three types:68
  • Syngeneic (i.e., from an identical twin)
  • Allogeneic (i.e., from an HLA-matched donor)
  • Autologous (i.e., from the patient)
In addition to leukemia treatment, autologous bone marrow transplantation can be used in the management of solid neoplasms such as ovarian tumors, testicular tumors, breast cancers, small cell carcinoma of the lung, Hodgkin disease, and non-Hodgkin lymphoma. Preliminary results are encouraging, and increased use of bone marrow transplantation, in conjunction with aggressive chemotherapy, is anticipated.69
Procedure
Prior to bone marrow transplantation, the patient is treated with standard chemotherapy, which ideally induces a state of remission. To eradicate any residual neoplastic cells, the patient then undergoes intensive high-dose chemotherapy, either alone or in combination with total-body irradiation. This also eradicates the patient—s immune system, preventing graft resistance in the case of an allogeneic transplantation. After ablation therapy, patients receive donor marrow by intravenous therapy. Histopathologic evidence of stem cell engraftment in the bone marrow is first seen as small clusters of erythroid cells, appearing 1 or 2 weeks after transplantation. Engraftment, comprising erythroid and granulocytic cells, is usually seen by 3 weeks. Blood counts start to rise 4 to 8 weeks after transplantation, and normocellular marrow is usually achieved 8 to 12 weeks after transplantation. In the case of autologous bone marrow transplantation, the patient—s own marrow is harvested after the induction of a remission state and cryopreserved for later infusion. Various ex vitro techniques (e.g., centrifugation, monoclonal antibodies, and pharmacologic manipulation) are available, and the ability to purge autologous marrow of contaminating neoplastic cells prior to reinfusion is continuously being improved.68,70
Graft-Versus-Host Disease
Graft-versus-host disease, one of the major complications of marrow transplantation, may occur with allogeneic HLA-matched marrow. It occurs when there is an immunologic reaction by the engrafted T cells against the tissues of the host, particularly the skin, gastrointestinal tract, and liver.71 The likelihood of graft-versus-host disease increases with patient age, which usually limits this form of marrow transplant to patients younger than 40 years of age. Recent research is exploring the possibility of ex vivo T-lymphocyte depletion from the donor marrow before transplantation to prevent graft-versus-host disease.72
MR Appearance
Bone marrow transplantation produces characteristic changes on MR studies of vertebral bone marrow.73 MR changes in the spine can be identified as early as 3 weeks after transplantation. The following changes are characteristic:
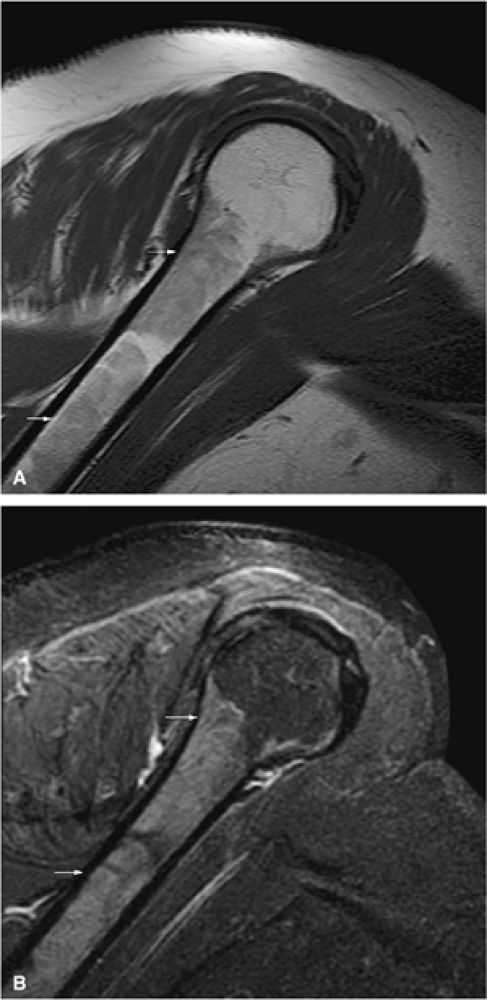
  • On T1-weighted images, there is a peripheral zone of intermediate signal intensity, representing repopulated hematopoietic cells, and a central zone of high-signal-intensity fatty marrow.
  • STIR images show a reciprocal change, with increased signal intensity in the peripheral zone of hematopoietic cells and decreased signal intensity in the central zone, because signal from fat is nulled. The alternating zones form a characteristic band pattern. Loss of this band may signify relapse, as a homogeneous area of decreased signal intensity replaces the vertebral body.
  • Repopulation of hematopoietic marrow follows vascular sinusoid pathways, which enter the periphery of the vertebral body, producing the peripheral region of intermediate signal intensity. These sinusoids drain into the basivertebral vein located in the central portion of the vertebral body. On STIR images used to evaluate repopulated marrow in the spine and pelvis after ablation therapy and bone marrow transplant, it is possible to differentiate red marrow from recurrent tumor (Fig. 13.25).
  • In patients with chronic myelogenous leukemia, posttransplant increases in marrow signal intensity have been observed in the pelvis and proximal femur, compared with pretreatment T1-weighted images.18 The

    P.1996


    intensity of signal, however, is less than that seen in disease-free marrow.

  • Hypoplastic fatty marrow may be seen prior to hematopoietic repopulation (Fig. 13.26).
  • Bone abnormalities related to total-body irradiation in long-term survivors of bone marrow transplantation for childhood leukemia have also been described.74 Skeletal abnormalities include osteochondroma, metaphyseal abnormalities (sclerosis and vertical striations), and slipped femoral capital epiphysis.
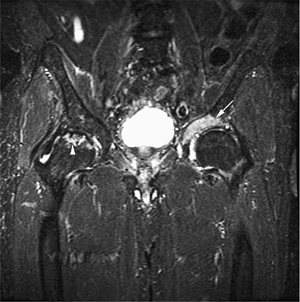
FIGURE 13.25 ● Recurrent tumor after bone marrow transplantation is seen on a coronal STIR image of the pelvis. Hyperintense recurrent tumor (arrow) is involving the acetabulum. Incidentally noted is avascular necrosis of the right femoral head (arrowhead).
FIGURE 13.26 ● Bone marrow transplant for chronic leukemia. Hypoplastic fatty marrow demonstrates bright marrow signal intensity on sagittal T1-weighted images of the thoracic (A) and lumbar (B) spine. Compression deformities are noted in the thoracic spine (arrows).
Malignant Lymphoma
Lymphomas represent neoplastic proliferation of the lymphoid cells that normally reside in primary lymphoid tissue such as lymph nodes. The two major types of lymphomas are Hodgkin disease and non-Hodgkin lymphoma. Bone marrow examination is an important component of the staging process for patients with malignant lymphoma.
Primary lymphoma of bone is characterized by lymphomatous involvement of the medullary cavity of a single bone, without concurrent lymph node or visceral involvement, for at least 6 months. It is important to differentiate primary lymphoma of bone from skeletal involvement in systemic lymphoma, since it has a better prognosis and is treated differently than systemic lymphoma.75,76
Bone marrow involvement is higher in non-Hodgkin lymphoma (ranging from 25% to 90%) than in Hodgkin disease (5–15%).77 Demonstration of marrow involvement may advance the stage of disease and contraindicate the use of nodal radiotherapy. After treatment, marrow study is crucial in following the patient for evidence of therapeutic response or lymphomatous relapse.
Hodgkin Disease
In its most common presentation, Hodgkin disease is distinguished by the following characteristics:
  • Localization to a single group of lymph nodes (i.e., cervical, cervicoclavicular, mediastinal, or para-aortic)
  • Bimodal age distribution
  • P.1997


  • Infrequent extranodal (e.g., bone marrow, CNS, gastrointestinal tract, or skin) involvement
  • Bone marrow invasion only when malignant cells enter the blood via a major lymphatic duct (an occurrence that portends a potentially fatal outcome)
  • Focal rather than generalized presentation in the marrow (Fig. 13.27)
  • An associated soft-tissue component (common) (Fig. 13.28)
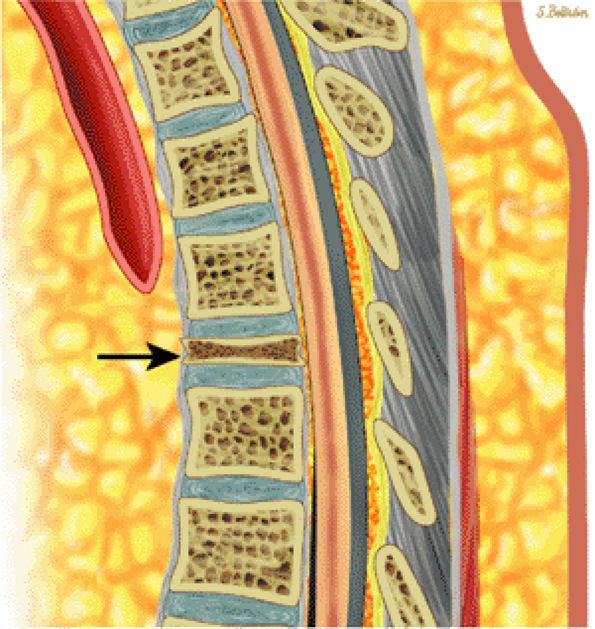
  • Spinal disease often presents with sclerosis of a vertebral body (“ivory vertebral body”) (Fig. 13.29).
FIGURE 13.27 ● Hodgkin disease of the proximal tibia. Focal marrow infiltration from lymphoma is demonstrated on coronal (A) and sagittal (B) graphic illustrations. A pathologic fracture is present (arrows).
On a microscopic level, Hodgkin lesions in the bone marrow vary from primarily cellular to primarily fibrotic. The

P.1998


unifying histopathologic feature of Hodgkin disease is the presence of Reed-Sternberg cells, which are large cells with a bilobed nucleus exhibiting prominent nucleoli set in a polycellular background of inflammatory cells and often fibrosis. Although four distinct histologic subtypes of Hodgkin disease have been identified (lymphocyte predominant, nodular sclerosis, mixed cellularity, and lymphocyte depleted), the prognosis rests primarily in the clinical and pathologic stage of disease rather than its histologic subtype.78

FIGURE 13.28 ● Patchy marrow infiltration of the femur in a patient with Hodgkin disease. (A) Abnormal marrow is hyperintense on a sagittal STIR image (arrows). (B) Surrounding edema and soft-tissue component is demonstrated on an axial fat-suppressed T2-weighted image (arrows).
FIGURE 13.29 ● Spinal involvement in Hodgkin disease. Sagittal graphic illustration demonstrates sclerosis of a thoracic vertebral body (“ivory vertebral body”) with associated soft-tissue component (arrow).
Non-Hodgkin Lymphoma
Malignant lymphomas other than Hodgkin disease are referred to as non-Hodgkin lymphoma. Within this classification is a diverse group of diseases that span various morphologic and immunologic types. They range from low-grade indolent processes to highly aggressive lesions that, if left untreated, are rapidly fatal. The various types of non-Hodgkin lymphoma differ in their response to therapy. In contrast to Hodgkin disease, the prognosis of non-Hodgkin lymphoma is more directly related to the histologic subtype than to the clinical and pathologic stage.
Low-grade non-Hodgkin lymphoma, notably small cleaved cell lymphoma and well-differentiated small lymphocytic cell lymphoma, has a high incidence of marrow involvement. When initially diagnosed, low-grade non-Hodgkin lymphoma almost always involves widespread lymph nodes at multiple sites in an asymmetric distribution above and below the diaphragm. In 50% of cases, the bone marrow is affected at the time of diagnosis. On a microscopic level, small cleaved cell lymphomas tend to be focal and patchy and form nodules in a peritrabecular location. Splenic involvement is usually in the form of small miliary nodules centered in the white pulp zones.79 Marrow involvement in well-differentiated small lymphocytic lymphoma is most commonly diffuse or interstitial (Fig. 13.30).
High-grade non-Hodgkin lymphoma (including large cell lymphoma) may be designated as histiocytic or reticulum cell (large cell), immunoblastic, lymphoblastic, Burkitt, or non-Burkitt lymphoma. Morphologically and immunologically, high-grade non-Hodgkin lymphoma is the most heterogeneous type of lymphoma. It is the most common primary lymphoma arising in bone (Figs. 13.31 and 13.32) and is the type that occurs most often in acquired immunodeficiency syndrome (AIDS). In contrast to the low-grade (i.e., small cleaved cell) lymphoma, microscopic marrow involvement in high-grade lymphoma can be focal or widespread, but there is no peritrabecular bony preference.
A rapidly growing mass at a single nodal or extranodal site is the typical clinical presentation in large cell lymphoma. Liver and spleen involvement, not common at the time of diagnosis, consists of large masses, as opposed to

P.1999


P.2000


the small miliary nodules typical of low-grade lymphomas. Large cell lymphomas are rapidly fatal if not treated. However, with aggressive multiagent chemotherapy, complete remission can be achieved in 60% to 80% of patients. In contrast, low-grade lymphoma is relatively resistant to chemotherapy, although it exhibits an indolent clinical course.79

FIGURE 13.30 ● Malignant lymphoma, predominantly small cleaved cell type. Small cleaved lymphocytes can be seen in the interstitium (H & E; original magnification × 400).
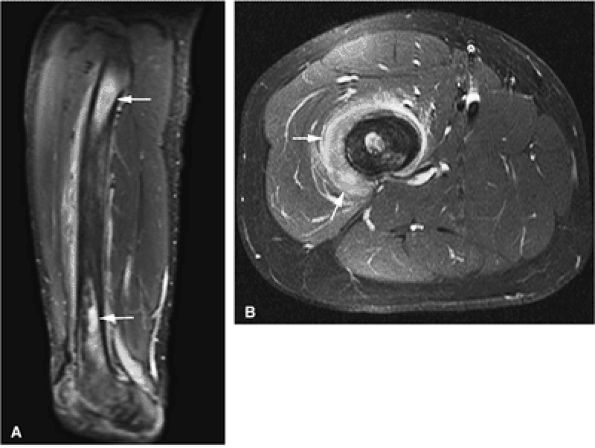
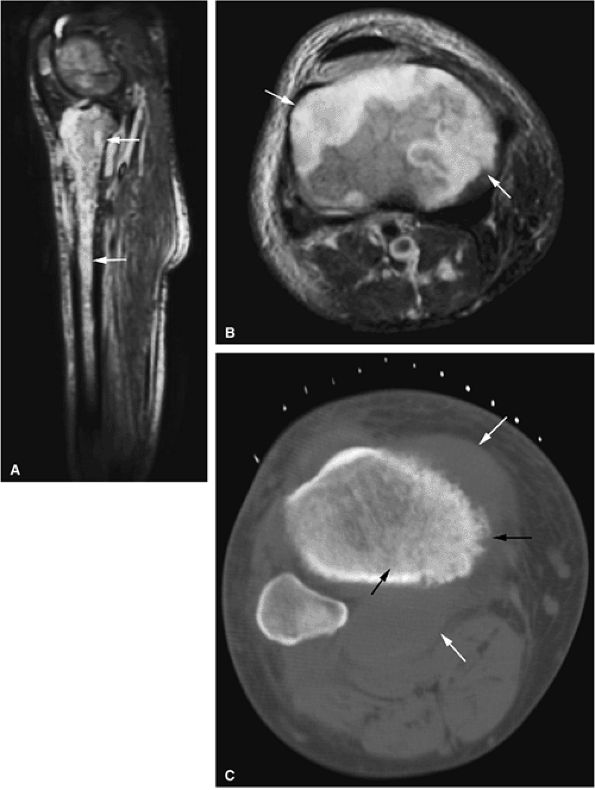
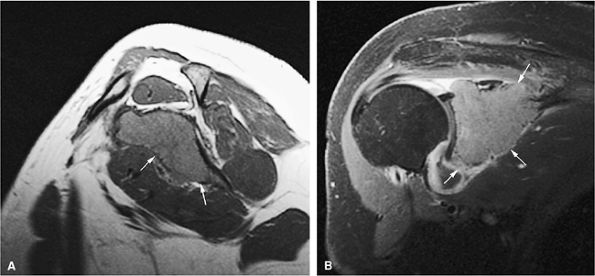
FIGURE 13.31 ● High-grade lymphoma of bone. (A) Marrow involvement of the distal femur is hypointense on a coronal T1-weighted image (arrows). (B) The extent of marrow involvement is better seen on a sagittal STIR image (white arrows). Peritumoral edema and soft-tissue component are hyperintense (black arrowheads). (C) Large associated soft-tissue component is seen on an axial fat-suppressed T2-weighted image (arrows). (D) Axial CT image obtained for biopsy shows destruction of the distal femur with pathological fracture (arrow). (E) Osseous destruction with soft-tissue component is demonstrated (arrows).
FIGURE 13.32 ● High-grade non-Hodgkin lymphoma of the tibia. (A) Sagittal STIR image demonstrates hyperintense marrow infiltration (arrows). (B) Abnormal enhancement of the bone marrow is seen on an axial fat-suppressed T1-weighted image (arrows). (C) Soft-tissue component (white arrows) and marrow infiltration (black arrows) are seen on an axial CT image obtained during biopsy.
Lymphoblastic Lymphoma
Lymphoblastic lymphoma, also a high-grade lymphoma, is usually diffuse in the bone marrow. It commonly occurs in adolescence and represents approximately one third of cases of childhood non-Hodgkin lymphoma. It often progresses to extensive, diffuse bone marrow involvement and frank leukemia. The presentation is usually mediastinal (Fig. 13.33).
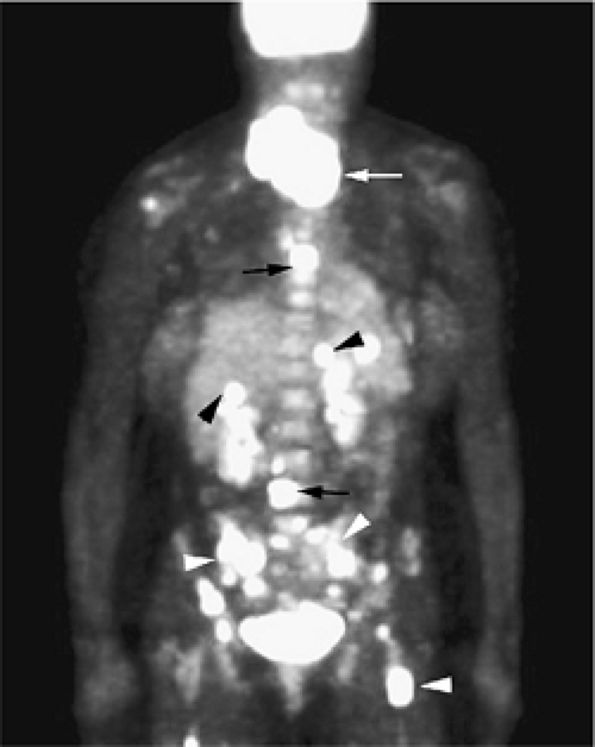
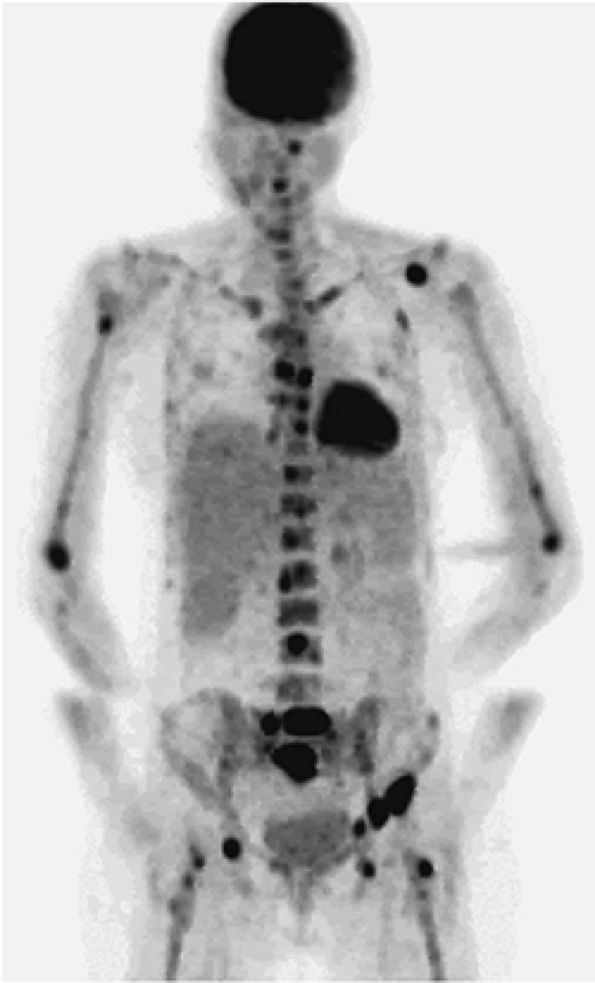
FIGURE 13.33 ● Whole-body FDG-PET scan in a patient with lymphoblastic lymphoma. Large mass with abnormal FDG uptake is noted involving the upper mediastinum (white arrow). Increased uptake is noted throughout the spine (black arrows), the pelvis, and the proximal femurs (white arrowheads). Foci of increased uptake in the liver are consistent with tumor involvement (black arrowheads).
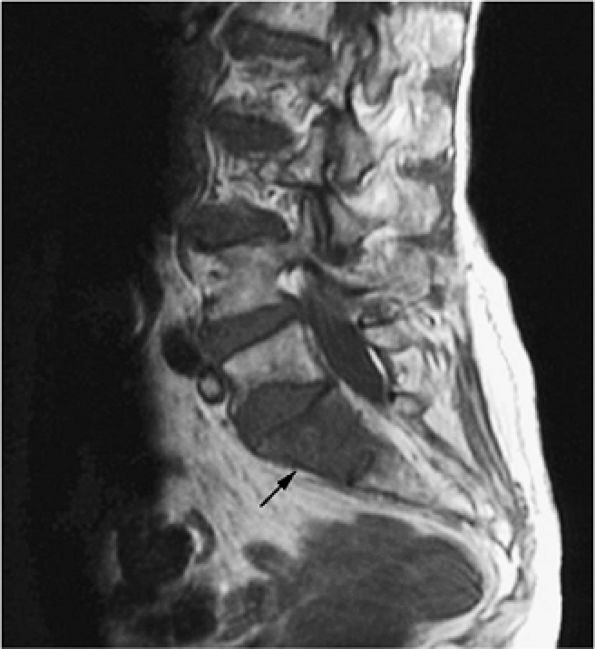
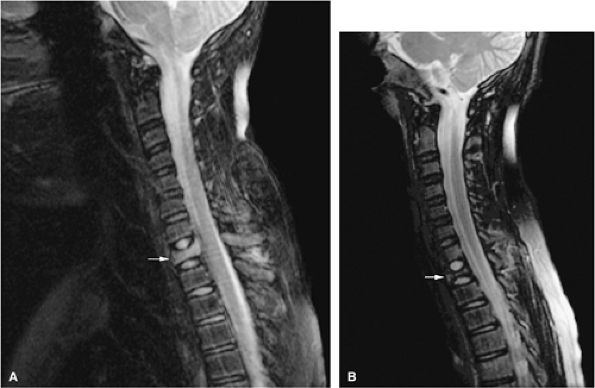
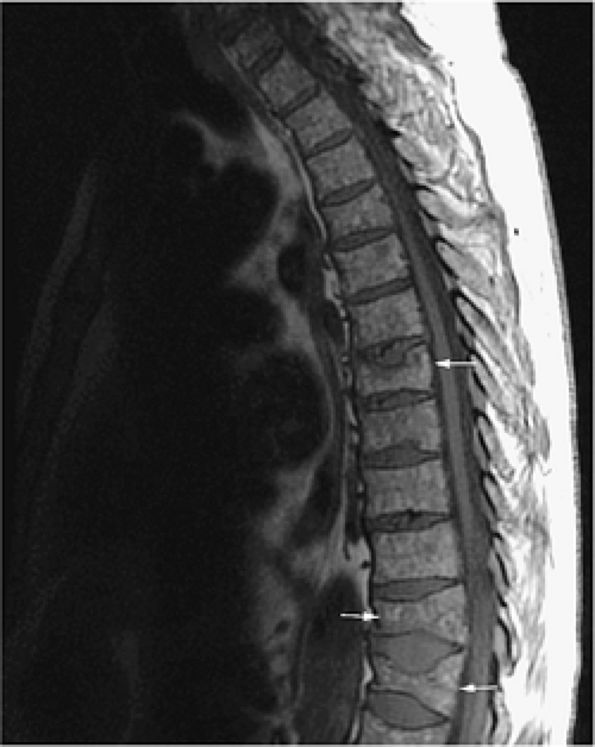
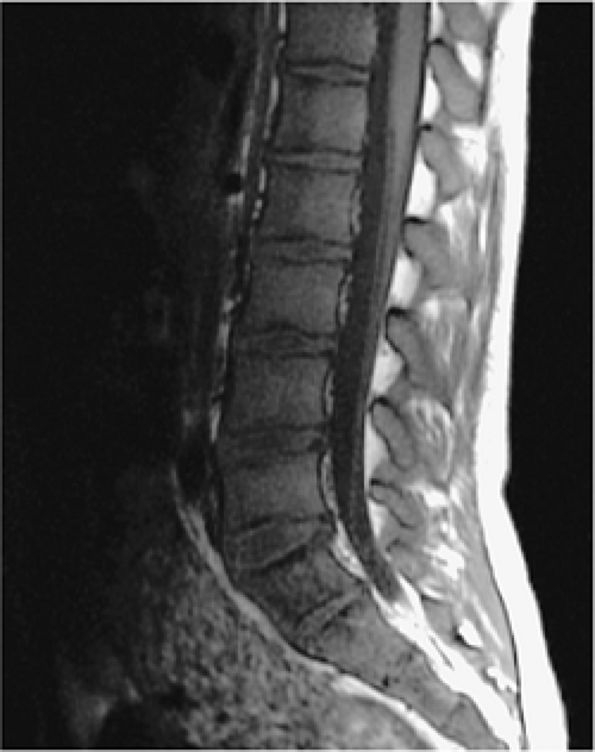
FIGURE 13.34 ● Sagittal T1-weighted image of the lumbosacral spine demonstrates focal low signal intensity of the S1 vertebral body, consistent with lymphomatous involvement (arrow).

P.2001


Burkitt Lymphoma
Burkitt lymphoma is another diffuse, high-grade lymphoma. In non-endemic areas such as the United States, it usually occurs in older children and presents as a rapidly growing abdominal mass with marrow involvement, malignant pleural effusions, and ascites.
MR Findings
Unlike leukemia, lymphoma tends to form nodules or marrow tumors (Fig. 13.34),80,81 although at times it is diffuse and simulates leukemia on MR images (Fig. 13.35).82 When diffuse, it can usually be detected by posterior crest marrow biopsy. Frequently, however, sampling error produces a negative marrow biopsy finding, especially when lymphomatous involvement is asymmetric. Bone scanning results are also frequently negative, even in lymphoma patients with known marrow involvement.
MR imaging, however, has the advantage of being able to sample a large volume of marrow, thus making it possible to detect marrow involvement. Since identification of marrow tumor in patients with lymphoma affects both staging and treatment, this is potentially one of the more important clinical applications for MR imaging of the body.83,84
The following are some of the more important findings in the MR imaging of lymphoma:
  • Staging is of particular importance in Hodgkin disease because bone marrow involvement presents a potentially

    P.2002


    fatal outcome and is therefore treated with more aggressive multiagent chemotherapy. Whole-body MR imaging and whole-body FDG-PET have been found to be useful in the staging of lymphoma.30,85,86,87

  • Mediastinal tumor is common in the supradiaphragmatic presentation of Hodgkin disease, and MR imaging can also identify bone marrow involvement not appreciated at the time of diagnosis.
  • An additional benefit of MR imaging, particularly when STIR protocols are used, is the depiction of lymph node invasion. In contrast, CT, although highly accurate for lymph node detection, is insensitive to marrow involvement in the absence of bone destruction.
  • Focal marrow lymphoma may simulate metastatic disease (Fig. 13.36). In contrast to Hodgkin disease, non-Hodgkin lymphoma demonstrates early bone marrow involvement.
  • AIDS-related lymphomas, which are high grade and of B-cell origin, frequently demonstrate both marrow dissemination and soft-tissue involvement. Short TI inversion recovery contrast is most effective in characterizing these sites of tumor involvement.
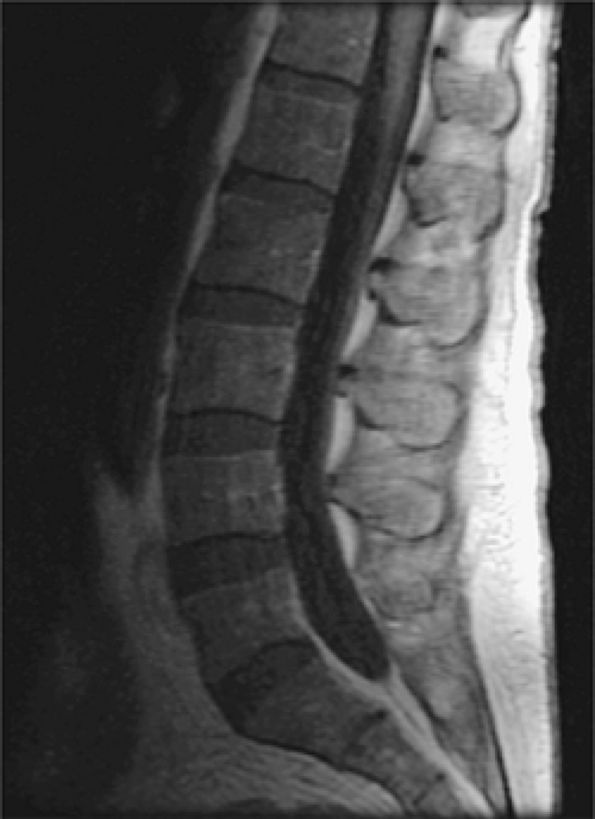
FIGURE 13.35 ● Diffuse lymphomatous involvement of the spine. Infiltration of the marrow is hypointense on a sagittal T1-weighted image of the lumbar spine simulating leukemic involvement.
MR imaging is also useful in evaluating post-therapeutic changes:88
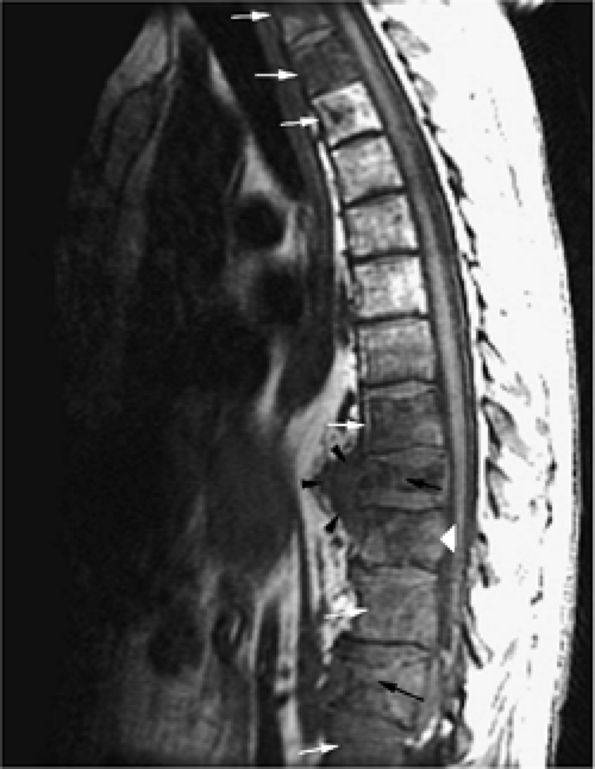
  • Changes in lumbar vertebral bone marrow have been characterized on MR scans of patients receiving radiation

    P.2003


    therapy for Hodgkin disease.89,90 In response to treatment with 1,500 to 5,000 rads, increased signal intensity can be detected on STIR images within 2 weeks. MR changes are thought to reflect marrow edema and necrosis.

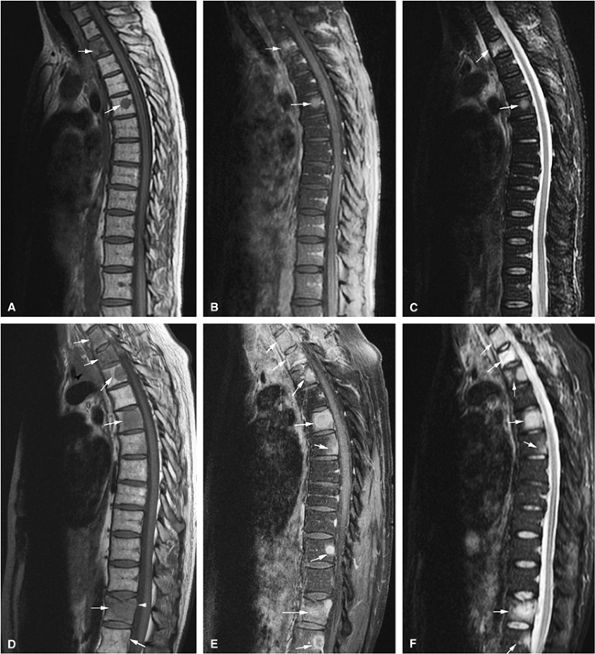
  • On T1-weighted images, increased heterogeneity of signal intensity, caused by the predominance of high-signal-intensity fat, can be identified 3 to 6 weeks after radiation.
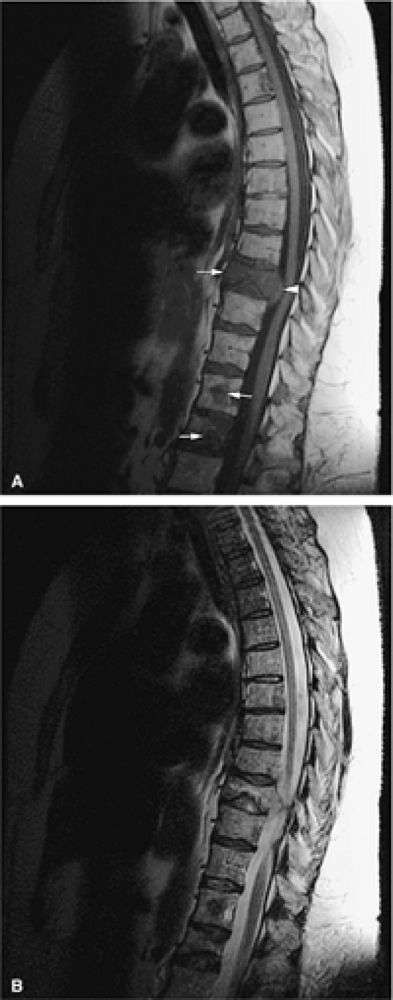
  • Late marrow changes, including fatty marrow replacement, occur 6 weeks to 14 months after radiation therapy. On MR scans, these changes are seen as either homogeneous fatty marrow replacement of the vertebral body (Fig. 13.37) or peripheral hematopoietic intermediate-signal-intensity marrow adjacent to a central zone of fatty marrow.
  • The delineation between irradiated and nonirradiated areas can be sharply defined on STIR images, on which fat displays dark or black signal intensity and adjacent hematopoietic marrow demonstrates intermediate signal intensity.
  • On T1-weighted images, the postradiation identification of low-signal-intensity vertebral body marrow, especially in the presence of fat marrow signal intensity seen at other levels, is consistent with recurrent disease. T1-weighted and STIR images are most sensitive in identifying recurrent disease in or adjacent to the field of radiation.
  • Coronal T1-weighted and STIR images are also useful in evaluating internal changes in tumor size and recurrent disease in Hodgkin disease and non-Hodgkin lymphoma after whole-body irradiation and bone marrow transplantation.
  • Monoclonal antibodies tagged to a radioisotope or chemotherapeutic agent have also been used in lymphoma treatment. On STIR images, red marrow stores can be differentiated from lymphoma by the significantly increased signal intensity in lymphomatous infiltration. In long-term fatty replacement of bone marrow after radiation therapy for Hodgkin disease, studied by Kauczor et al.,91 there is an increase in relative fat signal in the thoracic and lumbar spines, without signs of marrow degeneration, 15 to 126 months after radiation therapy. Nonirradiated pelvic and femoral marrow, however, demonstrates a relative decrease in fat signal intensity, indicating marrow reconversion. In patients receiving radiation therapy for cervical carcinoma, signal intensity changes in pelvic marrow can be detected as early as 8 days after the initiation of radiation therapy. A complete fatty marrow pattern is observed 6 to 8 weeks after radiation therapy.92 Adjacent nonirradiated marrow demonstrates lesser degrees of similar signal intensity changes on T1-weighted and STIR images.
FIGURE 13.36 ● (A) An anteroposterior radiograph of the pelvis is negative for lymphomatous involvement. (B) On a T1-weighted coronal image of the pelvis, the proximal femurs and lower lumbar spine (arrows) display nonspecific low signal intensity. The fatty marrow of the epiphysis and greater trochanter is spared. (C) On a coronal STIR image, there is high-signal-intensity patchy nodularity of lymphomatous marrow involvement in the pelvis, proximal femurs, and lumbar spine (arrows). The spared yellow marrow of the greater trochanter and femoral epiphysis appears black.
FIGURE 13.37 ● Fatty marrow infiltration following radiation therapy for non-Hodgkin lymphoma. Sagittal T1-weighted image of the cervical spine shows diffuse bright-signal vertebral bodies (arrows).
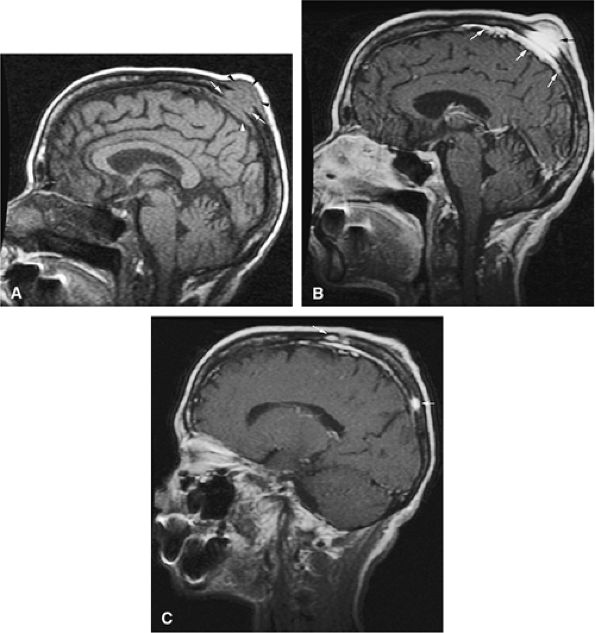
Histiocytic Proliferative Disorders
Langerhans Cell Histiocytosis
Three related diseases—eosinophilic granuloma, Letterer-Siwe disease, and Hand-Schüller-Christian disease —are included under the designation Langerhans cell histiocytosis. Although all three represent neoplasia of a special form of histiocyte, known as the Langerhans cell, they differ with respect to the extent of organ involvement and prognosis.
Eosinophilic granuloma, a unifocal bone lesion, is a benign disorder that typically occurs in children and young adults.93 In some cases, spontaneous healing and fibrosis occur within a year or two of presentation. Other cases require curettage or local irradiation. Percutaneous steroid injections under CT guidance have been successfully used to treat lesions of eosinophilic granuloma.94,95,96 MR findings in these non-aggressive lesions are characterized by areas of low signal intensity on T1-weighted images and increased signal intensity on T2-weighted images (Fig. 13.38). Long-bone involvement, typically diaphyseal, may affect the

P.2004


P.2005


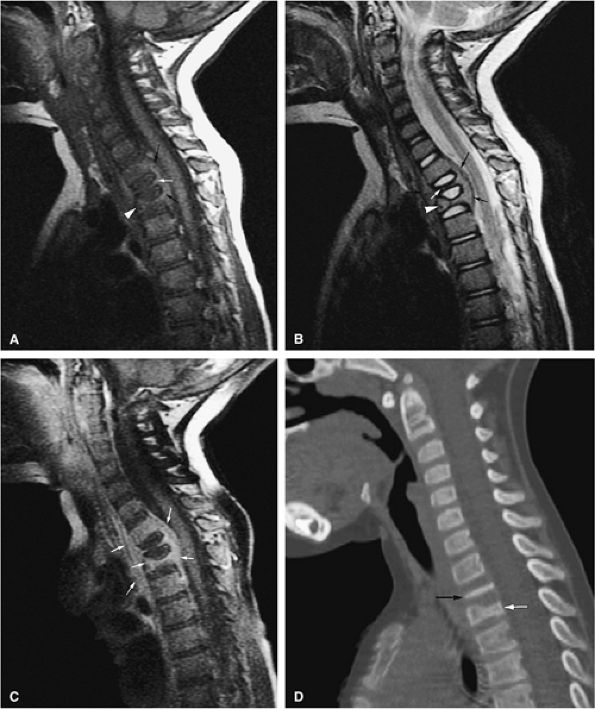
metaphysis or extend to the physeal plate (Fig. 13.39). There may also be localized bone expansion, indicated by a low-signal-intensity sclerotic peripheral border. Eosinophilic granuloma may be associated with perilesional or peritumoral edema. In the vertebral body, eosinophilic granuloma may present as a vertebra plana with diffuse infiltration of the vertebral body (Figs. 13.40, 13.41, and 13.42). Typical characteristics on T1- and T2-weighted images, however, are nonspecific for the diagnosis of eosinophilic granuloma. Age, location and morphology of signal intensity changes, is important in determining a differential diagnosis.

FIGURE 13.38 ● Langerhans cell histiocytosis of the humeral diaphyses. (A) Anteroposterior radiograph shows an expansile lytic lesion in the humeral diaphysis (arrow). (B) Coronal T1-weighted image shows low-signal-intensity histiocytic infiltration (arrow). (C) The lesion is hyperintense on a coronal STIR image (black arrow). Surrounding edema is hyperintense (white arrows). (D) Cortical thickening (white arrowheads) and surrounding edema (white arrows) are noted on an axial fat-suppressed T2-weighted image. (E) On a coronal fat-suppressed T1-weighted image following the intravenous administration of gadolinium, there is enhancement of the diaphyseal lesion (white arrowhead) with a central nonenhancing area (black arrowhead). Enhancing edema surrounds the lesion (white arrows). (F) Axial CT image obtained during percutaneous biopsy shows the expansile lytic lesion (arrow).
FIGURE 13.39 ● Langerhans cell histiocytosis of the femoral diaphysis and metaphysis. Coronal T1-weighted image shows patchy areas of low-signal-intensity histiocytic infiltration (arrows).
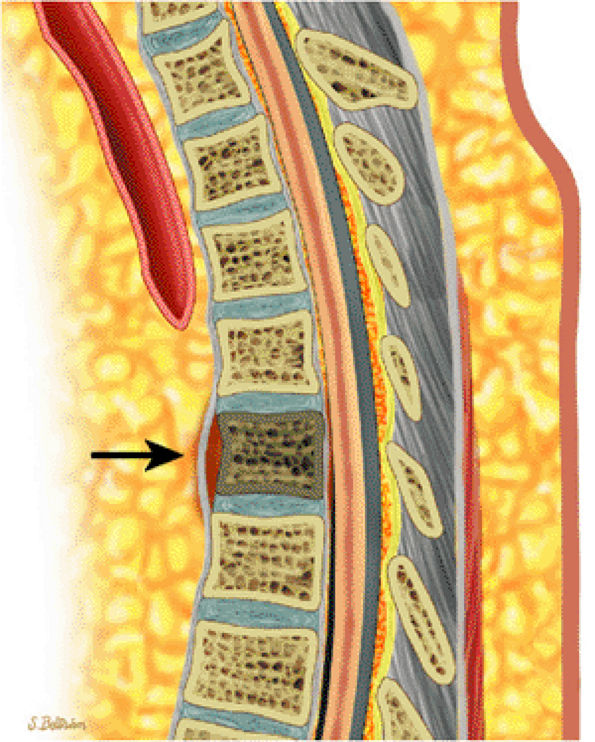
FIGURE 13.40 ● Sagittal graphic illustration shows vertebra plana of the thoracic spine (arrow).
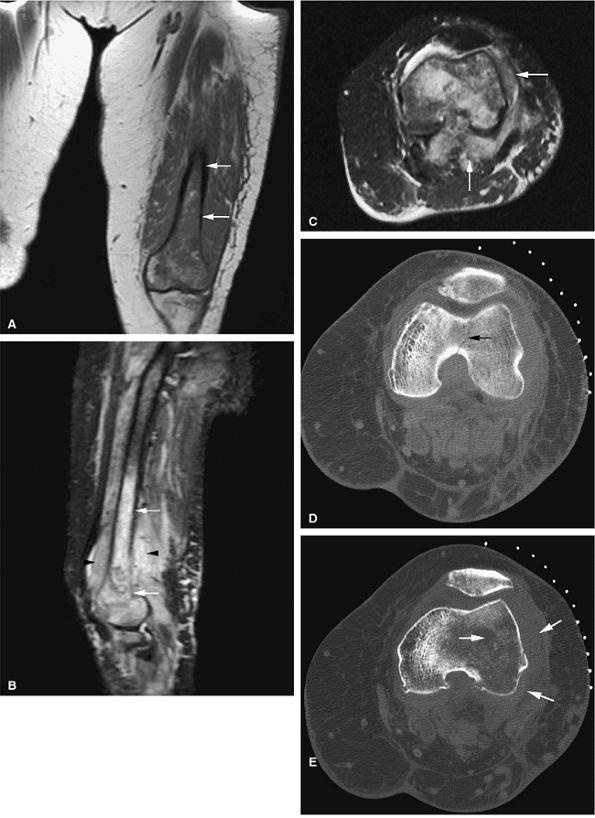
FIGURE 13.41 ● (A) Sagittal T1-weighted image shows complete collapse of the T2 vertebral body (white arrow) and greater than 50% collapse of the T3 vertebral body (white arrowhead). A surrounding soft-tissue mass is noted (black arrow). (B) Corresponding T2-weighted image shows collapse of the T2 (white arrow) and T3 (white arrowhead) vertebral bodies. A surrounding soft-tissue component is present (black arrows). (C) On a sagittal fat-suppressed T1-weighted image following the intravenous administration of gadolinium, there is diffuse enhancement of the tumor and soft-tissue component (arrows). (D) Sagittal CT image shows complete collapse of the T2 vertebral body (black arrow). Vertebral body height loss of T3 is also noted (white arrow).
FIGURE 13.42 ● (A) Sagittal STIR image shows collapse and edema of the T1 vertebral body (arrow). (B) Following therapy there is increased vertebral body collapse and resolution of edema as seen on a sagittal STIR image (arrow). The patient was asymptomatic at this point.

P.2006


P.2007


The multifocal form of the disease, known as Hand-Schüller-Christian disease, usually presents in patients younger than 5 years of age. Systemic symptomatology is common; the classic triad of calvarial bone lesions, exophthalmos, and diabetes insipidus (caused by posterior pituitary or hypothalamic involvement) is diagnostic for Hand-Schüller-Christian disease.
The most aggressive form of Langerhans cell histiocytosis is Letterer-Siwe disease, which classically affects infants and young children. It involves virtually all of the organs of the body, including bone marrow. Current chemotherapy has improved the prognosis for this disease; a 40% to 50% 5-year survival rate has been attained.97
Multiple Myeloma
Multiple myeloma, the most common primary neoplasm of bone, is caused by the uncontrolled proliferation of malignant plasma cells within the marrow.98 The neoplastic plasma cells secrete nonfunctional monoclonal immunoglobulins, and these immunoglobulins can be measured in the serum or urine to aid in the diagnosis. The plasma cells also produce an osteoclastic stimulating factor, responsible for the skeletal destruction (punched-out osteolytic lesions and diffuse osteopenia) (Fig. 13.43) seen in multiple myeloma.98,99 The peak incidence of multiple myeloma is between 50 and 60 years of age, and the disease is rare in patients younger than 40 years of age. Amyloidosis occasionally complicates myeloma.
There are two variants of myeloma: solitary bone plasmacytoma (Fig. 13.44) and extramedullary plasmacytoma. Solitary lesions, or plasmacytomas, are more common in young or middle-aged adults and may be accompanied by back pain and cord compression. The sclerotic presentation of multiple myeloma is rare and has been termed the POEMS syndrome (P for progressive sensorimotor polyneuropathy; O for

P.2008


P.2009


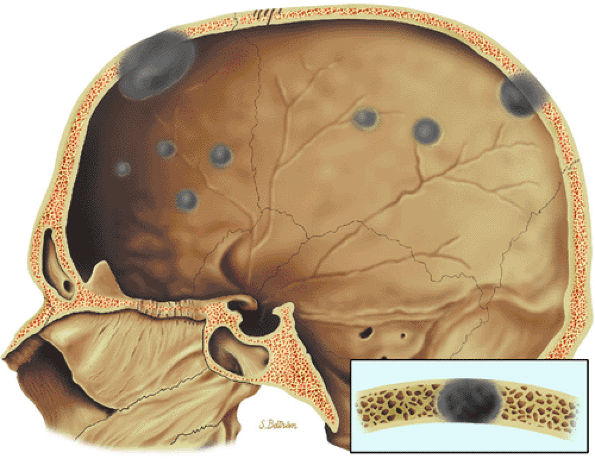
osteosclerotic bone lesions; E for endocrine abnormalities, including diabetic mellitus, adrenal insufficiency, and hypothyroidism; M for an increase in serum M protein; and S for skin thickening with increased pigmentation).100,101 According to the staging system proposed by Durie and Salmon, patients with up to one lytic bone lesion present with stage I and patients with more than one lytic bone lesion present with stage III.102,103,104

FIGURE 13.43 ● Multiple punched-out lesions are seen as gray areas of the skull on this sagittal graphic illustration.
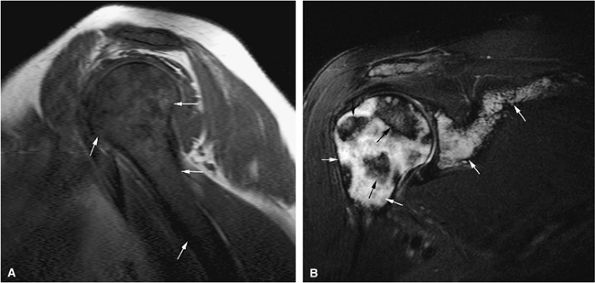
FIGURE 13.44 ● Plasmacytoma of the scapula. (A) Sagittal T1-weighted image shows marrow infiltration that demonstrates low signal intensity (arrows). (B) On a coronal fat-suppressed T2-weighted image, the tumor is intermediate in signal intensity. Osseous expansion is noted (arrows).
FIGURE 13.45 ● Whole-body FDG-PET scan of a patient with myeloma shows multiple areas of abnormal FDG uptake involving the axial and peripheral skeleton.
MR Appearance
Imaging is important in the diagnosis of multiple myeloma. Nuclear scintigraphy using technetium is limited, however, and there must be significant medullary bone involvement before osteoporosis or lytic lesions can be detected on conventional radiographs.105 FDG-PET has been shown to be sensitive in the detection of myelomatous lesions (Fig. 13.45).1,106 MR imaging is well suited to demonstration of marrow involvement, which is characteristically multifocal (Figs. 13.46 and 13.47).107 Multiple myeloma may also present as a complete marrow replacement, simulating leukemia (Figs. 13.48 and 13.49).

P.2010


MR imaging of the spine in early myeloma may show involvement in both symptomatic and asymptomatic patients (Figs. 13.50 and 13.51).93

FIGURE 13.46 ● (A) Multifocal presentation (arrows) of multiple myeloma with interspersed normal marrow on a coronal T1-weighted image. (B) The lesions (arrows) are hyperintense on this sagittal STIR image. Soft-tissue extension and surrounding edema are better seen on the STIR image (arrowheads).
FIGURE 13.47 ● (A) Multiple myeloma showing hypointense marrow involvement (arrows) on a sagittal T1-weighted image of the thoracic spine. Vertebral body collapse and epidural extension of the tumor are noted (arrowhead). (B) Marrow involvement is not well seen on the corresponding sagittal T2-weighted image.
MR evaluation of multiple myeloma includes the following:
  • Areas of involvement demonstrate low signal intensity on T1-weighted images and high signal intensity on T2-weighted, STIR, and Gd-DTPA enhanced images (Figs. 13.52 and 13.53).108
  • STIR images demonstrate greater lesion contrast than that seen on corresponding conventional T2-weighted images.
  • Whole-body imaging is useful in detecting the extent of myelomatous involvement.56,105,109 The percentage of bone marrow involvement may not correlate with the MR appearance, however.110
FIGURE 13.48 ● A diffuse pattern of marrow replacement of the elbow is indicated in gray on this coronal graphic illustration.
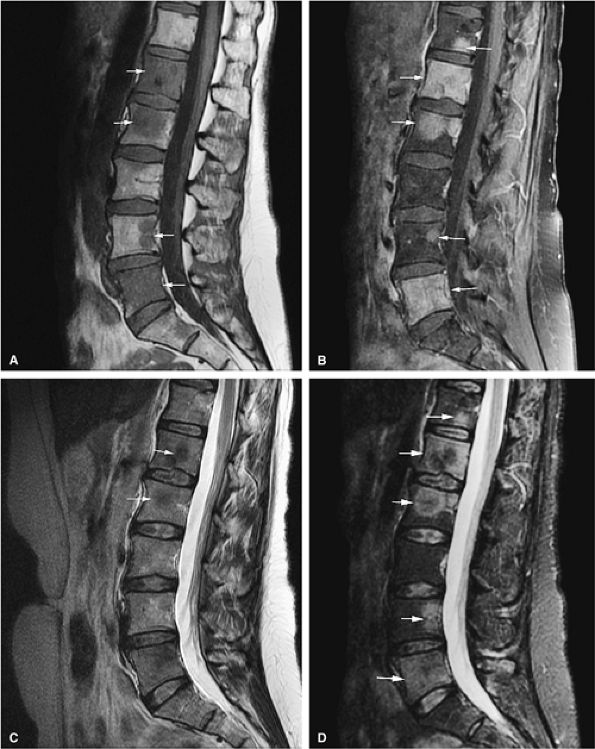
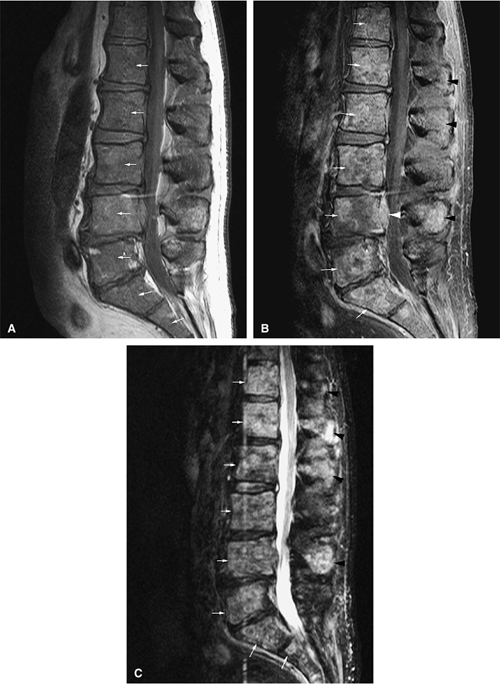
FIGURE 13.49 ● Sagittal T1-weighted image shows a diffuse pattern of involvement of the thoracic spine. Myelomatous infiltration is hypointense. Multiple compression fractures are present (arrows).
FIGURE 13.50 ● Multiple myeloma in a patient with elevated urinary light chains and low back pain. Diffuse marrow replacement is dark on a sagittal T1-weighted image. A pathologic compression fracture of L2 is present (arrow).
FIGURE 13.51 ● Diffuse marrow replacement with an epidural soft-tissue mass in a patient with multiple myeloma. (A) Sagittal T1-weighted image shows diffuse marrow replacement of the lumbar spine. The large epidural soft-tissue lesion causes a mass effect on the thecal sac (arrow). Myelomatous marrow infiltration is darker than the adjacent intervertebral disks. (B) Enhancement of the soft-tissue mass is shown on a sagittal fat-suppressed T1-weighted image after intravenous administration of gadolinium (arrow). (C) Diffuse marrow replacement is not well seen on the corresponding sagittal T2-weighted image.
FIGURE 13.52 ● (A) Sagittal T1-weighted image shows diffuse bone marrow replacement of the thoracic spine. Marrow replacement is darker than the adjacent disk on a T1-weighted image. Compression fractures with an epidural soft-tissue component are present (arrows). (B) Marrow involvement is hyperintense on a sagittal STIR image. There is involvement of the vertebral bodies and posterior elements. (C) Involved marrow and associated soft-tissue components are hyperintense on a sagittal fat-suppressed T1-weighted image after the intravenous administration of gadolinium. (D) On a sagittal CT image, bone marrow infiltration and lytic lesions involving the thoracic spine are noted. Destruction of the vertebral bodies and posterior elements is present (white arrows). Pathologic fracture with extension into the spinal canal can also be seen (black arrow).
FIGURE 13.53 ● Multiple myeloma of the skull. (A) Sagittal T1-weighted image demonstrates myelomatous lesion of the calvarium (white arrows). An associated soft-tissue mass (black arrowheads) and dural thickening (white arrowhead) are noted. (B) Enhancement of the lesion (black arrow) and underlying dura (white arrows) is seen on a fat-suppressed T1-weighted image after administration of gadolinium. (C) Additional enhancing lesions are identified on a sagittal fat-suppressed T1-weighted image after administration of gadolinium (arrows).

P.2011


P.2012


P.2013


MR findings in multiple myeloma patients who have responded to chemotherapy include:
  • Resolution of the abnormal marrow or a persistent marrow abnormality without associated contrast enhancement is seen in a positive therapeutic response.111,112
  • A pattern of peripheral rim enhancement also correlates with a positive response to chemotherapy.
  • A partial response to treatment is characterized by conversion from a diffuse to a variegated or focal marrow pattern, with decreased signal intensity in areas of marrow previously showing persistent contrast enhancement with intravenous gadolinium.
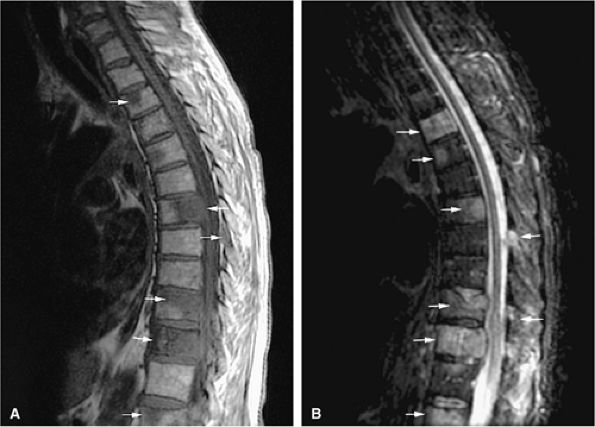
FIGURE 13.54 ● Prostate carcinoma that has metastasized to the spine. Spinal metastases (arrows) demonstrate low signal intensity on a T1-weighted sagittal image (A), with evidence of enhancement on a sagittal fat-suppressed T1-weighted image following the intravenous administration of gadolinium (B). The tumor is not well seen on the corresponding T2-weighted image (C) and is better visualized on the STIR sequence (D).

P.2014


P.2015


Metastatic Disease of the Marrow
In adults, marrow metastases most commonly result from carcinoma of the prostate (Fig. 13.54), breast (Fig. 13.55), lung (Fig. 13.56), kidney (Fig. 13.57), gastrointestinal tract (Fig. 13.58), and melanoma of the skin (Fig. 13.59). In pediatric patients, the most common primaries that metastasize to the marrow are neuroblastoma, rhabdomyosarcoma, and Ewing sarcoma. Marrow invasion occurs by hematogenous dissemination, and the high frequency of metastases to the pelvic bones, vertebrae, and sternum is attributed to the abundant vascular supply afforded by the vertebral venous plexus, which serves as a major venous pathway (Figs. 13.60, 13.61, and 13.62).113 Metastatic tumor deposits in the marrow can

P.2016


P.2017


P.2018


P.2019


P.2020


P.2021


be accompanied by necrosis, fibrosis, bone destruction (osteolytic activity), or bone production (osteoblastic activity) (Fig. 13.63).114

FIGURE 13.55 ● Metastatic breast carcinoma. Multiple metastatic lesions of the pelvis and lumbar spine (arrows) are hypointense on a coronal T1-weighted image (A) and hyperintense on a coronal STIR image (B). The greatest degree of hyperintensity is seen in the more active lesions of the lumbar spine, the left hemipelvis, and the proximal femur.
FIGURE 13.56 ● Metastatic lung carcinoma (arrows). (A) Sagittal T1-weighted image shows multiple metastatic deposits in the lumbar spine involving the vertebral bodies and posterior elements. (B) Metastatic tumor is hyperintense on a sagittal STIR image.
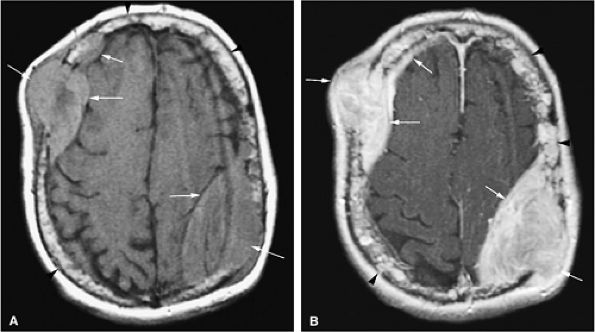
FIGURE 13.57 ● Extensive bone marrow replacement of the skull secondary to metastatic renal cell cancer (arrowheads). Large focal lesions with intracranial extension are present (arrows). (A) Axial proton density-weighted image shows expansion of the marrow cavity and metastatic deposits that demonstrate intermediate signal intensity. (B) Extensive enhancement of metastatic disease is seen on an axial fat-suppressed T1-weighted image following the intravenous administration of gadolinium.
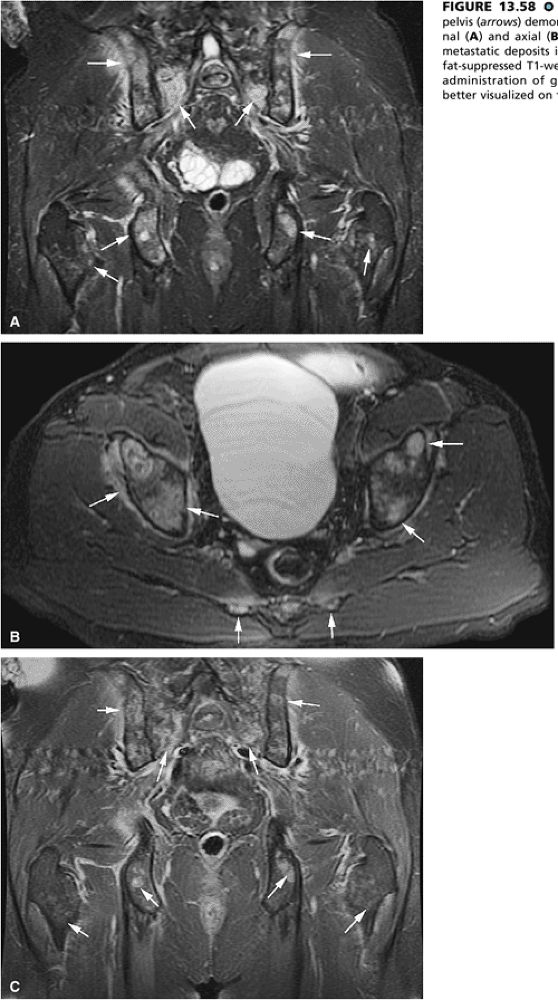
FIGURE 13.58 ● Colon carcinoma metastatic to the pelvis (arrows) demonstrates high signal intensity on coronal (A) and axial (B) STIR images. (C) Enhancement of metastatic deposits is noted on a corresponding coronal fat-suppressed T1-weighted image following intravenous administration of gadolinium. Metastatic deposits are better visualized on the STIR sequence.
FIGURE 13.59 ● Melanoma metastatic to the lumbar spine (arrows) shows diffuse low-signal-intensity marrow infiltration on a sagittal T1-weighted image (A) and high signal on a sagittal fat-suppressed contrast-enhanced T1-weighted image (B). An enhancing epidural component is noted posterior to L4 (white arrowhead). (C) Metastatic tumor is hyperintense on the corresponding sagittal STIR image (arrows). Posterior element involvement (black arrowheads) is better demonstrated on the STIR and contrast-enhanced images.
FIGURE 13.60 ● Coronal graphic illustration of the hip shows diffuse metastatic marrow replacement. The pelvic bones are a common site for metastatic disease due to their rich vascular supply.
FIGURE 13.61 ● Metastatic disease to the lumbar spine is shown in brown on a sagittal graphic illustration. The spine has a rich blood supply through the vertebral venous plexus and is therefore a common site for metastases.
FIGURE 13.62 ● A coronal graphic illustration shows metastatic deposits involving the proximal femoral and humeral metaphyses and spine in red. These are common sites for metastatic disease.
FIGURE 13.63 ● Metastatic breast carcinoma with osteo-blastic metastases. (A) Sclerotic metastases (white arrows) are seen on a sagittal CT image. Osteolytic marrow infiltration of the L1 vertebral body and posterior elements with an associated compression fracture is noted (black arrows). (B) Hypointense vertebral bodies are shown on a sagittal T1-weighted sagittal image (black arrows). The focal metastatic deposits are darker than the vertebral bodies (white arrows). Hyperintense signal surrounding the L4 and L5 metastases is noted, indicating response to therapy (arrowheads). (C) The osteoblastic lesions remain hypointense on a sagittal STIR image (white arrows), whereas the vertebral bodies are hyperintense (black arrows).
FIGURE 13.64 ● Metastatic breast cancer involving the shoulder. (A) Diffuse hypointense marrow replacement is seen on a sagittal T1-weighted image (arrows). (B) Metastatic tumor is better visualized on the coronal STIR image (white arrows). Uninvolved marrow is hypointense (black arrows).
MR Appearance
The potential contrast between metastatic tumor and normal adult marrow is high, because almost all metastatic tumors are characterized by long T1 and variably long T2 relaxation times. T1-weighted spin-echo sequences are very useful in this situation. STIR images have even higher contrast between metastatic tumor and normal or irradiated marrow. The latter has a characteristic appearance on MR scans. The T2 relaxation time of metastatic deposits is often unpredictably variable, and lesions may be difficult to separate from normal fatty marrow. Depending on the degree of T2 prolongation versus the amount of blastic bone, the net signal is often variable and heterogeneous and may even be decreased due to decreased proton density.
STIR and short TR/TE sequences have replaced the more time-consuming T2-weighted pulse sequences in most cases (Fig. 13.64). If spinal cord or thecal sac impingement is suspected, however, T2-weighted scans are useful, because increased signal in the cerebrospinal fluid improves the detection of sac compression. Although STIR sequences also result in bright cerebrospinal fluid, spatial resolution is not as good. Since the tumor is also of high signal intensity, it may be difficult to distinguish between the tumor and cerebrospinal fluid.
The following are the most useful protocols and findings in MR imaging of metastatic disease:
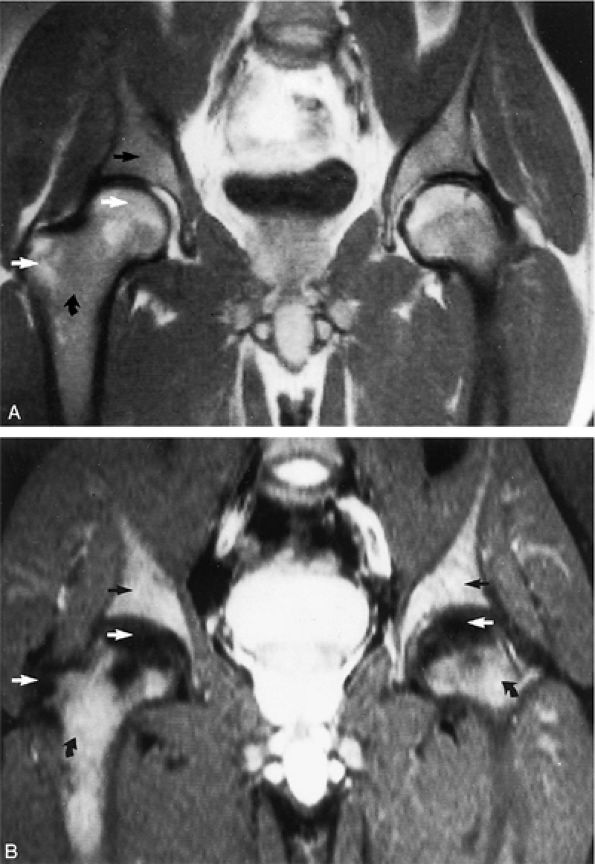
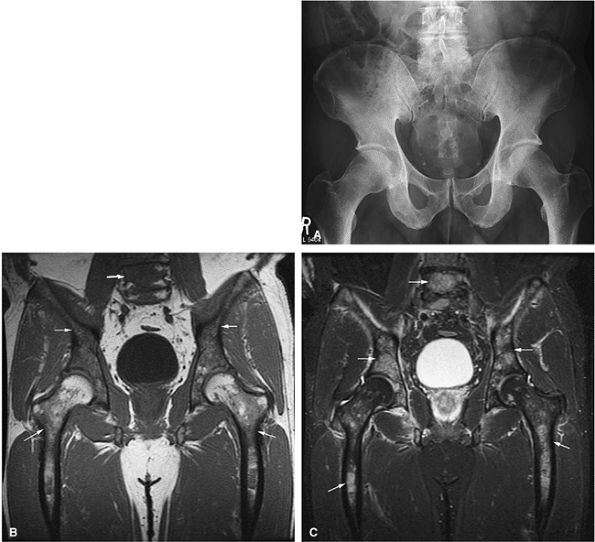
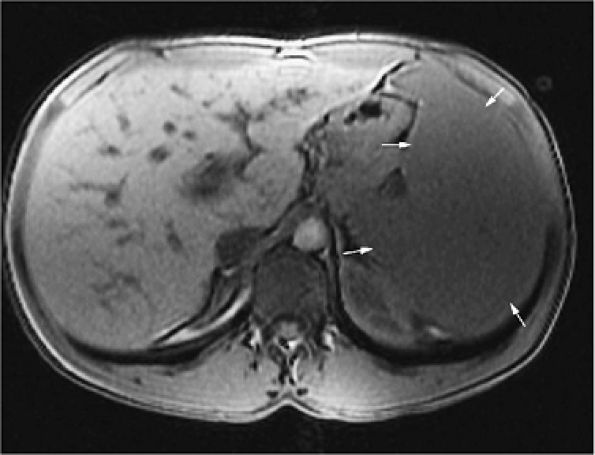
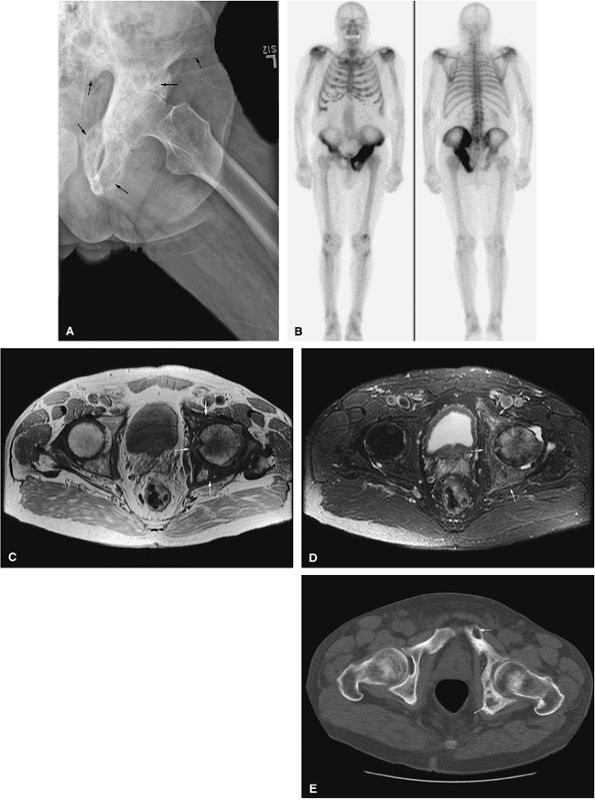
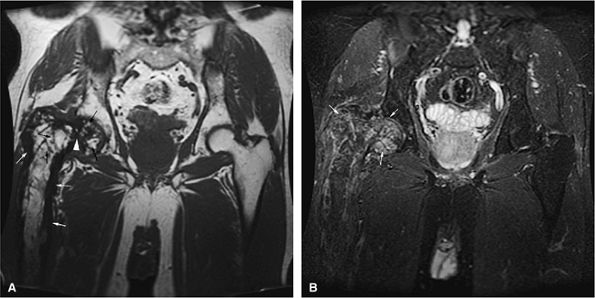
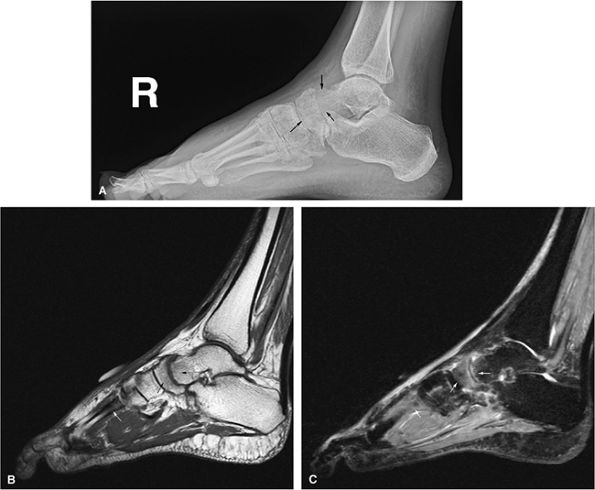
  • STIR scans are used to screen the axial skeleton for metastatic disease. If this sequence shows no focal areas of high signal intensity, the likelihood of microscopic marrow tumor involvement is low. Symptomatic individuals, however, occasionally have an inhomogeneous distribution of red marrow that may simulate metastatic disease, particularly in the proximal femurs. Osteomyelitis or infection may have to be excluded on clinical grounds (Fig. 13.65). Adenopathy or extension across the disk space indicates infection.
  • Metastatic disease has been successfully detected on MR T1-weighted and STIR images, even when bone scans are negative or equivocal.
  • P.2022


  • MR imaging provides an excellent means of assessing soft-tissue involvement and pathologic fractures (Fig. 13.66), and Gd-DTPA enhancement is useful in the assessment of epidural spread.
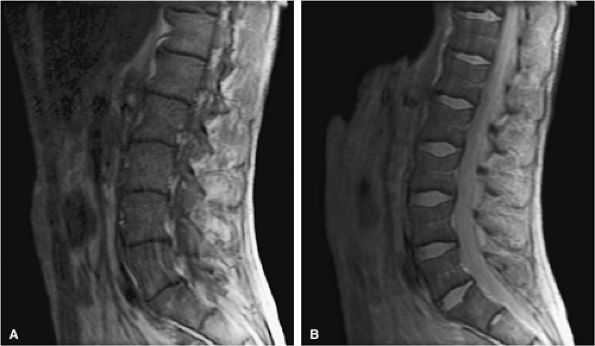
  • The morphology of the posterior vertebral body cortex should be evaluated for convexity, a sign associated with metastatic tumor extension. A chronic, benign compression fracture frequently demonstrates fat marrow signal intensity (i.e., bright on T1-weighted images, dark on STIR images). In more acute compression fractures, subchondral reaction often parallels the endplate without the more central or heterogeneous involvement seen in metastatic disease.
  • Disease progression and peritumoral reaction can be monitored on baseline or serial MR studies (Fig. 13.67).
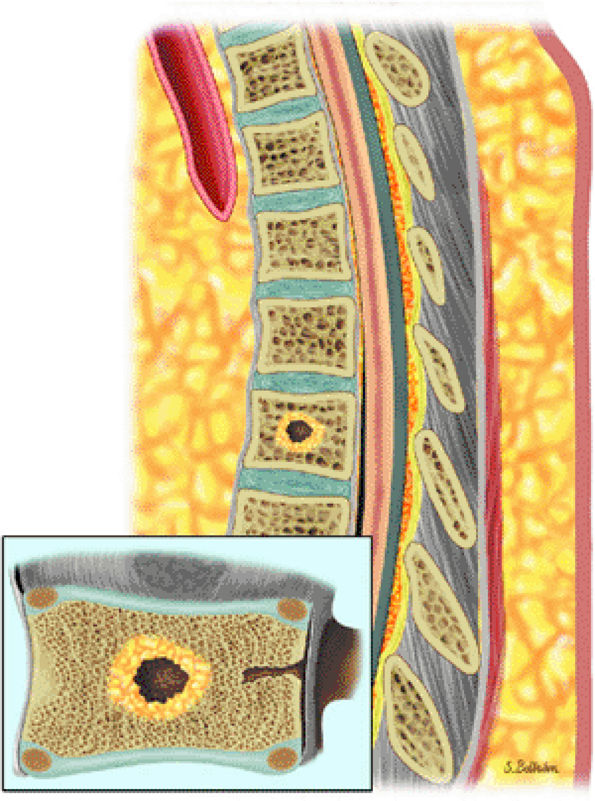
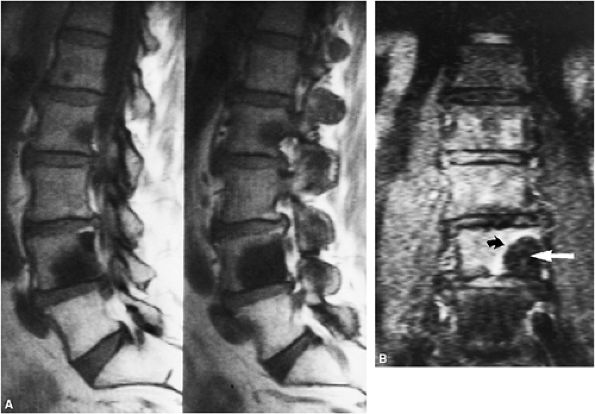
  • Schweitzer et al.115 have described the bull—s-eye sign (a focus of high signal intensity in the center of a lower-signal-intensity osseous marrow abnormality, seen on T1-weighted images) as a specific indicator of normal hematopoietic marrow and not metastatic disease.
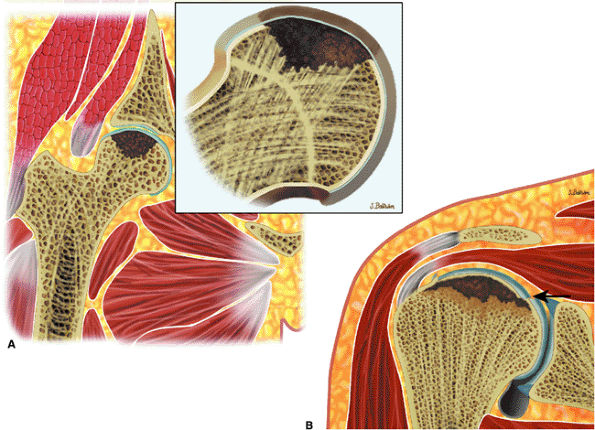
  • Both the halo sign (a peripheral rim of increased signal intensity around an osseous lesion seen on T2-weighted images) and diffuse signal hyperintensity on T2-weighted images have been found to correlate with metastatic

    P.2023


    P.2024


    disease (Fig. 13.68), whereas a rim of high-signal-intensity yellow marrow surrounding a focal marrow lesion on T1-weighted images is seen in treated lesions that have responded to therapy (Fig. 13.69). The halo sign, most commonly seen in osteoblastic metastases from prostate cancer, is thought to occur secondary to trabecular destruction with a resultant fluid-filled gap. Mucinous or cellular tissue could contribute to hyperintense signal intensity on T2-weighted sequences.

  • The term healing flare response has been used to describe treated skeletal metastases from breast cancer. Healing flare is characterized by increased radiotracer uptake and radiographic (including CT) demonstration of sclerotic changes in previously documented osteolytic or mixed skeletal metastases.116 MR imaging can also be used to demonstrate healing flare and interval sclerosis (Fig. 13.70). Healing flare in skeletal metastases does not correlate with survival rate (patients with stable metastases after hormonal treatment or chemotherapy live as long), and the increased uptake on bone scans may give the false appearance of more extensive metastasis. Therefore, in monitoring therapy to determine the success of treatment, it is important to correlate bone scans that show increased uptake with CT or MR imaging.
FIGURE 13.65 ● Osteomyelitis of the proximal femur (arrows). Focal marrow involvement of the proximal femoral metaphysis simulates metastatic disease on a coronal T1-weighted image (A) and a coronal STIR image (B).
FIGURE 13.66 ● Metastatic tumor of the thoracolumbar spine (white arrows) with multiple compression fractures (black arrows). Note the convexity of the posterior vertebral body cortex (white arrowhead), a sign of tumor involvement. Soft-tissue extension is visualized anteriorly (black arrowheads).
FIGURE 13.67 ● Metastatic lung carcinoma. Baseline study shows metastatic disease of the upper thoracic spine (arrows). (A) Metastases are hypointense on a sagittal T1-weighted image. (B) Enhancement following the administration of intravenous gadolinium is noted on a sagittal fat-suppressed T1-weighted image. (C) Metastatic tumor is hyperintense on the corresponding STIR image. Follow-up study demonstrates marked progression of metastatic disease (arrows). (D) Metastatic marrow infiltration is hypointense on a sagittal T1-weighted image. Pathologic compression fracture (white arrowhead) shows convex posterior vertebral body cortex. Mediastinal tumor infiltration (black arrowhead) is noted. (E) On a sagittal contrast-enhanced fat-suppressed T1-weighted image, there is enhancement of metastatic disease. (F) Metastases are hyperintense on a corresponding STIR image.
FIGURE 13.68 ● The halo sign is demonstrated on a sagittal graphic illustration. A peripheral rim of T2 hyperintensity surrounding a lesion indicates active metastatic disease.
FIGURE 13.69 ● Sagittal graphic illustration showing a peripheral rim of yellow marrow surrounding a metastatic lesion. High signal surrounding a metastatic lesion on T1-weighted images indicates response to therapy.
Lipid Storage Diseases
Gaucher Disease
Gaucher disease is a metabolic storage disorder caused by deficient activity of glucocerebrosidase, a lysosomal enzyme. There are three phenotypic forms of Gaucher disease. Type I, the common adult form, spares the central nervous system but progressively involves the osseous system and viscera. Types II and III are much rarer childhood forms that have neurologic manifestations. The progressive histiocytic proliferation secondary to accumulation of undegraded glycolipids results in displacement of normal hematopoietic cells in the marrow, eventually resulting in peripheral blood cytopenia. Bone erosion may result and precipitate fractures. Necrosis of bone marrow (i.e., osteonecrosis or avascular necrosis) is often associated with this disorder (Fig. 13.71).117
FIGURE 13.70 ● MR appearance of flare phenomenon. Two weeks after therapy, interval bone scans showed increased uptake (more than prior to surgery). (A) Sagittal T1-weighted images display hypointense osteoblastic metastases from a primary prostate carcinoma. (B) The corresponding coronal STIR image demonstrates a hypo-intense osteoblastic lesion (straight arrow) with a hyperintense rim (curved arrow) due to increased osteoblast activity and hyperemia.
FIGURE 13.71 ● Avascular necrosis in Gaucher disease. (A) Coronal graphic illustration of the hip shows a subchondral marrow abnormality (in brown) from osteonecrosis of the femoral head. (B) Coronal graphic illustration of the shoulder demonstrates osteonecrosis with a pathologic fracture (arrow) of the humeral head.
FIGURE 13.72 ● Marrow infiltration in Gaucher disease. (A) Sagittal T1-weighted image shows diffuse accumulation of glucocerebroside-laden cells, which demonstrate low signal intensity. (B) Decreased low-signal marrow infiltration is noted on the corresponding STIR image.

P.2025


P.2026


MR Appearance
Glucocerebroside-laden cells produce patchy, coarse, decreased signal intensity on T1- and T2-weighted images,93,117 which does not increase on STIR images (there is shortening of the T2 relaxation time in the glucocerebroside component of the Gaucher cell) (Fig. 13.72). Marrow changes in Gaucher disease have a predilection for the hematopoietic marrow stores in the axial skeleton, pelvis, and metaphyses of long bones (Fig. 13.73). When the appendicular skeleton is affected, the disease progresses from proximal to distal involvement. In extensive marrow disease, there is generalized distal involvement (Fig. 13.74). Preferential involvement of the distal femurs

P.2027


causes the characteristic Erlenmeyer flask deformity (Figs. 13.75 and 13.76). The mucopolysaccharidoses, which are an unrelated group of hereditary disorders characterized by dwarfism and a specific enzyme deficiency, demonstrate relative hyperintensity on STIR images.

FIGURE 13.73 ● Accumulation of lipid in reticuloendothelial cells in Gaucher disease. Patchy low-signal-intensity marrow infiltration (arrows) can be seen on a coronal T1-weighted image of the pelvis and proximal femurs (A) and on a coronal T1-weighted image of the knees (B). There may be relative sparing of the epiphyses and apophyses until later stages of disease.
FIGURE 13.74 ● Gaucher disease involving the appendicular skeleton. Low-signal marrow infiltration is noted on a coronal image of the femurs (A) and lower legs (B). Extension into the epiphysis and distal skeleton is characteristic of advanced disease.
Marrow infarction, a complication of Gaucher disease, is seen on T1-weighted images as sharply demarcated lesions of low signal intensity. The bright signal intensity described by Rosenthal et al. represents unaffected fatty marrow.93 STIR and fat-suppressed T2-weighted fast spin-echo images depict increased signal intensity in subacute and acute infarcts. With marrow fibrosis, decreased marrow signal intensity is seen on T1-weighted images with no increase in signal intensity on STIR sequences. Although red marrow signal characteristics may be seen in Gaucher disease, they are less noticeable than in other marrow infiltrative disorders such as lymphoma. Increased splenic volume and decreased spinal

P.2028


fat fractions correlate with the severity of the disease (Fig. 13.77).118 Displacement of normal marrow fat with Gaucher cells results in bulk T1 increases due to the higher T1 value of water compared with fat.119

FIGURE 13.75 ● Coronal graphic illustration shows characteristic Erlenmeyer flask deformity of the distal femur.
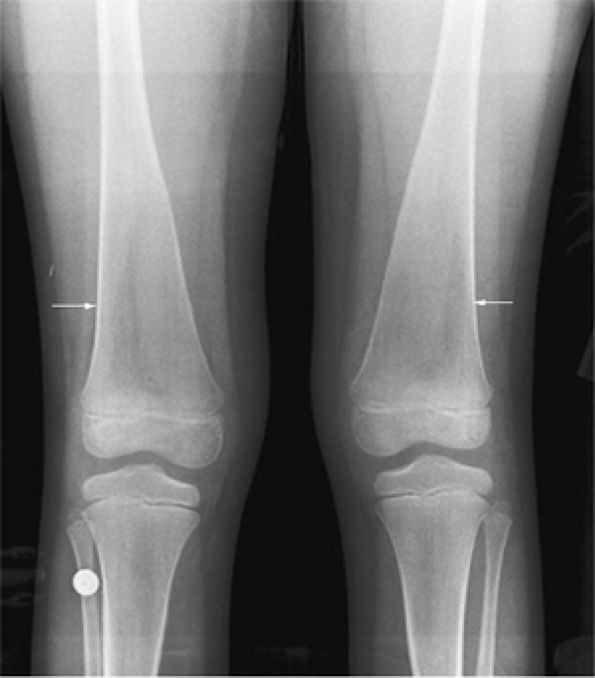
FIGURE 13.76 ● Undertubulation of the distal femurs causes characteristic Erlenmeyer flask deformity (arrows), as shown on an anteroposterior radiograph of the knees.
Avascular necrosis in patients with type I Gaucher disease has been correlated with liver size and marrow signal intensity changes (i.e., decreased signal intensity on T1-weighted images and increased signal intensity on T2-weighted sequences).120 Blooming or magnetic susceptibility in splenic nodules is thought to represent iron deposits. Symptomatic management of avascular necrosis (bed rest, analgesics, and non–weight-bearing of the involved extremity) is recommended during this stage of bone crisis.121
FIGURE 13.77 ● Splenomegaly (arrows) is shown on an axial T1-weighted image in a patient with Gaucher disease.
Iron Storage Assessment
To assess iron stores directly, it is usually necessary to sample one of the two iron-storing organs, the liver or the bone marrow. Marrow iron stores are normal or mildly increased in anemias caused by chronic disease and thalassemia minor, and in homozygous hemoglobinopathies such as sickle cell disease. Iron stores are greatly increased in chronic conditions requiring repeated blood transfusions, such as thalassemia major and myeloproliferative myelodysplastic syndrome, as well as in long-standing aplastic anemia. In hemochromatosis, intestinal iron absorption and deposition are increased. Errors of iron quantification are common due to the small amount of the biopsy sample and the chelation effect of the decalcified marrow biopsy specimen.122
Stored iron can also be assessed by evaluating urinary excretion of iron after the administration of a chelating agent, usually deferoxamine. This test is useful in detecting iron overload but is less accurate in assessment of iron deficiency states.123
Another method of estimating iron stores, an in vivo method based on the magnetic susceptibility of ferritin in hemosiderin, was studied in rats.124 MR imaging can also be used to assess iron stores. Iron stores of ferritin and hemosiderin cause decreased fatty marrow signal intensity on T1- and T2-weighted images (Fig. 13.78). As yet, there are no studies that correlate the amount of iron deposition with the degree of decrease in marrow signal intensity.
Bone Marrow Changes in Females, Athletes, and Smokers
FIGURE 13.78 ● Iron deposition in hemochromatosis demonstrates diffuse low signal intensity on a sagittal T1-weighted image. This simulates the appearance of a gradient-refocused or STIR sequence.

P.2029


As mentioned, signal intensity changes representing reconversion of fatty marrow to hematopoietic marrow can be depicted on T1-weighted and STIR images. During pregnancy, accelerated erythropoiesis, representing an actual increase of approximately 25% in the red cell mass, takes place, as does an increase in circulating erythropoietin in the last two trimesters. Human placental lactogen has been shown to stimulate erythropoiesis in the mouse. Additionally, deficiencies of iron during pregnancy may result in anemia, making the finding of marrow reconversion during pregnancy not surprising.125
A common observation in the mature skeleton of women is red marrow inhomogeneity in metaphyseal and diaphyseal sites. The cause has not been fully elucidated,126 but one theory implicates a latent iron-deficient state as the stimulus for marrow reconversion. In latent iron deficiency, the patient may be asymptomatic and blood hemoglobin levels may be normal. More sophisticated testing, however, shows elevated erythrocyte protoporphyrin levels and absence of stainable iron in the marrow.127 Delayed (i.e., incomplete) conversion of red to yellow marrow also produces inhomogeneity. Red marrow stores, of low signal intensity on T1-weighted images, demonstrate minimal hyperintensity on T2-weighted images and varying degrees of increased signal intensity on STIR images. Normal red marrow demonstrates T1 signal that is equal to or higher than that of adjacent muscle or disk (Fig. 13.79). Mild to moderate obesity

P.2030


in women is also associated with this pattern of marrow inhomogeneity.

FIGURE 13.79 ● Red-yellow marrow. (A) Normal low-signal-intensity metadiaphyseal red marrow (arrows) is seen on a sagittal T1-weighted image. The epiphyseal regions demonstrate uniform yellow marrow signal intensity. (B) The red marrow is hyperintense on the corresponding sagittal STIR image (arrows). This finding of marrow inhomogeneity is considered a normal variant.
FIGURE 13.80 ● Reconversion of yellow to red marrow due to increased demand for hematopoiesis. Yellow to red reconversion occurs in the reverse order as does conversion from red to yellow marrow.
Hematopoietic bone marrow hyperplasia has been identified in marathon runners and is thought to be a normal variant representing a response to sports-induced anemia.128 In this population, there is relative sparing of both the epiphysis (distal femur) and proximal tibia. Poulton et al. also found bone marrow reconversion in the knee in heavy smokers, younger adult patients, and obese women who are heavy smokers.129 This pattern of reconversion, also a normal variant, may involve the metaphysis of both the femur and tibia (Fig. 13.80).
Patients with anorexia nervosa, commonly accompanied by anemia and leukopenia, also develop marrow changes that have been studied in the spine, pelvis, and proximal femurs. Two histologic patterns of marrow change are seen:
  • Decreased marrow cellularity with an increase in fat
  • A reduction in both fat and hematopoietic cells with an increase in extracellular material rich in hyaluronic acid (serous atrophy). Serous atrophy is characterized by water-like signal intensity on MR images (i.e., decreased signal intensity on T1-weighted images and hyperintensity on T2-weighted images).130 Early fat conversion produces increased signal intensity on T1-weighted images.
Aplastic Anemia
In aplastic anemia, the marrow is extremely hypoplastic (i.e., yellow) and exhibits less than 30% residual hematopoietic elements microscopically. Aplastic anemia is believed to be caused by injury or failure of a common pluripotential stem cell affecting all hematopoietic cell lines. It sometimes presents as an acute disorder, or it may have a more prolonged chronic course, with signs and symptoms related to the pancytopenia.131
The etiology is unknown in approximately 50% of patients, in which case the anemia is diagnosed as idiopathic

P.2031


aplastic anemia. The remainder of cases are attributed to exposure to drugs, chemicals, toxins, radiation, and severe viral infections. Uncommonly, congenital disorders such as Fanconi anemia are accompanied by a genetic predisposition to aplastic anemia. Although a mild form of aplastic anemia may be successfully treated with marrow-stimulating drugs such as androgens, the mainstay of therapy is bone marrow transplantation.132 Iatrogenically induced aplastic marrows are encountered in the course of aggressive chemotherapy in the treatment of acute leukemia or in preparation for bone marrow transplantation. Radiotherapy may result in focal aplastic marrow.

MR Appearance
Aplastic marrow is characterized by increased signal intensity on T1-weighted images and intermediate signal intensity on T2-weighted images. These signal intensity changes are attributed to replacement of hematopoietic marrow by fatty marrow.45,133 On T1-weighted images, focal low-signal-intensity heterogeneity is seen during treatment for aplastic anemia. This heterogeneity may represent hematopoiesis recovery or fibrosis. Although MR imaging demonstrates primarily high-signal-intensity fatty marrow in aplastic anemia, islands of hematopoiesis may produce a patchy appearance of lower-signal-intensity areas surrounded by bright-signal-intensity fat on T1-weighted images (Fig. 13.81). Aplastic anemia may be difficult to discriminate from normal bone marrow in adult patients because of conversion to fatty marrow signal intensity. Diagnosis and monitoring of aplastic anemia may be improved with chemical-shift imaging techniques.
Hemoglobinopathies
Sickle Cell Anemia
Approximately 0.15% of black children in the United States are homozygous for hemoglobin S (HbS) and have full-blown sickle cell disease. This disorder is caused by substitution of valine for glutamic acid at the beta chain of hemoglobin.134
FIGURE 13.81 ● Aplastic anemia following therapy. Sagittal graphic illustration shows heterogeneous marrow with islands of hematopoiesis (in red).

P.2032


When oxygen tension is reduced, erythrocytes containing HbS become sickle-shaped. These rigid, nondeformable sickle cells cause occlusion of small vessels, and their abnormal shape subjects them to premature pitting by the spleen, resulting in accelerated red blood cell destruction (i.e., hemolytic anemia). These two features, small vessel occlusion and hemolytic anemia, account for the various clinical manifestations in sickle cell disease. Like other patients with congenital hemolytic anemia, sickle cell patients demonstrate radiographic abnormalities due to expansion of the red marrow (Fig. 13.82). Vascular occlusion leads to the development of bony infarctions. Patients with sickle cell disease are at increased risk of developing osteomyelitis, and it is important to distinguish acute bone marrow infarction from osteomyelitis.
MR Appearance
Sickle cell anemia is characterized by yellow to red marrow reconversion with low- to intermediate-signal-intensity hematopoietic marrow identified on T1-weighted images and hematopoietic or red marrow characteristics on STIR images. Marrow conversion can involve the diaphysis, metaphysis, and epiphysis.135,136 Patients with marrow ischemia may present with bone marrow infarction, which can be depicted on MR images (Fig. 13.83). Acute infarcts may demonstrate increased signal intensity on T2-weighted images. In the spine, ischemia to the central portion of the vertebral bodies leads to squared-off endplate depressions, the characteristic H vertebra (Figs. 13.84 and 13.85).
FIGURE 13.82 ● Sagittal graphic illustration shows expansion of the marrow spaces of the skull in sickle cell anemia.
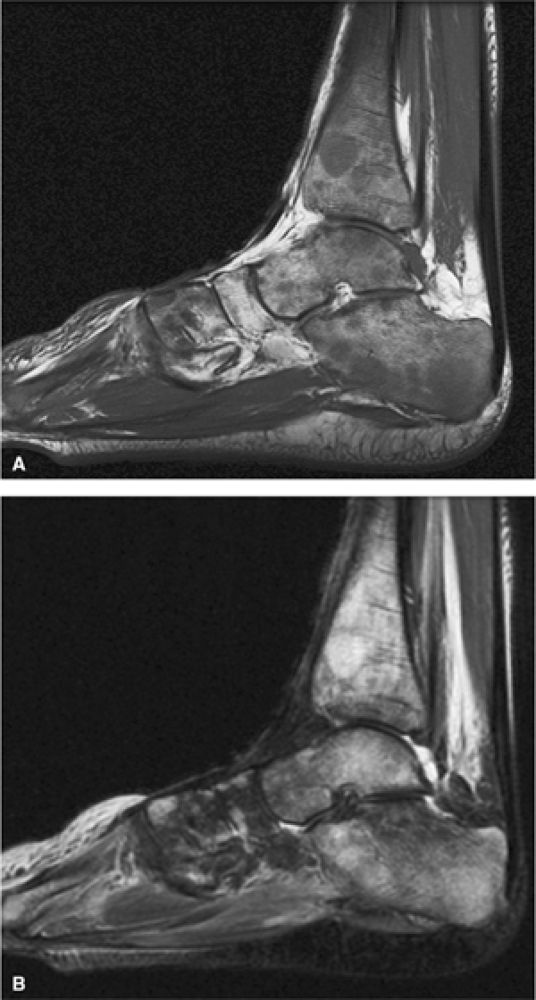
FIGURE 13.83 ● Bone marrow infarcts in a patient with sickle cell anemia. (A) On a coronal T1-weighted image through the posterior aspect of the knee, areas of osteonecrosis show low-signal serpentine lines (arrows). Fat signal intensity within the infarcted segment is demonstrated (arrowhead). (B) On a corresponding coronal STIR image, the serpentine lines are hyperintense (arrows) while the marrow within the area of osteonecrosis is dark, corresponding to fatty marrow (arrowhead).
FIGURE 13.84 ● H vertebrae in sickle cell anemia. Bone marrow ischemia of the central vertebral body leads to central squared-off endplate depressions (arrows).
FIGURE 13.85 ● (A) Diffuse low-signal hematopoietic marrow is noted throughout the lumbar spine on a sagittal T1-weighted image in a patient with sickle cell anemia. Bone marrow infarcts have led to endplate depression of multiple vertebral bodies (H vertebrae) (arrowheads). (B) On a fat-suppressed T2-weighted fast spin-echo image, endplate depression of the vertebral bodies is seen (arrowheads).

P.2033


P.2034


Thalassemia
The thalassemias are a diverse group of congenital disorders in which there is a defect in the synthesis of one or more of the subunits of hemoglobin. As a result of the decreased production of hemoglobin, red blood cells are microcytic and hypochromic. Thalassemias are quantitative abnormalities of synthesis of either the beta or alpha hemoglobin subunit. As a result of the imbalance in the subunit synthesis, patients exhibit varying degrees of ineffective erythropoiesis and hemolytic anemia leading to expansion of red marrow (Fig. 13.86). The severity of the resultant anemia is related to the number of the deficient subunit chains, which in turn is related to whether gene expression is homozygous, intermediate, or heterozygous.137
MR Appearance
As in sickle cell anemia, MR scans in thalassemia major demonstrate low to intermediate signal intensity within hematopoietic marrow, involving both fatty and red marrow stores (i.e., epiphyseal extension) (Fig. 13.87). In thalassemia minor, MR imaging demonstrates increased red marrow stores (Fig. 13.88) and delayed development of ossification centers.14
Miscellaneous Marrow Lesions
Paget—s Disease
Paget—s disease is characterized by initial uncontrolled osteoclastic activity (i.e., bone resorption), followed by vascular fibrous connective tissue production and finally osteoblastic activity (i.e., bone production). In the final stages, bone is composed of dense trabecular bone organized in a haphazard fashion, resulting in irregular, mosaic cement lines. The composition of this altered bone is disorganized, and although dense it is structurally weak and prone to fracture.
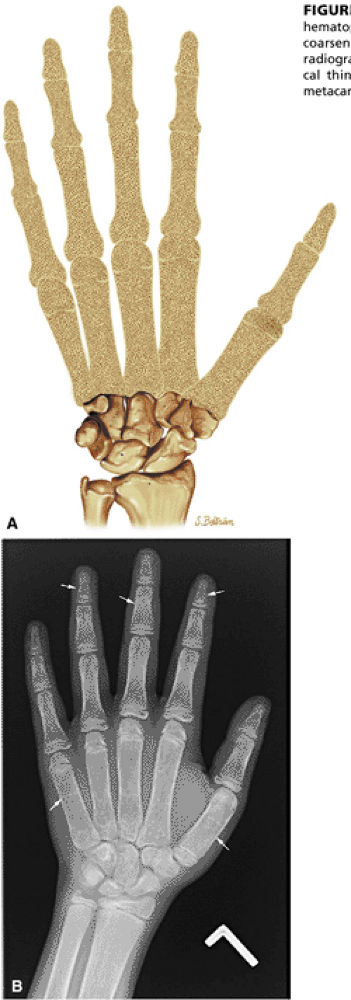
FIGURE 13.86 ● Expansion of marrow spaces due to increased demand in hematopoiesis. (A) Coronal graphic illustration shows expansion of marrow spaces with coarsened trabeculae and cortical thinning involving the digits. (B) Anteroposterior radiograph of the hand shows generalized osteopenia, coarsened trabeculae, and cortical thinning (arrows). Widening of the medullary cavity results in squaring of the metacarpals.
FIGURE 13.87 ● Thalassemia with coarsened trabeculae and expansion of marrow spaces extending to the epiphysis is demonstrated on a coronal graphic illustration of the shoulder.
FIGURE 13.88 ● Yellow to red marrow conversion in a patient with thalassemia shows low-signal-intensity hematopoietic marrow on a sagittal T1-weighted image.

P.2035


P.2036


Paget—s disease is most likely to affect individuals older than 40 years of age who are primarily of European extraction. Serum alkaline phosphatase levels are markedly increased in this disorder. Various electron microscopic studies have implicated viral agents related to measles or respiratory syncytial viruses as possible etiologic agents. This disorder may involve a limited portion of the skeleton or may be more generalized. Pelvic bones are most commonly involved, followed in incidence by the femur (Fig. 13.89), skull (Fig. 13.90), tibia, lumbosacral spine (Fig. 13.91), dorsal spine, clavicles (Fig. 13.92), and ribs. Secondary malignant sarcomatous transformation arises in preexisting Paget—s disease in less than 1% of cases.138
MR Appearance
In the lytic, mixed, and sclerotic presentations of Paget—s disease, a coarsened appearance of the marrow is identified on T1-weighted images.139 Although no increase in signal intensity is observed on T2-weighted images, bright signal intensity may be identified on STIR images (Figs. 13.93 and 13.94). The sclerotic pattern of Paget—s may resemble diffuse osteonecrosis with widespread low-signal-intensity marrow replacement on T1- and T2-weighted images. In long bones, Paget—s disease starts at one end of the bone and progresses along the shaft.
FIGURE 13.89 ● Paget—s disease of the femur. Coronal graphic illustration shows enlargement of the distal femur with cortical thickening and coarsened trabeculae (arrows).
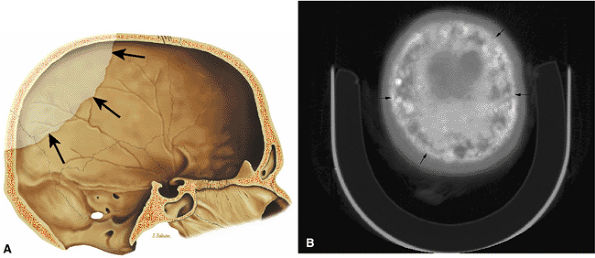
FIGURE 13.90 ● Paget—s disease of the skull. (A) Sagittal graphic illustration demonstrates an osteolytic lesion (arrows) involving the calvarium, consistent with osteoporosis circumscripta. (B) Axial CT image shows diploic widening and mixed lytic and sclerotic changes (cotton-wool appearance) (arrows) in the late stage of Paget—s disease.
FIGURE 13.91 ● Paget—s disease of the spine. Sagittal graphic illustration shows coarse trabecular pattern (arrows) and expansion of a thoracic vertebral body (arrowhead).
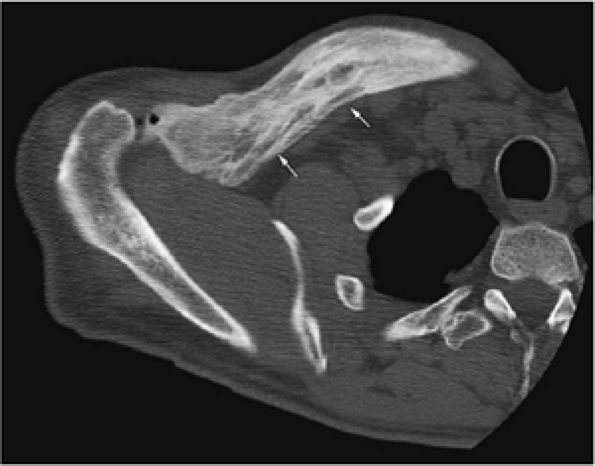
FIGURE 13.92 ● Paget—s disease of the clavicle. Axial CT image shows enlargement of the clavicle with increased sclerosis and cortical thickening (arrows).
FIGURE 13.93 ● Paget—s disease of the left hemipelvis (arrows). (A) Anteroposterior radiograph shows coarsened trabecular pattern involving the left hemipelvis (arrows). (B) Markedly increased radiotracer uptake of the left hemipelvis is seen on the whole-body bone scan. (C) On an axial proton density-weighted image, low-signal coarse trabecular bone intermixed with high-signal-intensity yellow marrow is noted (arrows). (D) Marrow involvement is hyperintense on an axial STIR image (arrows). (E) Axial CT image shows a coarsened trabecular pattern with osteolytic lesions involving the left hemipelvis (arrows).
FIGURE 13.94 ● (A) Coronal T1-weighted image shows trabecular thickening in Paget—s disease as areas of low signal intensity (black arrows) intermixed with high-signal-intensity yellow marrow, creating an inhomogeneous appearance in the proximal femur. Cortical thickening is present (white arrows). Weakened bone has led to a pathologic fracture of the femoral neck (white arrowhead). (B) Marrow involvement is hyperintense on the corresponding coronal STIR image (arrows).

P.2037


P.2038


P.2039


Localized Osteoporosis
Reflex sympathetic dystrophy, or Sudeck atrophy, is a painful neurovascular disorder.140 Dystrophic soft-tissue changes, swelling, distal extremity predilection, and periarticular as well as diffuse osteoporosis are characteristic. Reflex dystrophy syndrome is mediated by the sympathetic nervous system and may be initiated by minimal trauma or fracture. T1-weighted and STIR images are sensitive in identifying hyperemic marrow. Periarticular low-signal-intensity regions are displayed on T1-weighted images, whereas corresponding STIR images demonstrate a diffusely hyperintense signal intensity (Fig. 13.95).
Transient regional osteoporosis is a self-limited condition characterized by localized osteoporosis and pain. The etiology is unknown. The joint space and articular cartilage are preserved, in contrast to septic arthritis. Transient regional osteoporosis is subdivided into regional migratory osteoporosis and transient osteoporosis of the hip. Regional migratory osteoporosis involves the joints of the lower extremity (the knee, ankle, and foot), is most likely to occur in middle-aged patients, and is symptomatic for 6 months to 1 year. Unlike reflex sympathetic dystrophy, there is frequent clinical recurrence in other joints. Transient osteoporosis of the hip typically affects middle-aged men, although it was initially described in women in the third trimester of pregnancy. Either hip may be involved, with a self-limited course of demineralization and pain.
MR Appearance
On T1-weighted images, femoral head and neck hyperemia demonstrates low signal intensity on T1-weighted images and increased signal intensity on T2-weighted and STIR images (Fig. 13.96). The acetabulum is not usually involved, although joint effusions are common. Since early avascular necrosis may present with similar MR findings (in fact, transient osteoporosis of the hip may represent an early reversible stage of avascular necrosis), an osteonecrotic focus should be excluded on follow-up examination.
FIGURE 13.95 ● Reflex sympathetic dystrophy (Sudeck atrophy). (A) Lateral radiograph shows demineralization of the talus and navicula (arrows). (B) Sagittal T1-weighted sagittal image shows subtle subarticular low-signal-intensity marrow of the talus and navicula (black arrows). Low-signal-intensity marrow of a metatarsal is also seen (white arrow). (C) Corresponding sagittal STIR image shows marrow edema (arrows) with hyperintense signal intensity.
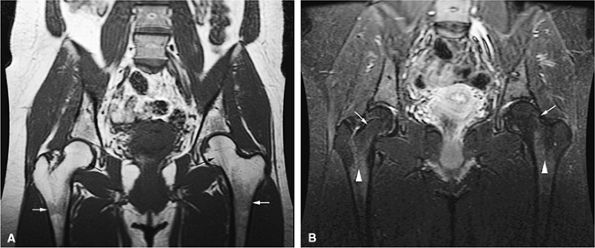
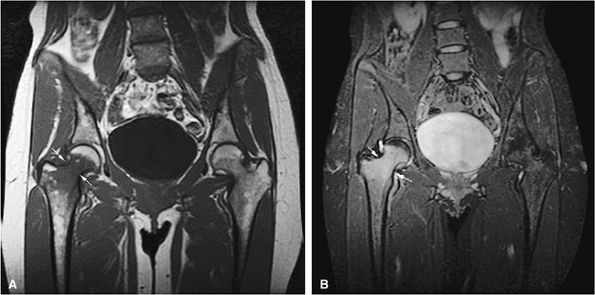
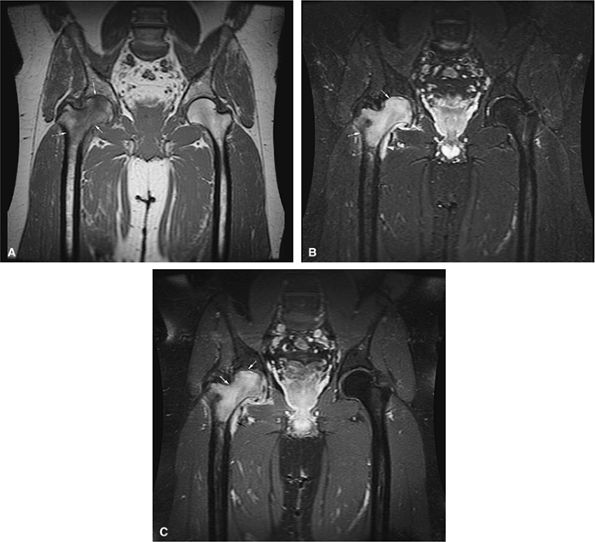
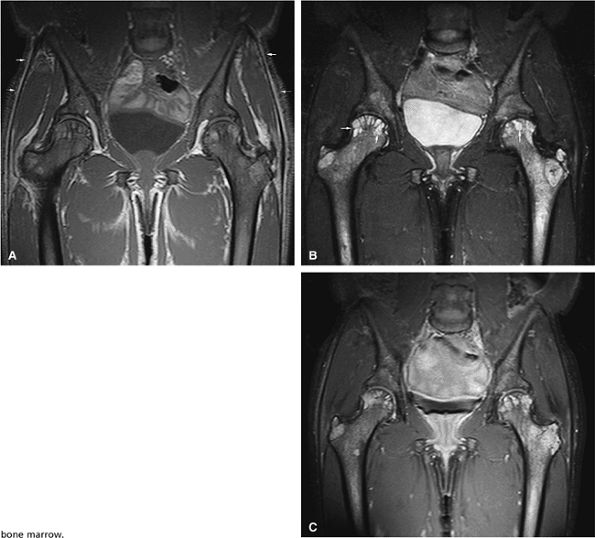
FIGURE 13.96 ● Transient osteoporosis of the hip. (A) Coronal T1-weighted image shows low signal intensity in the right femoral head and neck (arrows) without an osteonecrotic focus. (B) On the corresponding coronal STIR image, there is increased signal intensity in the right femoral head and neck (arrows). A small joint effusion is present (arrowhead). The acetabulum is normal in signal intensity. (C) Coronal fat-suppressed T1-weighted image following the intravenous administration of gadolinium shows diffuse enhancement of the femoral head and neck (white arrows) and the joint effusion (black arrow).

P.2040


P.2041


P.2042


Acquired Immunodeficiency Syndrome
Patients with AIDS exhibit a multitude of disorders that may be reflected in various bone marrow changes.141 Infectious disorders, particularly disseminated Mycobacterium, Cryptococcus, or Histoplasma infections, may extensively involve the marrow. Histopathologically, discrete granulomas are not typically formed in immunodeficient patients; instead, the causative organisms are detected within histiocytic aggregates and sheets. A diffuse histiocytic proliferation related to viral infection (virus-associated hemophagocytic syndrome) has been observed in patients with AIDS.
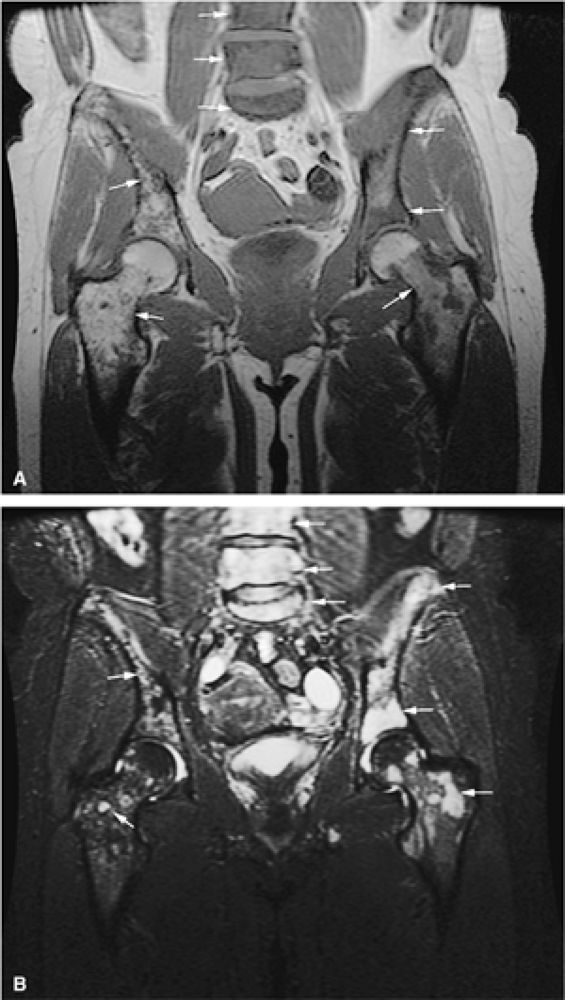
FIGURE 13.97 ● Lipodystrophy in an AIDS patient receiving antiviral therapy. (A) Diffuse low-signal marrow of the pelvis due to reduced bone marrow fat is shown on a coronal T1-weighted image. Note the lack of subcutaneous fat (arrows), a common finding in patients with AIDS-related lipodystrophy. (B) On a coronal STIR image, the abnormal marrow is hyperintense. Note the subchondral cysts from osteoarthritis (arrows). (C) Coronal fat-suppressed T1-weighted image following the intravenous administration of gadolinium shows diffuse enhancement of the bone marrow.
High-grade lymphomas are frequently observed in AIDS patients and may involve the bone marrow in a patchy or diffuse manner. Occasionally, lymphoma presents as extensive marrow necrosis associated with severe bone pain.
Patients with lipodystrophy due to antiviral therapy may show reduced bone marrow fat, often associated with reduced bone marrow density. Bone marrow fat content can be assessed with MR spectroscopy sequences.142,143 Abnormal marrow signal, low on T1- and high on T2-weighted sequences, can be detected with MR imaging (Fig. 13.97).
Some nonspecific changes reported in the bone marrow of AIDS patients include serous atrophy of fat with hypocellular marrow and accumulation of hyaluronic acid, hypocellularity, and decreased storage iron.144,145

P.2043


References
1. Bredella MA, Steinbach L, Caputo G, et al. Value of FDG PET in the assessment of patients with multiple myeloma. AJR Am J Roentgenol 2005;184(4):1199-204.
2. Daldrup-Link HE, Franzius C, Link TM, et al. Whole-body MR imaging for detection of bone metastases in children and young adults: comparison with skeletal scintigraphy and FDG PET. AJR Am J Roentgenol 2001;177(1):229-36.
3. Dooms GC, Fisher MR, Hricak H, et al. Bone marrow imaging: magnetic resonance studies related to age and sex. Radiology 1985;155(2):429-32.
4. Kricun ME. Red-yellow marrow conversion: its effect on the location of some solitary bone lesions. Skeletal Radiol 1985;14(1):10-9.
5. Moore SG, Dawson KL. Red and yellow marrow in the femur: age-related changes in appearance at MR imaging. Radiology 1990;175(1):219-23.
6. Vogler JB 3rd, Murphy WA. Bone marrow imaging. Radiology 1988;168(3):679-93.
7. Quesenberry P, Levitt L. Hematopoietic stem cells. N Engl J Med 1979; 301(14):755-61.
8. Weiss L. Histopathology of the bone marrow. Regulation of hematopoiesis 1970.[[//is more detail needed for reference 8?///]]]
9. Ogawa M, Porter PN, Nakahata T. Renewal and commitment to differentiation of hemopoietic stem cells (an interpretive review). Blood 1983;61(5):823-9.
10. Custer RP, Ahlfeldt FE. Studies on the structure and function of the bone marrow. J Lab Clin Med 1932;17:960.
11. De Bruyn PP, Breen PC, Thomas TB. The microcirculation of the bone marrow. Anat Rec 1970;168(1):55-68.
12. Piney A. The anatomy of the bone marrow. Br Med J 1922;2:792.
13. Maniatus A, Vavassoli M, Crosby WH. Factors affecting the conversion of yellow to red marrow. Blood 1971;37:581.
14. Moore SG, Sebag GH. Primary disorders of bone marrow. In: Cohen MD, Edwards MK, eds. Magnetic resonance imaging of children. Philadelphia: Decker; 1990:765.
15. Wehrli FW, MacFall JR, Shutts D, et al. Mechanisms of contrast in NMR imaging. J Comput Assist Tomogr 1984;8(3):369-80.
16. Mitchell DG, Burk DL Jr, Vinitski S, Rifkin MD. The biophysical basis of tissue contrast in extracranial MR imaging. AJR Am J Roentgenol 1987;149(4):831-7.
17. Mirowitz SA, Apicella P, Reinus WR, Hammerman AM. MR imaging of bone marrow lesions: relative conspicuousness on T1-weighted, fat-suppressed T2-weighted, and STIR images. AJR Am J Roentgenol 1994;162(1):215-21.
18. Olson DO, Shields AF, Scheurich CJ, et al. Magnetic resonance imaging of the bone marrow in patients with leukemia, aplastic anemia, and lymphoma. Invest Radiol 1986;21(7):540-6.
19. Waitches G, Zawin JK, Poznanski AK. Sequence and rate of bone marrow conversion in the femora of children as seen on MR imaging: are accepted standards accurate? AJR Am J Roentgenol 1994;162(6):1399-406.
20. Zawin JK, Jaramillo D. Conversion of bone marrow in the humerus, sternum, and clavicle: changes with age on MR images. Radiology 1993;188(1):159-64.
21. Dawson KL, Moore SG, Rowland JM. Age-related marrow changes in the pelvis: MR and anatomic findings. Radiology 1992;183(1):47-51.
22. Duda SH, Laniado M, Schick F, et al. Normal bone marrow in the sacrum of young adults: differences between the sexes seen on chemical-shift MR imaging. AJR Am J Roentgenol 1995;164(4):935-40.
23. Mirowitz SA. Hematopoietic bone marrow within the proximal humeral epiphysis in normal adults: investigation with MR imaging. Radiology 1993;188(3):689-93.
24. Custer RP. Studies on the structure and function of the bone marrow. I. Variability of the hemopoietic pattern and consideration of method for examination. J Lab Clin Med 1932;17:951.
25. Arndt WF 3rd, Truax AL, Barnett FM, et al. MR diagnosis of bone contusions of the knee: comparison of coronal T2-weighted fast spin-echo with fat saturation and fast spin-echo STIR images with conventional STIR images. AJR Am J Roentgenol 1996;166(1):119-24.
26. Sebag GH, Moore SG. Effect of trabecular bone on the appearance of marrow in gradient-echo imaging of the appendicular skeleton. Radiology 1990;174(3 Pt 1): 855-9.
27. Brateman L. Chemical shift imaging. AJR Am J Roentgenol 1987;146:971.
28. Goo HW, Choi SH, Ghim T, et al. Whole-body MRI of paediatric malignant tumours: comparison with conventional oncological imaging methods. Pediatr Radiol 2005;35(8):766-73.
29. Herborn CU, Unkel C, Vogt FM, et al. Whole-body MRI for staging patients with head and neck squamous cell carcinoma. Acta Otolaryngol 2005;125(11):1224-9.
30. Schmidt GP, Schoenberg SO, Reiser MF, Baur-Melnyk A. Whole-body MR imaging of bone marrow. Eur J Radiol 2005;55(1):33-40.
31. Steinborn MM, Heuck AF, Tiling R, et al. Whole-body bone marrow MRI in patients with metastatic disease to the skeletal system. J Comput Assist Tomogr 1999;23(1):123-9.
32. Eustace S, Tello R, DeCarvalho V, et al. A comparison of whole-body turboSTIR MR imaging and planar 99mTc-methylene diphosphonate scintigraphy in the examination of patients with suspected skeletal metastases. AJR Am J Roentgenol 1997;169(6):1655-61.
33. Ballon D, Watts R, Dyke JP, et al. Imaging therapeutic response in human bone marrow using rapid whole-body MRI. Magn Reson Med 2004;52(6):1234-8.
34. Engelhard K, Hollenbach HP, Wohlfart K, et al. Comparison of whole-body MRI with automatic moving table technique and bone scintigraphy for screening for bone metastases in patients with breast cancer. Eur Radiol 2004;14(1):99-105.
35. Lauenstein TC, Freudenberg LS, Goehde SC, et al. Whole-body MRI using a rolling table platform for the detection of bone metastases. Eur Radiol 2002; 12(8):2091-9.
36. O—Connell MJ, Hargaden G, Powell T, Eustace SJ. Whole-body turbo short tau inversion recovery MR imaging using a moving tabletop. AJR Am J Roentgenol 2002;179(4):866-8.
37. Eustace SJ, Nelson E. Whole body magnetic resonance imaging. Br Med J 2004;328(7453):1387-8.
38. Foon KA, Cascianto DA. Acute leukemia. In: Casciato DA, Lowitz BB, eds. Manual of clinical oncology, 2nd ed. Boston: Little, Brown; 1990:386.
39. Foon KA, Todd RF 3rd. Immunologic classification of leukemia and lymphoma. Blood 1986;68(1):1-31.
40. Moore SG, Gooding CA, Brasch RC, et al. Bone marrow in children with acute lymphocytic leukemia: MR relaxation times. Radiology 1986;160(1):237-40.
41. Rosen BR, Fleming DM, Kushner DC, et al. Hematologic bone marrow disorders: quantitative chemical shift MR imaging. Radiology 1988;169(3):799-804.
42. Sugimura K, Yamasaki K, Kitagaki H, et al. Bone marrow diseases of the spine: differentiation with T1 and T2 relaxation times in MR imaging. Radiology 1987;165(2):541-4.
43. Thomsen C, Sorensen PG, Karle H, et al. Prolonged bone marrow T1-relaxation in acute leukaemia. In vivo tissue characterization by magnetic resonance imaging. Magn Reson Imaging 1987;5(4):251-7.
44. Jensen KE, Thomsen C, Henriksen O, et al. Changes in T1 relaxation processes in the bone marrow following treatment in children with acute lymphoblastic leukemia. A magnetic resonance imaging study. Pediatr Radiol 1990;20(6):464-8.
45. McKinstry CS, Steiner RE, Young AT, et al. Bone marrow in leukemia and aplastic anemia: MR imaging before, during, and after treatment. Radiology 1987;162(3):701-7.
46. Islam A, Catovsky D, Galton DA. Histological study of bone marrow regeneration following chemotherapy for acute myeloid leukemia and chronic granulocytic leukemia in blast transformation. Br Med J 1980;45:535.
47. Wittels B. Bone marrow biopsy changes following chemotherapy for acute leukemia. Am J Surg Pathol 1980;4(2):135-42.
48. Gerard EL, Ferry JA, Amrein PC, et al. Compositional changes in vertebral bone marrow during treatment for acute leukemia: assessment with quantitative chemical shift imaging. Radiology 1992;183(1):39-46.
49. Vande Berg BC, Schmitz PJ, Scheiff JM, et al. Acute myeloid leukemia: lack of predictive value of sequential quantitative MR imaging during treatment. Radiology 1995;197(1):301-5.
50. Foon KA, Cascianto DA. Chronic leukemias. In: Cascianto DA, Lowitz BB, eds. Manual of clinical oncology, 2nd ed. Boston: Little, Brown; 1990:360.
51. Adamson JW, Fialkow PJ. The pathogenesis of myeloproliferative syndromes. Br J Haematol 1978;38(3):299-303.
52. Wiernik PH. The chronic leukemias. In: Kelley WN, ed. Textbook of internal medicine. Philadelphia: JB Lippincott; 1989.
53. Deisseroth AL, Wallerstein RO. Bone marrow failure. In: Kelley WN, ed. Textbook of internal medicine. Philadelphia: JB Lippincott; 1989.
54. Moore MAS. Pathogenesis in myelofibrosis. In: Hoffman AV, ed. Recent advances in hematology. Edinburgh: Churchill Livingstone; 1982:1932.
55. Nosas-Garcia S, Moehler T, Wasser K, et al. Dynamic contrast-enhanced MRI for assessing the disease activity of multiple myeloma: a comparative study with histology and clinical markers. J Magn Reson Imaging 2005;22(1):154-62.
56. Baur-Melnyk A, Buhmann S, Durr HR, Reiser M. Role of MRI for the diagnosis and prognosis of multiple myeloma. Eur J Radiol 2005;55(1):56-63.
57. Ahmad MN, Uddin N, Muzaffar S, et al. Extradural extramedullary hematopoiesis: a rare MRI diagnosis with atypical features. J Pak Med Assoc 2004;54(4):221-3.
58. Horwood E, Dowson H, Gupta R, et al. Myelofibrosis presenting as spinal cord compression. J Clin Pathol 2003;56(2):154-6.
59. Diamond T, Smith A, Schnier R, Manoharan A. Syndrome of myelofibrosis and osteosclerosis: a series of case reports and review of the literature. Bone 2002;30(3):498-501.
60. Burke JS. The value of the bone-marrow biopsy in the diagnosis of hairy cell leukemia. Am J Clin Pathol 1978;70(6):876-84.
61. Golomb HM. Hairy cell leukemia. In: Williams WJ, ed. Hematology. New York: McGraw-Hill; 1983:999.
62. Thompson JA, Shields AF, Porter BA, et al. Magnetic resonance imaging of bone marrow in hairy cell leukemia: correlation with clinical response to alpha-interferon. Leukemia 1987;1(4):315-6.
63. Fletcher BD, Wall JE, Hanna SL. Effect of hematopoietic growth factors on MR images of bone marrow in children undergoing chemotherapy. Radiology 1993;189(3):745-51.
64. Ryan SP, Weinberger E, White KS, et al. MR imaging of bone marrow in children with osteosarcoma: effect of granulocyte colony-stimulating factor. AJR Am J Roentgenol 1995;165(4):915-20.
65. Jakubowski AA, Souza L, Kelly F, et al. Effects of human granulocyte colony-stimulating factor in a patient with idiopathic neutropenia. N Engl J Med 1989; 320(1):38-42.
66. Morstyn G, Campbell L, Souza LM, et al. Effect of granulocyte colony stimulating factor on neutropenia induced by cytotoxic chemotherapy. Lancet 1988;1(8587):667-72.
67. Hartman RP, Sundaram M, Okuno SH, Sim FH. Effect of granulocyte-stimulating factors on marrow of adult patients with musculoskeletal malignancies: incidence and MRI findings. AJR Am J Roentgenol 2004;183(3):645-53.
68. Gale RP, Champlin RE. Bone marrow transplantation in acute leukaemia. Clin Haematol 1986;15(3):851-72.
69. Nadler BW. Malignanat. In: Harrison TR, ed. Principles of internal medicine, 12th ed. New York: McGraw-Hill; 1991:1608.
70. Chao NJ, Blume KG. Bone marrow transplantation. Part II: autologous. West J Med 1990;152(1):46-51.
71. O—Reilly RJ. Allogenic bone marrow transplantation: current status and future directions. Blood 1983;62(5):941-64.

P.2044


72. Horowitz MM, Gale RP, Sondel PM, et al. Graft-versus-leukemia reactions after bone marrow transplantation. Blood 1990;75(3):555-62.
73. Stevens SK, Moore SG, Amylon MD. Repopulation of marrow after transplantation: MR imaging with pathologic correlation. Radiology 1990;175(1):213-8.
74. Fletcher BD, Crom DB, Krance RA, Kun LE. Radiation-induced bone abnormalities after bone marrow transplantation for childhood leukemia. Radiology 1994; 191(1):231-5.
75. Gianelli U, Patriarca C, Moro A, et al. Lymphomas of the bone: a pathological and clinical study of 54 cases. Int J Surg Pathol 2002;10(4):257-66.
76. Heyning FH, Hogendoorn PC, Kramer MH, et al. Primary non-Hodgkin—s lymphoma of bone: a clinicopathological investigation of 60 cases. Leukemia 1999;13(12):2094-8.
77. McKenna RW, Hernandez JA. Bone marrow in malignant lymphoma. Hematol Oncol Clin North Am 1988;2(4):617-35.
78. O—Carroll DI, McKenna RW, Brunning RD. Bone marrow manifestations of Hodgkin—s disease. Cancer 1976;38(4):1717-28.
79. Coller BS, Chabner BA, Gralnick HR. Frequencies and patterns of bone marrow involvement in non-Hodgkin lymphomas: observations on the value of bilateral biopsies. Am J Hematol 1977;3:105-19.
80. Linden A, Zankovich R, Theissen P, et al. Malignant lymphoma: bone marrow imaging versus biopsy. Radiology 1989;173(2):335-9.
81. Shields AF, Porter BA, Churchley S, et al. The detection of bone marrow involvement by lymphoma using magnetic resonance imaging. J Clin Oncol 1987;5(2):225-30.
82. Richards MA, Webb JA, Jewell SE, et al. Low field strength magnetic resonance imaging of bone marrow in patients with malignant lymphoma. Br J Cancer 1988;57(4):412-5.
83. Gossmann A, Eich HT, Engert A, et al. CT and MR imaging in Hodgkin—s disease: present and future. Eur J Haematol Suppl 2005(66):83-9.
84. Mengiardi B, Honegger H, Hodler J, et al. Primary lymphoma of bone: MRI and CT characteristics during and after successful treatment. AJR Am J Roentgenol 2005;184(1):185-92.
85. Brennan DD, Gleeson T, Coate LE, et al. A comparison of whole-body MRI and CT for the staging of lymphoma. AJR Am J Roentgenol 2005;185(3):711-6.
86. Gaa J, Rummeny EJ, Seemann MD. Whole-body imaging with PET/MRI. Eur J Med Res 2004;9(6):309-12.
87. Iizuka-Mikami M, Nagai K, Yoshida K, et al. Detection of bone marrow and extramedullary involvement in patients with non-Hodgkin—s lymphoma by whole-body MRI: comparison with bone and 67Ga scintigraphies. Eur Radiol 2004;14(6):1074-81.
88. Rahmouni A, Luciani A, Itti E. MRI and PET in monitoring response in lymphoma. Cancer Imaging 2005;5 Suppl:S106-12.
89. Casamassima F, Ruggiero C, Caramella D, et al. Hematopoietic bone marrow recovery after radiation therapy: MRI evaluation. Blood 1989;73(6):1677-81.
90. Stevens SK, Moore SG, Kaplan ID. Early and late bone-marrow changes after irradiation: MR evaluation. AJR Am J Roentgenol 1990;154(4):745-50.
91. Kauczor HU, Dieti B, Brix G, et al. Fatty replacement of bone marrow after radiation therapy for Hodgkin disease: quantification with chemical shift imaging. J Magn Reson Imaging 1993;3(4):575-80.
92. Blomlie V, Rofstad EK, Skjonsberg A, et al. Female pelvic bone marrow: serial MR imaging before, during, and after radiation therapy. Radiology 1995;194(2):537-43.
93. Rosenthal DI, Scott JA, Barranger J, et al. Evaluation of Gaucher disease using magnetic resonance imaging. J Bone Joint Surg [Am] 1986;68(6):802-8.
94. Bernstrand C, Bjork O, Ahstrom L, Henter JI. Intralesional steroids in Langerhans cell histiocytosis of bone. Acta Paediatr 1996;85(4):502-4.
95. Putters TF, de Visscher JG, van Veen A, Spijkervet FK. Intralesional infiltration of corticosteroids in the treatment of localised Langerhans cell histiocytosis of the mandible: report of known cases and three new cases. Int J Oral Maxillofac Surg 2005;34(5):571-5.
96. Yasko AW, Fanning CV, Ayala AG, et al. Percutaneous techniques for the diagnosis and treatment of localized Langerhans-cell histiocytosis (eosinophilic granuloma of bone). J Bone Joint Surg [Am] 1998;80(2):219-28.
97. Murra JM. In: Histiocytoses in bone tumors: clinical, radiologic and pathologic correlations. Philadelphia: Lea & Febiger; 1989:1021.
98. Bergsagel DE. Plasma cell myeloma. In: Williams WJ, ed. Hematology. New York: McGraw-Hill; 1983:1078.
99. Mundy GR. Evidence for the accretion of an osteoclast stimulating factor in myeloma. N Engl J Med 1976;291:1041.
100. Goldman AB. Multiple myeloma. In: Tavera SJM, Ferucci JT, eds. Radiology diagnosis, imaging, intervention. Philadelphia: JB Lippincott; 1994.
101. Resnick D, Greenway GD, Bardwick PA, et al. Plasma-cell dyscrasia with polyneuropathy, organomegaly, endocrinopathy, M-protein, and skin changes: the POEMS syndrome. Distinctive radiographic abnormalities. Radiology 1981;140(1):17-22.
102. Durie BG, Bataille R. Therapeutic implications of myeloma staging. Eur J Haematol Suppl 1989;51:111-6.
103. Durie BG, Salmon S. Therapeutic strategies in multiple myeloma. Bull Cancer 1980;67(4):450-7.
104. Durie BG, Salmon SE. A clinical staging system for multiple myeloma. Correlation of measured myeloma cell mass with presenting clinical features, response to treatment, and survival. Cancer 1975;36(3):842-54.
105. Lecouvet FE, Malghem J, Michaux L, et al. Skeletal survey in advanced multiple myeloma: radiographic versus MR imaging survey. Br J Haematol 1999;106(1):35-9.
106. Durie BG, Waxman AD, D—Agnolo A, Williams CM. Whole-body (18)F-FDG PET identifies high-risk myeloma. J Nucl Med 2002;43(11):1457-63.
107. Moulopoulos LA, Varma DG, Dimopoulos MA, et al. Multiple myeloma: spinal MR imaging in patients with untreated newly diagnosed disease. Radiology 1992;185(3):833-40.
108. Rahmouni A, Divine M, Mathieu D, et al. Detection of multiple myeloma involving the spine: efficacy of fat-suppression and contrast-enhanced MR imaging. AJR Am J Roentgenol 1993;160(5):1049-52.
109. Antoch G, Vogt FM, Freudenberg LS, et al. Whole-body dual-modality PET/CT and whole-body MRI for tumor staging in oncology. JAMA 2003;290(24):3199-206.
110. Libshitz HI, Malthouse SR, Cunningham D, et al. Multiple myeloma: appearance at MR imaging. Radiology 1992;182(3):833-7.
111. Moulopoulos LA, Dimopoulos MA, Alexanian R, et al. Multiple myeloma: MR patterns of response to treatment. Radiology 1994;193(2):441-6.
112. Rahmouni A, Divine M, Mathieu D, et al. MR appearance of multiple myeloma of the spine before and after treatment. AJR Am J Roentgenol 1993;160(5):1053-7.
113. Jaffe HL. In: Tumors and tumorous conditions of the bones and joints. Philadelphia: Lea & Febiger; 1961:589.
114. Anner RM, Drewinko B. Frequency and significance of bone marrow involvement by metastatic solid tumors. Cancer 1977;39(3):1337-44.
115. Schweitzer ME, Levine C, Mitchell DG, et al. Bull—s-eyes and halos: useful MR discriminators of osseous metastases. Radiology 1993;188(1):249-52.
116. Janicek MJ, Hayes DF, Kaplan WD. Healing flare in skeletal metastases from breast cancer. Radiology 1994;192(1):201-4.
117. Lanir A, Hadar H, Cohen I, et al. Gaucher disease: assessment with MR imaging. Radiology 1986;161(1):239-44.
118. Rosenthal DI, Barton NW, McKusick KA, et al. Quantitative imaging of Gaucher disease. Radiology 1992;185(3):841-5.
119. Johnson LA, Hoppel BE, Gerard EL, et al. Quantitative chemical shift imaging of vertebral bone marrow in patients with Gaucher disease. Radiology 1992; 182(2):451-5.
120. Terk MR, Esplin J, Lee K, et al. MR imaging of patients with type 1 Gaucher—s disease: relationship between bone and visceral changes. AJR Am J Roentgenol 1995;165(3):599-604.
121. Katz K, Horev G, Grunebaum M, Yosipovitch Z. The natural history of osteonecrosis of the femoral head in children and adolescents who have Gaucher disease. J Bone Joint Surg [Am] 1996;78(1):14-9.
122. Fong TP, Okafor LA, Thomas W Jr, Westerman MP. Stainable iron in aspirated and needle-biopsy specimens of marrow: a source of error. Am J Hematol 1977;2(1):47-51.
123. Harker LA, Funk DD, Finch CA. Evaluation of storage iron by chelates. Am J Med 1968;45(1):105-15.
124. Bauman JH, Harris JW. Estimation of hepatic iron stores by vivo measurement of magnetic susceptibility. J Lab Clin Med 1967;70(2):246-57.
125. Jepson JH. Erthropoietin in plasma of pregnant mice and rates. Com J Physiol Pharmacol 1968;45:573.
126. Deutsch AL, Mink JH, Rosenfelt FP, Waxman AD. Incidental detection of hematopoietic hyperplasia on routine knee MR imaging. AJR Am J Roentgenol 1989;152(2):333-6.
127. Wintrobe M. Iron deficient and iron deficiency anemia. In: Wintrobe M, ed. Clinical hematology. Phildelphia: Lea & Febiger; 1981:618.
128. Shellock FG, Morris E, Deutsch AL, et al. Hematopoietic bone marrow hyperplasia: high prevalence on MR images of the knee in asymptomatic marathon runners. AJR Am J Roentgenol 1992;158(2):335-8.
129. Poulton TB, Murphy WD, Duerk JL, et al. Bone marrow reconversion in adults who are smokers: MR Imaging findings. AJR Am J Roentgenol 1993;161(6):1217-21.
130. Vande Berg BC, Malghem J, Devuyst O, et al. Anorexia nervosa: correlation between MR appearance of bone marrow and severity of disease. Radiology 1994; 193(3):859-64.
131. Gale RP, Champlin RE, Feig SA, Fitchen JH. Aplastic anemia: biology and treatment. Ann Intern Med 1981;95(4):477-94.
132. Camitta BM, Storb R, Thomas ED. Aplastic anemia (first of two parts): pathogenesis, diagnosis, treatment, and prognosis. N Engl J Med 1982;306(11):645-52.
133. Kaplan PA, Asleson RJ, Klassen LW, Duggan MJ. Bone marrow patterns in aplastic anemia: observations with 1.5-T MR imaging. Radiology 1987;164(2):441-4.
134. Benz ED. The hemoglobinopathies. In: Kelley WN, ed. Textbook of internal medicine. Philadelphia: JB Lippincott; 1989:1423.
135. Sebes JI. Diagnostic imaging of bone and joint abnormalities associated with sickle cell hemoglobinopathies. AJR Am J Roentgenol 1989;152(6):1153-9.
136. van Zanten TE, Statius van Eps LW, Golding RP, Valk J. Imaging the bone marrow with magnetic resonance during a crisis and in chronic forms of sickle cell disease. Clin Radiol 1989;40(5):486-9.
137. Henry J. In: Clinical diagnosis and management. Philadelphia: WB Saunders; 1984:679.
138. Cotran RS, Robbins SL. The musculoskeletal system. In: Pathologic basis of disease. Philadelphia: WB Saunders; 1989:1328.
139. Roberts MC, Kressel HY, Fallon MD, et al. Paget disease: MR imaging findings. Radiology 1989;173(2):341-5.
140. Malkin LH. Reflex sympathetic dystrophy syndrome following trauma to the foot. Orthopedics 1990;13(8):851-8.
141. Steinbach LS, Tehranzadeh J, Fleckenstein JL, et al. Human immunodeficiency virus infection: musculoskeletal manifestations. Radiology 1993;186(3):833-8.
142. Huang JS, Mulkern RV, Grinspoon S. Reduced intravertebral bone marrow fat in HIV-infected men. AIDS 2002;16(9):1265-9.
143. Huang JS, Rietschel P, Hadigan CM, et al. Increased abdominal visceral fat is associated with reduced bone density in HIV-infected men with lipodystrophy. AIDS 2001;15(8):975-82.
144. Osborne BM, Guarda LA, Butler JJ. Bone marrow biopsies in patients with the acquired immunodeficiency syndrome. Hum Pathol 1984;15(11):1048-53.
145. Seaman JP, Kjeldsberg CR, Linker A. Gelatinous transformation of the bone marrow. Hum Pathol 1978;9(6):685-92.


This website uses cookies to improve your experience. We'll assume you're ok with this, but you can opt-out if you wish. Accept Read More