
Editors: Berquist, Thomas H.
Title: Musculoskeletal Imaging Companion, 2nd Edition
Copyright ©2007 Lippincott Williams & Wilkins
> Table of Contents > Chapter 6 – Foot, Ankle, and Calf
Chapter 6
Foot, Ankle, and Calf
Thomas H. Berquist
P.309
Protocols
Key Facts
-
Routine radiographs
-
Ankle: anteroposterior (AP), lateral, mortise view
-
Foot: standing AP, standing lateral,
oblique (Certain patients may not be able to stand. In this case,
non–weight-bearing views are obtained.)
Other Options Indication AP, varus, valgus stress views Ligament injuries Fluoroscopic spot views To align bones and reduce overlap Sesamoid views Osteonecrosis or fracture -
-
Computed tomography (CT)
-
Bone and soft tissue settings
-
512 × 512 matrix
-
Field of view 14 to 20 cm (depends on area and both ankles and/or feet done for comparison)
-
Slice thickness 4 to 5 mm for routine,
1-mm sections at 0.5-mm intervals for reformatting in different planes,
or three-dimensional reconstruction
-
-
Magnetic resonance imaging (MRI)
-
Patient positioning: Supine with foot in
neutral position for most ankle studies including the Achilles tendon.
Slight plantar flexion (20 degrees) for the other ankle tendons. Prone
to reduce motion for forefoot studies. -
Coil selection: Extremity coil for foot
and ankle. Three- or five-inch flat coil for forefoot. Head coil for
comparison studies. Dual circular coils for motion studies. -
Additional parameters are summarized in Table 6-1.
-
P.310
Suggested Reading
Berquist TH. MRI of the musculoskeletal system, 5th ed. Philadelphia: Lippincott Williams & Wilkins; 2006:430–556.
Farooki
A, Sakoloff RM, Theudorou DJ, et al. Visualization of ankle tendons and
ligaments with MR imaging. Influence of positioning. Foot Ankle 2002;23:554–559.
A, Sakoloff RM, Theudorou DJ, et al. Visualization of ankle tendons and
ligaments with MR imaging. Influence of positioning. Foot Ankle 2002;23:554–559.
P.311
Fractures/Dislocations: Ankle Fractures—Pediatric
Key Facts
-
Image features of ankle fractures depend
on age (growth plate development), relationship of ligaments to
epiphyses, and mechanism of injury. -
Metaphyseal and diaphyseal fractures frequently are incomplete.
-
Fractures of the distal tibia and fibula frequently involve the growth plate.
-
Fracture of the distal tibial physis is the second most common growth plate injury.
-
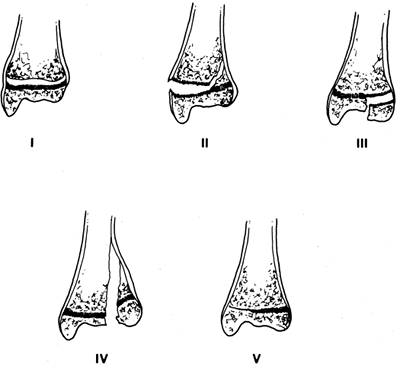
The Salter-Harris classification frequently is used for growth plate fractures:
-
Type I Separation of epiphysis, fracture confined to growth plate (6%)
-
Type II Fracture through growth plate extending into the metaphysis (75%)
-
Type III Fracture through growth plate extending through epiphysis (8%)
-
Type IV Extends from articular surface of epiphysis through growth plate and metaphysis (10%)
-
Type V Compression of growth plate (1%)
-
Complications are more significant with Types III to V.
-
 |
|
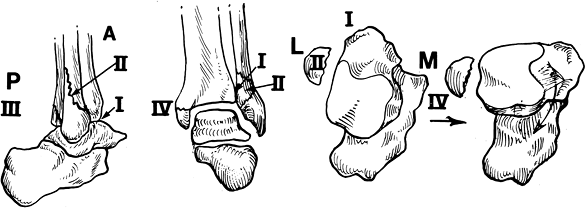
FIGURE 6-1 The five Salter-Harris fracture patterns.
|
P.312
 |
|
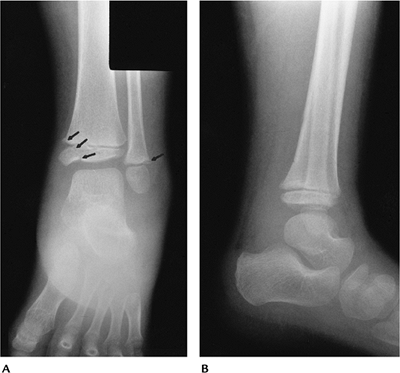
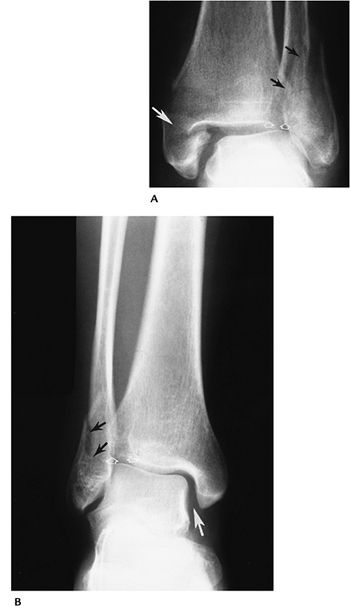
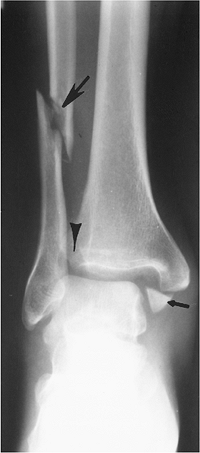
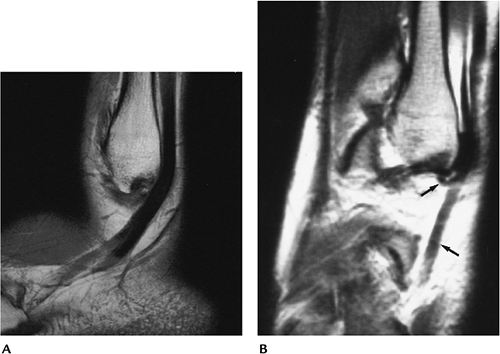
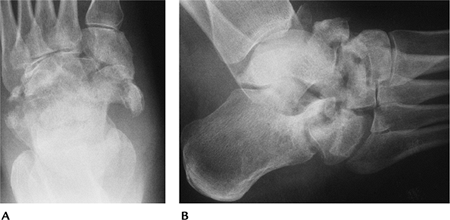
FIGURE 6-2 AP (A) and lateral (B) radiographs demonstrating marked swelling with a Salter-Harris Type IV (arrows) tibial fracture and Type II fibular fracture (arrow) as the result of an inversion injury.
|
P.313
 |
|
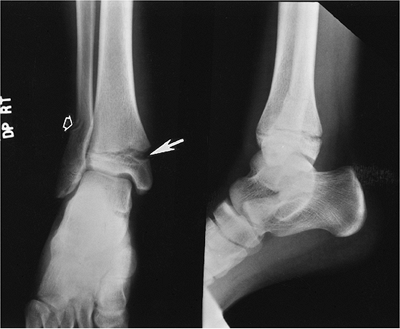
FIGURE 6-3 AP (A) and lateral (B) radiographs of an eversion injury with opening of the tibial physis (arrow) and an incomplete fibular fracture (open arrow).
|
Suggested Reading
Rogers LF. Radiology of epiphyseal injuries. Radiology 1970;96:289–299.
P.314
Fractures/Dislocations: Ankle Fractures—Pediatric: Triplane Fracture
Key Facts
-
Triplane fractures are the result of external rotation forces and account for 6% of physeal fractures.
-
The fracture consists of three fragments instead of two seen with most growth plate fractures.
-
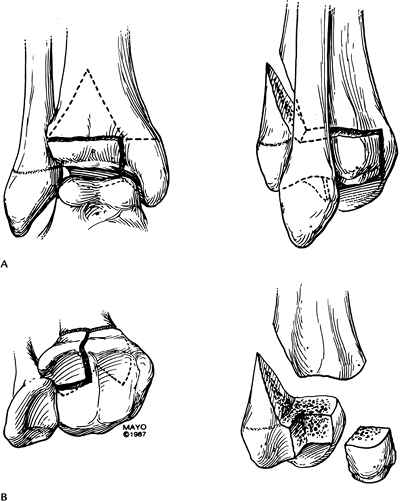
Fracture fragments include (1) anterior
lateral tibial epiphysis (Salter-Harris III); (2) remainder of the
tibial epiphysis with metaphyseal attachment (looks like Salter-Harris
II); and (3) tibial metaphysis. -
Complication rates are similar to those for a Salter-Harris Type IV fracture.
-
CT may be required to properly characterize the injury.
P.315
 |
|
FIGURE 6-4 Triplane fracture seen from the front and side (A) and from the articular surface and with fragments separated (B).
|
P.316
P.317
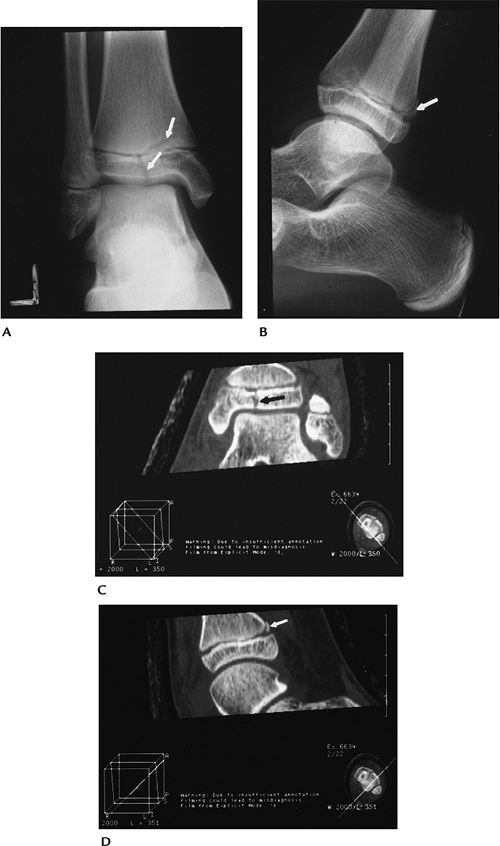 |
|
FIGURE 6-5 AP (A) and lateral (B) radiographs demonstrate a triplane fracture (arrows). Coronal (C) and sagittal (D) reformatted CT images define the fractures (arrow) and degree of displacement.
|
Suggested Reading
Cone RO III, Nguyen V, Flournoyr JG, et al. Triplane fracture of the distal tibial epiphysis. Radiologic and CT studies. Radiology 1984;153:763–767.
P.318
Fractures/Dislocations: Ankle Fractures—Pediatric: Juvenile Tillaux
Key Facts
-
Distal tibial epiphysis fuses from medial to lateral, placing the lateral physis at risk in adolescents.
-
Distal tibial physis fuses at approximately age 15 years in females and age 17 years in males.
-
Juvenile Tillaux fracture is a Salter-Harris Type III fracture of the lateral tibial physis.
-
The fracture is displaced by the distal tibio-fibular ligament when the foot is externally rotated.
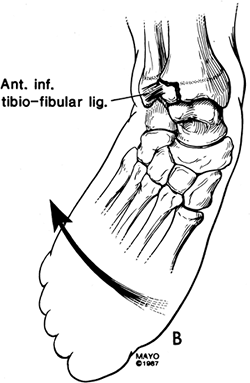 |
|
FIGURE 6-6 Mechanism of injury for juvenile Tillaux fractures.
|
P.319
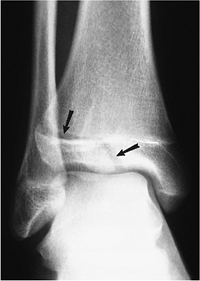 |
|
FIGURE 6-7 AP radiograph shows a Salter-Harris III fracture—juvenile Tillaux fracture (arrows).
|
Suggested Reading
Mann
DC, Rajmaira S. Distribution of physeal and nonphyseal fractures in
2,650 long bone fractures in children aged 10 to 16 years. J Pediatr Orthop 1990;10:713–716.
DC, Rajmaira S. Distribution of physeal and nonphyseal fractures in
2,650 long bone fractures in children aged 10 to 16 years. J Pediatr Orthop 1990;10:713–716.
P.320
Fractures/Dislocations: Ankle Fractures—Pediatric Complications
Key Facts
-
Fractures not involving the growth plate generally heal without sequelae.
-
Growth plate fractures may heal with premature or asymmetric closure. Complications vary with Salter-Harris fracture type.
-
Low risk (6.7% complications): Types I
and II fibular fractures; Types I, III, and IV tibial fractures with
less than 2 mm of displacement -
High risk (32% complications): Types III
and IV tibial fractures with more than 2 mm of displacement; juvenile
Tillaux fractures, triplane fractures, comminuted epiphyseal fractures,
and Type V fractures -
Complications include leg length discrepancy, rotational deformity, malunion, nonunion, and avascular necrosis.
-
Routine radiographs usually are adequate to define complications. CT or MRI may be required to assess growth plate involvement.
P.321
 |
|
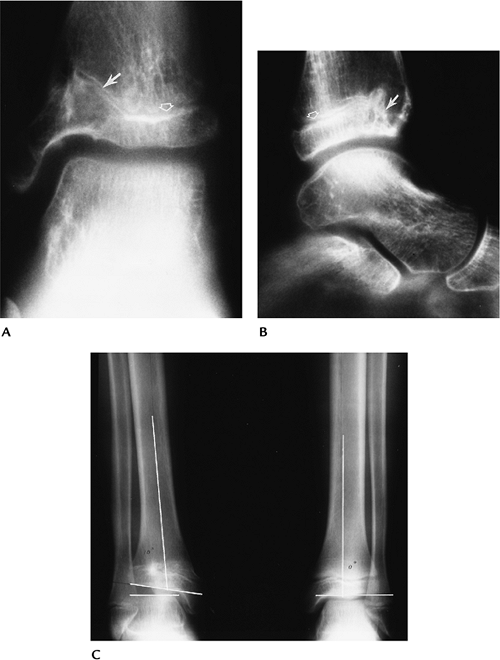
FIGURE 6-8 Prior Salter-Harris IV fracture of the distal tibia. AP (A) and lateral (B) radiographs demonstrate premature closure and angular deformity of the anteromedial growth plate (arrow). The physis remains open laterally and posteriorly (open arrow). Standing radiographs (C)
in a different patient with an old physeal fracture on the right and leg length discrepancy and angular deformity of the articular surface (lines). |
Suggested Reading
Spiegel PG, Cooperman DR, Laros GS. Epiphyseal fractures of the distal ends of the tibia and fibula. J Bone Joint Surg 1978;60A:1046–1050.
P.322
Fractures/Dislocations: Ankle Fractures—Adult
Key Facts
-
The mechanism of injury for ankle
fractures is rarely pure inversion (supination) or eversion
(pronation). Abduction, adduction, lateral rotation, and axial loading
forces usually are associated. -
Fracture patterns, specifically the
location and appearance of the fibular fracture and talar shift in the
ankle mortise, can allow definition of the mechanism of injury and
ligament involvement in more than 90% of cases. -
AP, lateral, and mortise views usually are adequate for diagnosis.
-
The lateral view is particularly useful
to define joint effusions. An effusion should raise the question of
subtle osteochondral injury, which may require CT or MRI for further
evaluation.
P.323
 |
|
FIGURE 6-9 (A) Joint effusion (arrow) seen on the lateral radiograph. Coronal T2- (B) and sagittal fat-suppressed T2- (C) weighted images demonstrate a large effusion (open arrows) with a lateral talar dome fracture (arrow).
|
Suggested Reading
Arimoto HR, Forrester DM. Classification of ankle fractures. An algorithm. AJR Am J Roentgenol 1980;135:1057–1063.
P.324
Fractures/Dislocations: Ankle Adult—Supination-Adduction Injuries
Key Facts
-
Supination-adduction injuries (inversion)
cause traction laterally, resulting in ligament injury or a transverse
lateral malleolar fracture below the ankle joint (Stage I). When force
continues, a medial impaction (steep oblique) fracture of the medial
malleolus occurs (Stage II) (Fig. 6-10). -
Supination-adduction injuries account for approximately 20% of ankle fractures.
-
Treatment is conservative unless fragments are displaced more than 2 mm.
 |
|
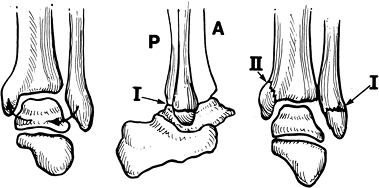
FIGURE 6-10
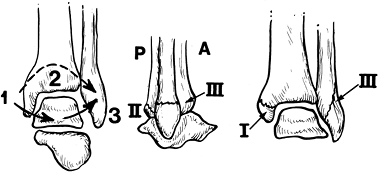
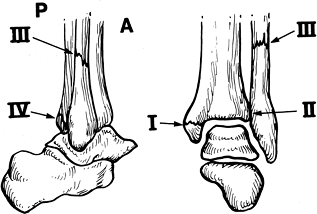
Inversion (supination)-adduction injury. The forces cause a transverse fracture below the joint line (Stage I) or ligament tear. With continued stress a steep oblique fracture of the medial malleolus occurs (Stage II). |
P.325
 |
|
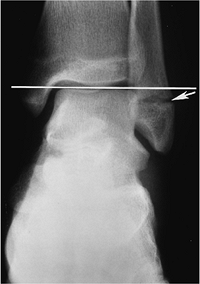
FIGURE 6-11 Supination-adduction injury with a transverse fracture of the lateral malleolus (arrow) below the level of the ankle joint (line).
|
 |
|
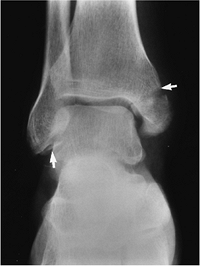
FIGURE 6-12 Supination-adduction Stage II injury with an oblique fracture (arrow) of the medial malleolus and avulsed fragments from the lateral malleolus (arrow).
|
Suggested Reading
Lauge-Hansen N. Fractures of the ankle. II. Combined experimental-surgical once experimental roentgenologic investigations. Arch Surg 1950;60:957–985.
P.326
Fractures/Dislocations: Ankle Adult—Supination Lateral Rotation Injuries
Key Facts
-
Supination lateral rotation injuries
cause medial tension, with the talus causing posterior displacement of
the lateral malleolus. -
The anterior distal tibiofibular ligament
is injured (Stage I). If force continues, a spiral fracture of the
lateral malleolus occurs just above the joint (best seen on the lateral
view). This Stage II injury is the most common ankle fracture. With
continued force, a posterior tibial fracture or distal tibiofibular
ligament tear occurs (Stage III), and eventually a transverse medial
malleolar or medial (deltoid) ligament injury occurs (Stage IV) (Fig. 6-13). -
Supination lateral rotation injuries account for 55% to 58% of ankle fractures.
-
All supination or inversion injuries account for 75% to 78% of ankle fractures.
-
Treatment is conservative if displacement is 2 mm or less.
 |
|
FIGURE 6-13
Supination-lateral rotation injuries. The talus causes posterior fibular displacement with disruption of the anterior distal tibiofibular ligament (Stage I). If force continues a spiral fracture of the fibula occurs just above the joint line (best seen on the lateral view) (Stage II). Continued force results in a posterior tibial fracture or tear in the posterior distal tibiofibular ligament (Stage III) and finally a transverse medial malleolar fracture or deltoid ligament tear (Stage IV). |
P.327
 |
|
FIGURE 6-14 Supination-lateral rotation Stage II injury. AP (A), mortise (B), and lateral (C) radiographs. The fracture is only clearly demonstrated on the lateral (C) view (arrows).
|
Suggested Reading
Berquist TH. Radiology of the foot and ankle, 2nd ed. Philadelphia: Lippincott Williams & Wilkins; 2000:171–280.
P.328
Fractures/Dislocations: Ankle Adult—Pronation-Abduction Injuries
Key Facts
-
Pronation-abduction (eversion) injuries
result from medial tension leading to deltoid ligament injury or a
transverse medial malleolar fracture (Stage I). Continued force results
in tears of the anterior and posterior distal tibiofibular ligaments or
a posterior tibial fracture (Stage II) followed by an oblique lateral
malleolar fracture near the joint level (best seen on AP view) (Stage
III) (Fig. 6-15). -
When displaced, internal fixation is necessary to reduce the ankle mortise.
 |
|
FIGURE 6-15
Pronation (eversion)-abduction injuries. Medial tension causes a transverse malleolar fracture or deltoid ligament tear (Stage I). Continued force results in disruption of the distal anterior and posterior tibiofibular ligaments or a posterior tibial fracture (Stage II) followed by an oblique fibular fracture near the joint line best seen on the AP radiograph (Stage III). |
P.329
 |
|
FIGURE 6-16 Pronation-abduction Stage III injuries. (A) There is a transverse medial malleolar fracture (white arrow), tibiofibular ligament tears with separation of the tibia and fibula (open arrows), and an oblique fibular fracture (black arrows). (B) Widening of the medial ankle mortise (white arrow) caused by a ligament tear with increased tibiofibular distance (open arrows) and oblique fibular fracture (black arrows).
|
Suggested Reading
Arimoto HR, Forrester DM. Classification of ankle fractures: An algorithm. AJR Am J Roentgenol 1980;135:1057–1063.
P.330
Fractures/Dislocations: Ankle Adult—Pronation Lateral Rotation Injuries
Key Facts
-
Pronation lateral rotation injuries cause medial tension as the talus rotates laterally.
-
The medical malleolus (low transverse
fracture) or medial ligaments are injured initially (Stage I). As force
continues, the anterior tibiofibular and interosseous membranes are
torn (Stage II), followed by a high fibular fracture (more than 5 to 6
cm above the joint) (Stage III). Posterior tibial avulsion or distal
tibiofibular ligament tears occur with continued force (Stage IV) (Fig. 6-17). -
Pronation injuries account for 22% to 25% of ankle fractures.
-
Treatment of these fractures usually
requires internal fixation of the fibular fracture and screw fixation
of the medial malleolus.
 |
|
FIGURE 6-17
Pronation-lateral rotation injuries. Medial tension results in a low transverse medial malleolar fracture or deltoid ligament tear (Stage I), followed by tearing of the distal anterior tibiofibular ligament and interosseous membrane (Stage II). With continued force a high (>6 cm) fibular fracture occurs (Stage III) followed by a posterior distal tibiofibular ligament tear or avulsion fracture (Stage IV). |
P.331
 |
|
FIGURE 6-18 Pronation lateral rotation Stage IV injury with a transverse medial malleolar fracture (small arrow), disruption of the tibiofibular and interosseous ligaments (arrowhead), and a high fibular fracture (large arrow).
|
Suggested Reading
Arimoto HR, Forrester DM. Classification of ankle fractures: An algorithm. AJR Am J Roentgenol 1980;135:1057–1063.
P.332
Fractures/Dislocations: Ankle Adult—Plafond Fractures (Pilon)
Key Facts
-
Plafond fractures do not fit neatly into
other fracture classifications. Tibial plafond fractures account for
less than 10% of lower extremity fractures. -
Fractures are the result of axial loading; 72% occur in patients less than 50 years of age.
-
Up to 20% of plafond fractures are open, resulting in increased incidence of infection.
-
Treatment of these fractures is difficult, because the articular surface needs to be anatomically reduced.
-
CT and MRI may be required to clearly demonstrate the extent of injury for surgical treatment planning.
P.333
 |
|
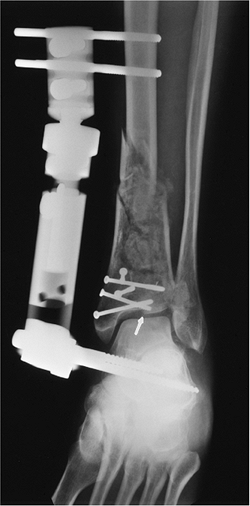
FIGURE 6-19
Mortise view of a tibial plafond fracture reduced with external fixateur and tibial screws. Note the residual articular deformity (arrow). |
Suggested Reading
Bonar SK, Marsh JL. Tibial plafond fractures: Changing principles of treatment. J Am Acad Orthop Surg 1994;2:297–304.
Ovadia DN, Beals RK. Fractures of the tibial plafond. J Bone Joint Surg 1986;68A:543–551.
P.334
Fractures/Dislocations: Ankle Adult—Complications
Key Facts
-
Complications resulting from ankle fractures may be related to injury or treatment.
-
Loss of reduction occurs more commonly with closed techniques (casting) than internal fixation.
-
Degenerative arthritis is the most common long-term complication, occurring in 30% to 40% of cases.
-
Complications are summarized as follows:
-
Loss of reduction (up to 26% treated by casting alone)
-
Osteoarthritis
-
Chronic instability
-
Loss of motion
-
Nonunion
-
Malunion
-
Reflex sympathetic dystrophy
-
Infection
-
Adhesive capsulitis
-
Tendon rupture
-
Neurovascular injury
-
P.335
 |
|
FIGURE 6-20 AP (A) and lateral (B)
radiographs demonstrating severe posttraumatic arthritis with osseous fragments in the joint and marked tibiotalar joint asymmetry. |
Suggested Reading
Pettrone FA, Gail M, Pee D, et al. Quantitative criteria for prediction of results of displaced fracture of the ankle. J Bone Joint Surg 1983;65A:667–677.
P.336
Fractures/Dislocations: Talar Fractures—Talar Neck
Key Facts
-
Fractures of the talar neck are common in adults and rare in children.
-
Talar fractures account for 6% of foot and ankle injuries and 30% of talar fractures.
-
The mechanism of injury is abrupt dorsiflexion of the foot during a fall or motor vehicle accident.
-
Talar neck fractures may be undisplaced or displaced. The latter are associated with subtalar subluxation/dislocation.
-
Displaced fractures usually require internal fixation.
-
Complications include avascular necrosis
(usually evident by 6 to 8 weeks), osteoarthritis (97%), and malunion
or nonunion (15%).
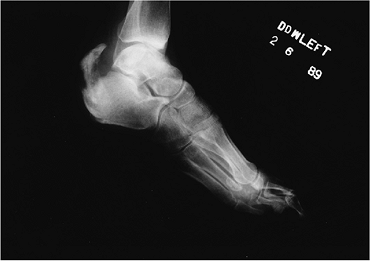
 |
|
FIGURE 6-21 Lateral radiograph of the foot showing a comminuted talar neck fracture (arrow).
|
P.337
 |
|
FIGURE 6-22
Hawkins sign. AP radiograph after fixation of talar neck and medial malleolar fractures. The lateral talus is sclerotic, indicating loss of flow. There is normal subchondral osteopenia (arrow) medially. |
Suggested Reading
Daniels TR, Smith JW. Talar neck fractures (review). Foot Ankle 1993;14:225–234.
Hawkins LG. Fractures of the neck of the talus. J Bone Joint Surg 1970;52A:991–1002.
P.338
Fractures/Dislocations: Talar Fractures—Body, Head, Process Fractures
Key Facts
-
Fractures of the talar body and posterior or lateral processes are uncommon in adults and rare in children.
-
Most fractures are the result of significant falls or motor vehicle accidents with axial compression.
-
Lateral talar process fractures (“snowboarder’s fracture”) are easily missed on radiographs (40% are overlooked initially).
-
CT is important to detect and manage talar body and process fractures.
-
Treatment is anatomic reduction, which requires internal fixation for displaced fractures.
-
Complications are the same as with talar neck fractures. Malunion and avascular necrosis occur in 16%.
 |
|
FIGURE 6-23 Lateral radiograph of a posterior talar body and process fracture (arrow).
|
P.339
 |
|
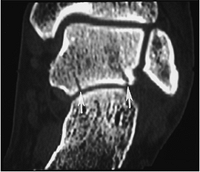
FIGURE 6-24 Coronal CT image demonstrating talar body fractures (arrows) entering the posterior subtalar joint.
|
Suggested Reading
Boack DH, Manegold S. Peripheral talar fractures. Injury 2004;35(S2):B23–B25.
Sneppen O, Christensen SB, Krogsoe O, et al. Fracture of the body of the talus. Acta Orthop Scand 1977;48:317–324.
P.340
Fractures/Dislocations: Talar Fractures—Talar Dome Fractures
Key Facts
-
This is the most common talar fracture.
-
Talar dome fractures are difficult to
detect (50% missed), and prognosis is more guarded compared with
nonarticular chip or avulsion fractures. -
Fractures are most common in adults. Only 8% occur in patients less than 16 years of age.
-
Acute lesions are most often lateral. Ten percent involve both the lateral and medial talar dome.
-
CT or MRI is important for detection, localization, and measurement of lesion size and displacement.
-
Displaced lesions should be resected or arthroscopically removed.
-
Arthrosis is the most common complication (50%).
 |
|
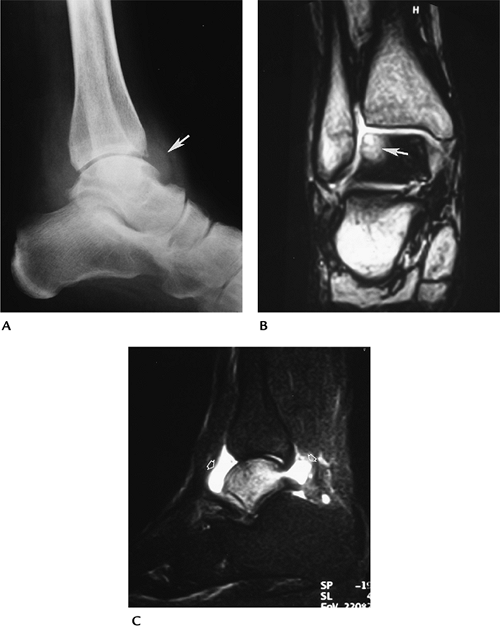
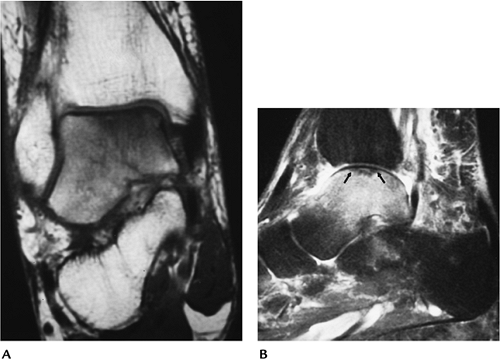
FIGURE 6-25 Coronal T1- (A) and fat-suppressed sagittal T2-weighted (B) images demonstrate marrow edema and a subtle nondisplaced talar dome fracture (arrows).
|
P.341
 |
|
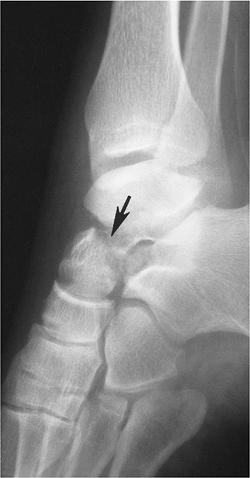
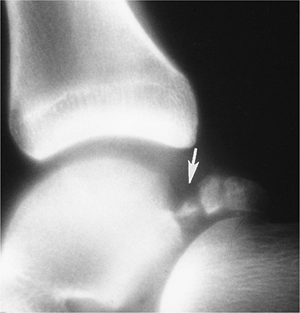
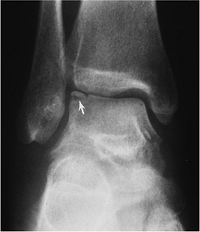
FIGURE 6-26 Mortise view of a slightly displaced lateral talar dome fracture (arrow).
|
Suggested Reading
Clark
TWI, Janzen DL, Kendall H, et al. Detection of radiographically occult
ankle fractures following acute trauma. Positive predictive value of
ankle effusion. AJR Am J Roentgenol 1995;164:1185–1189.
TWI, Janzen DL, Kendall H, et al. Detection of radiographically occult
ankle fractures following acute trauma. Positive predictive value of
ankle effusion. AJR Am J Roentgenol 1995;164:1185–1189.
P.342
Fractures/Dislocations: Talar and Subtalar Dislocations
Key Facts
-
The majority of eversion and inversion motion occurs in the subtalar joint.
-
Talar dislocations account for only 1% of all dislocations.
-
Fifteen percent of talar injuries are caused by dislocation.
-
Subtalar dislocations may be medial (56%), lateral (34%), posterior (6%), or anterior (4%).
-
Associated talar or calcaneal fractures occur in 75% of lateral and 45% of medial dislocations.
-
Total dislocation is rare. There is a
high incidence of infection, which may require talectomy. Avascular
necrosis also is common. -
Post-reduction CT with coronal and sagittal reformatting is essential to assess reduction and detect associated fractures.
 |
|
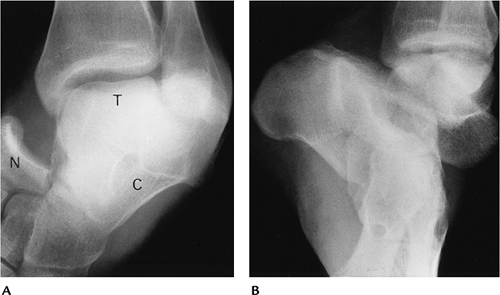
FIGURE 6-27 Subtalar and talonavicular dislocation. (A) AP view of the ankle showing the talus (T), calcaneus (C), and navicular (N). The calcaneus is rotated under the talus. (B) Oblique view showing the talus lateral to the calcaneus.
|
Suggested Reading
Detenbeck LC, Kelly PJ. Total dislocation of the talus. J Bone Joint Surg 1969:51A:283–288.
P.343
Fractures/Dislocations: Calcaneal Fractures—Intra-articular
Key Facts
-
The calcaneus is the most commonly
fractured bone in the adult foot, accounting for 60% of foot fractures,
but only 2% of all skeletal fractures. -
Calcaneal fractures in children account for only 5% of calcaneal fractures.
-
Pediatric fractures usually are extra-articular (63%), whereas adult fractures usually are intra-articular (70% to 75%).
-
Most adult fractures are the result of
axial loading resulting from falls or motor vehicle accidents. Ten
percent are bilateral. Associated vertebral fractures occur in 10%. -
CT with coronal and sagittal reformatting
is required to classify the injury and access articular involvement and
fracture complexity. -
Treatment goals are to re-establish articular alignment, calcaneal width, and the posterior facet (Böhler’s angle).
-
Complications include
-
Prolonged pain and disability
-
Lower extremity fractures (20%–46%)
-
Soft tissue injury
-
Neurovascular injury
-
 |
|
FIGURE 6-28 Lateral radiograph in a patient with a comminuted calcaneal fracture. Böhler’s angle measures 10 degrees.
|
P.344
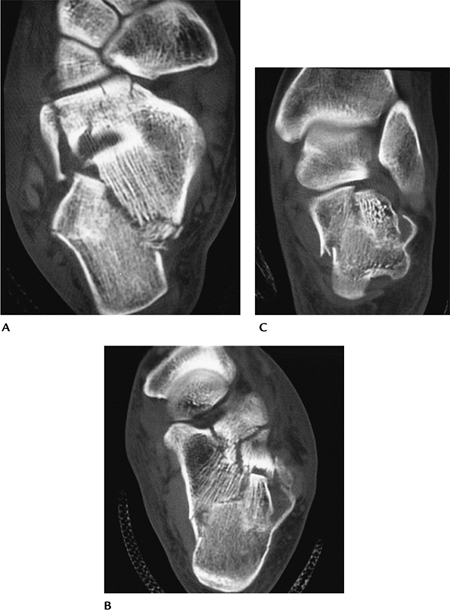 |
|
FIGURE 6-29 Comminuted intra-articular calcaneal fracture. Axial (A,B) and coronal (C) CT images clearly show fragment position and articular involvement.
|
P.345
Suggested Reading
Crosby LA, Fitzgibbons I. Computerized tomographic scanning of acute intra-articular fractures of the calcaneus. J Bone Joint Surg 1990:72A:852–859.
Daftary A, Haims AH, Baumgartner MR. Fractures of the calcaneus: A review with emphasis on CT. Radiographics 2005;25:1215–1226.
P.346
Fractures/Dislocations: Calcaneal Fractures—Extra-articular
Key Facts
-
Extra-articular fractures account for 25%
of calcaneal fractures. This includes all fractures that do not involve
the posterior facet. -
Mechanism of injury: twisting, compression, or avulsion forces.
-
Certain fractures may present as ankle
sprains: anterior calcaneal process, peroneal tubercle, lateral
calcaneal process, sustentaculum tali, calcaneal tuberosity, and medial
calcaneal process fractures. -
CT is frequently required to detect the injury and exclude intra-articular involvement.
 |
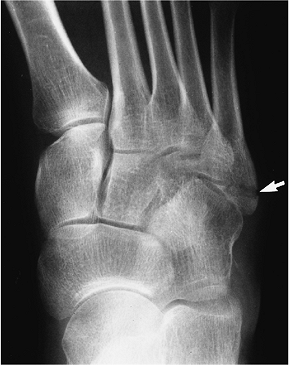
|
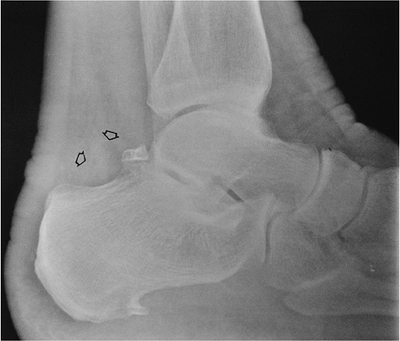
FIGURE 6-30 Lateral radiograph of an anterior calcaneal process fracture (arrow).
|
 |
|
FIGURE 6-31 Lateral radiograph of a calcaneal tuberosity avulsion fracture.
|
Suggested Reading
Gilheany MF. Injury to the anterior process of the calcaneus. Foot 2002;12:142–149.
P.347
Fractures/Dislocations: Midfoot Injuries
Key Facts
-
The midfoot consists of the lesser tarsal bones (navicular, cuboid, three cuneiforms) and tarsometatarsal (Lisfranc) joints.
-
Injuries may be the result of medial (30%), longitudinal (41%), lateral (17%), or plantar (4%) forces, and crush injuries (5%).
-
Isolated tarsal fractures are uncommon.
-
Tarsometatarsal fracture/dislocations are
Lisfranc injuries (1% of all fracture/dislocations). The mechanism of
injury is forced plantar flexion of the forefoot. CT with reformatting
is essential to define the extent of injury.
P.348
 |
|
FIGURE 6-32 Patterns of Lisfranc fracture/dislocations. (A) Type A: total incongruity; (B) Type B: partial incongruity; (C) Lateral dislocation; (D) Type C or divergent with total displacement (A) and partial displacement (B).
|
P.349
P.350
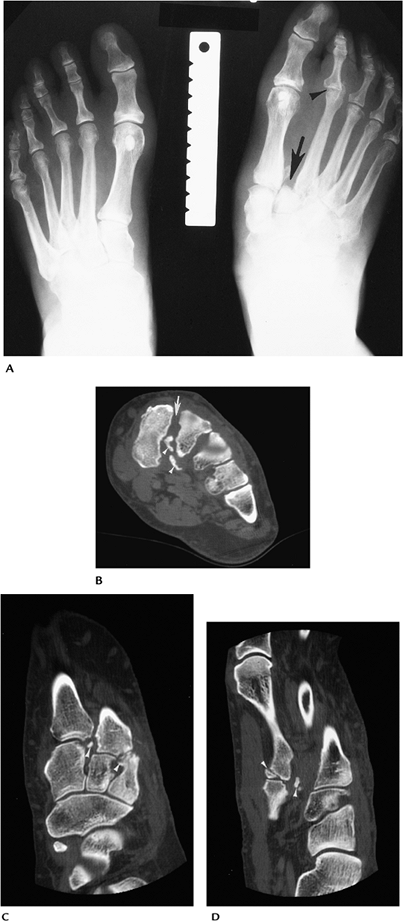 |
|
FIGURE 6-33 Lisfranc fracture/dislocation. (A) AP radiograph shows a fracture/dislocation (arrow) at the tarsometatarsal joints. There is also a dislocation (arrowhead) of the second metatarsophalangeal (MTP) joint. CT images in the axial (B), sagittal and coronal (C,D) planes demonstrate widening of the 1–2 metatarsal bases (arrow) with multiple osteochondral fractures (arrowheads).
|
Suggested Reading
Karasick D. Fracture and dislocation of the foot. Semin Roentgenol 1994;29:152–175.
Makawana NK, Van Lefland MR. Injuries of the midfoot. Curr Orthop 2005;19:231–242.
P.351
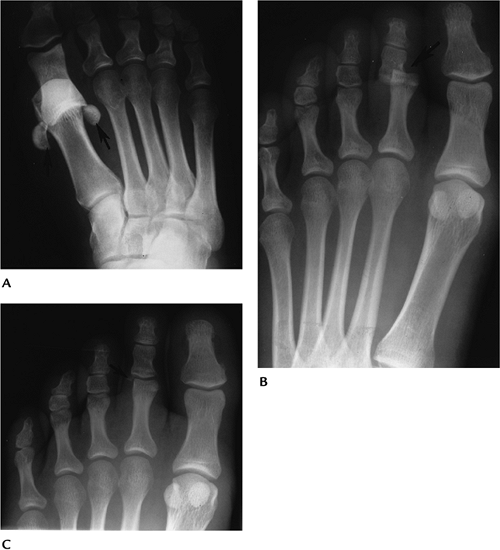
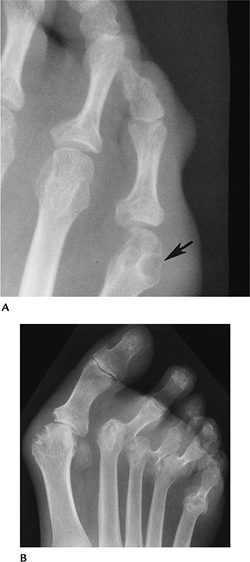
Fractures/Dislocations: Forefoot Injuries—Fifth Metatarsal Fractures
Key Facts
-
Fractures of the fifth metatarsal base are common in children and adults.
-
Fractures are categorized as proximal or distal.
-
Proximal fractures are divided into three zones (Fig. 6-34).
Zone 1, avulsion fractures; Zone 2, Jone’s fractures caused by forefoot
adduction; Zone 3, typically athletic stress fractures. -
Distal fractures (Dancer’s fracture) are usually the result of a direct blow.
-
Treatment of fractures in Zone 1 and distal fractures is conservative. Fractures in Zones 2 and 3 may require internal fixation.
 |
|
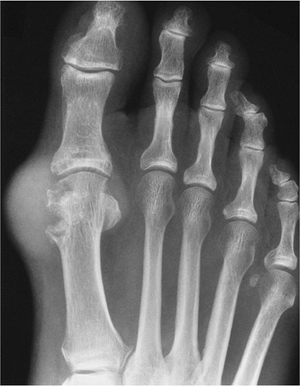
FIGURE 6-34 Oblique radiograph demonstrating the three zones of the proximal fifth metatarsal. There is an ununited Jone’s fracture (arrow) in Zone 2.
|
 |
|
FIGURE 6-35 Avulsion fracture of the fifth metatarsal base in Zone 1 (arrow).
|
P.352
Suggested Reading
Ekrol I, Court-Brown CM. Fractures of the base of the fifth metatarsal. Foot 2004;14:96–98.
Theodorou
DJ, Theodorou SJ, Kakitubata Y, et al. Fractures of the fifth
metatarsal base: anatomic and imaging evidence of pathogenesis of
avulsion of the plantar aponeurosis and short peroneal tendon. Radiology 2003;226:857–865.
DJ, Theodorou SJ, Kakitubata Y, et al. Fractures of the fifth
metatarsal base: anatomic and imaging evidence of pathogenesis of
avulsion of the plantar aponeurosis and short peroneal tendon. Radiology 2003;226:857–865.
Key Facts
-
Isolated fractures of the first metatarsal are rare.
-
Proximal metatarsal fractures are often associated with midfoot fracture/dislocations.
-
Distal metatarsal fractures usually are related to a blow from a heavy object.
-
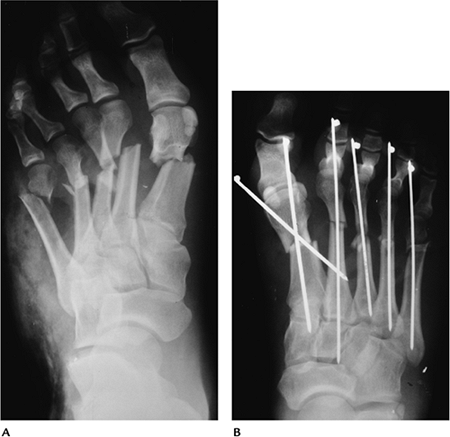
Phalangeal fractures are the most common forefoot injury. Jamming or dropping a heavy object result in fracture.
-
Dislocations of the metatarsophalangeal
(MTP) and interphalangeal joints may occur as isolated events or be
associated with fractures.-
The first MTP and proximal interphalangeal joints are most commonly dislocated.
-
 |
|
FIGURE 6-36 Crush injury. (A) AP radiograph demonstrates complex comminuted metatarsal fractures. (B) Fractures were reduced using K-wire fixation.
|
P.353
P.354
Fractures/Dislocations: Forefoot Injuries—Metatarsophalangeal Fracture/Dislocations
 |
|
FIGURE 6-37 Dislocations. (A) AP radiograph with first MTP dislocation and displacement of the sesamoids (arrows). (B) Dorsal dislocation of the second proximal interphalangeal joint (arrow). After reduction (C) there is an obvious associated osteochondral fracture (arrow).
|
Suggested Reading
Karasick D. Fractures and dislocations of the foot. Semin Roentgenol 1994;29:152–175.
P.355
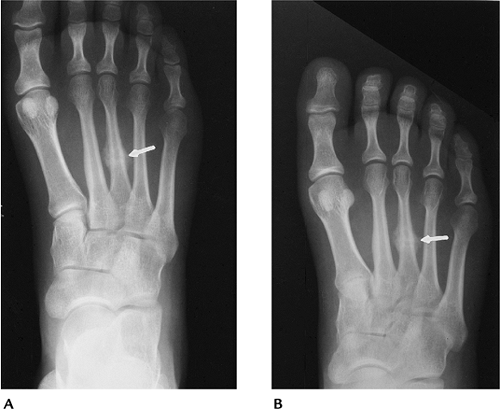
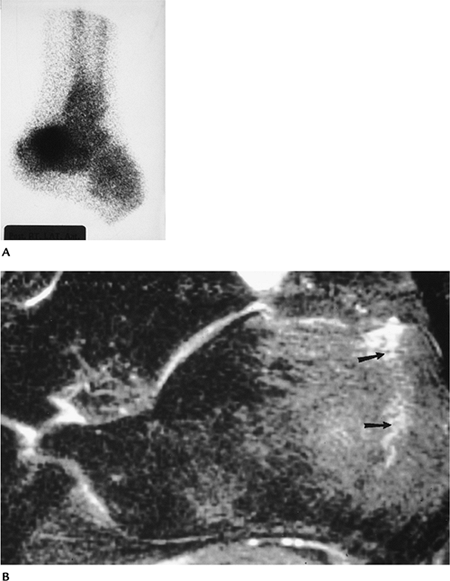
Fractures/Dislocations: Stress Fractures
Key Facts
-
Most stress fractures are fatigue fractures caused by repetitive stress or muscle tension on normal bone.
-
Stress fractures commonly occur in military recruits or civilians engaged in a new activity such as running.
-
More than 80% of stress fractures involve the tibia, fibula, metatarsals, and calcaneus.
-
Table 6-2 summarizes the location and cause of stress fractures.
-
Early detection may be difficult with
routine radiographs. Bone scans detect lesions earlier. MRI may provide
the most specific early diagnosis.
|
TABLE 6-2 STRESS FRACTURES
|
||||||||||||||
|---|---|---|---|---|---|---|---|---|---|---|---|---|---|---|
|
P.356
 |
|
FIGURE 6-38 AP radiographs of a healing third metatarsal stress fracture.
|
P.357
 |
|
FIGURE 6-39 Calcaneal stress fractures. (A) Radionuclide scan demonstrates marked uptake in the calcaneus. (B) Sagittal fast spin-echo T2-weighted image with fat suppression demonstrates a calcaneal stress fracture (arrows) with surrounding edema.
|
Suggested Reading
Daffner RH. Stress fractures. Skel Radiol 1987;2:221–229.
P.358
Soft Tissue Trauma/Overuse Syndromes: Ligament Injuries
Key Facts
-
Ligament support for the ankle includes
the distal tibiofibular (anterior and posterior) and interosseous
ligaments. Medially, the deltoid ligament expands as it extends from
the medial malleolus to insert on the talus and calcaneus. There are
three lateral ligaments: anterior talofibular, calcaneofibular, and
posterior talofibular. -
Injury to the lateral ligaments is most common. However, medial ligament injuries and syndesmotic sprains also occur.
-
Imaging approaches are important to classify the extent of injury. Table 6-3 defines imaging techniques and features of ligament injury.
-
Complete tears (i.e., two lateral ligaments) are more likely to be treated by operative intervention.
|
TABLE 6-3 IMAGING OF ANKLE LIGAMENT INJURIES
|
|||||||||||||||||||
|---|---|---|---|---|---|---|---|---|---|---|---|---|---|---|---|---|---|---|---|
|
|||||||||||||||||||
P.359
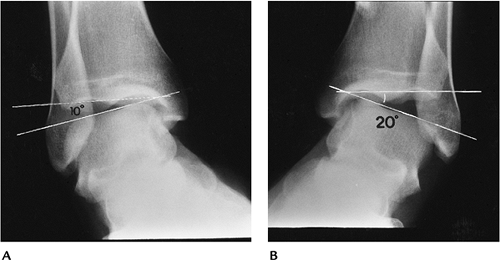 |
|
FIGURE 6-40 Stress views. Normal ankle (A) and injured (B)
ankle shows that the joint laterally on the injured side is 10 degrees greater than the normal side because of tears in the calcaneofibular and anterior talofibular ligaments. |
 |
|
FIGURE 6-41 Arthrogram of the left ankle shows contrast anteriorly (arrow)
because of an anterior talofibular ligament tear. The peroneal tendon sheaths do not fill indicating the calcaneofibular ligament is intact. |
P.360
 |
|
FIGURE 6-42 (A) Axial T2-weighted MR image showing a joint effusion with a torn anterior talofibular ligament (arrow). (B) Coronal image showing a talar dome fracture with marrow edema and a torn calcaneofibular ligament (white arrow).
|
Suggested Reading
Berquist TH. Imaging of orthopedic trauma, 2nd ed. New York: Raven Press; 1992.
P.361
Soft Tissue Trauma/Overuse Syndromes: Peroneal Tendon Injuries
Key Facts
-
Peroneal tendon subluxation
-
Uncommon
-
Cause—chronic ankle sprains, retinacular laxity, shallow fibular grooves
-
Image features—fibular flake fractures, subluxation on tenograms or MRI with motion studies
-
-
Peroneal tendon rupture
-
Uncommon
-
Patients present with instability.
-
Tears may be degenerative, partial, or complete.
-
Peroneus brevis tears are longitudinal and associated with subluxation.
-
Image features—increased signal and
thickening on T2-weighted MR images with partial tears; increased
signal with segment separation on T2-weighted MR images with complete
tears
-
-
Tenosynovitis and stenosing tenosynovitis
-
Common
-
Associated with repetitive trauma, previous fracture, and subluxation
-
Image features—fluid in tendon sheath on
T2-weighted MR images; narrowing of the tendon sheath with stenosing
tenosynovitis on T2-weighted MRI or tenogram
-
-
Treatment is conservative for partial tears and surgical repair for complete tears.
 |
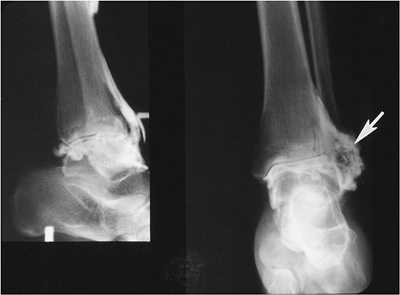
|
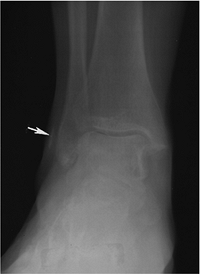
FIGURE 6-43 AP radiograph demonstrating a flake fracture (arrow) caused by peroneal tendon dislocation.
|
P.362
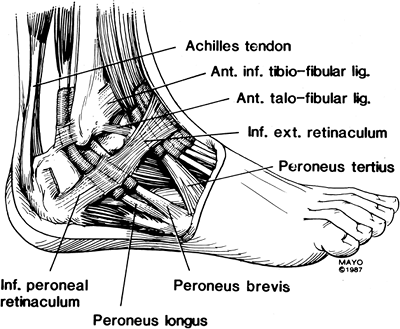 |
|
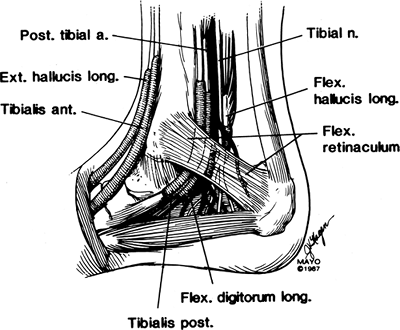
FIGURE 6-44 Peroneal tendon anatomy.
|
P.363
 |
|
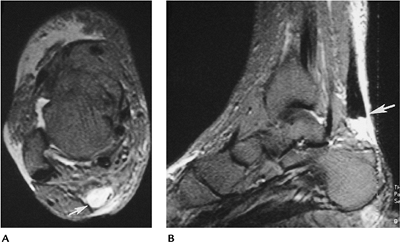
FIGURE 6-45 (A) Sagittal proton density-weighted image of the normal low signal intensity peroneal tendons. (B) Sagittal proton density-weighted image shows a torn tendon (arrow) at the fibular tip and only one tendon (lower arrow) distally.
|
Suggested Reading
DiGiovanni BF, Fraga CJ, Cohen BE, et al. Associated injuries found in chronic lateral ankle instability. Foot Ankle Int 2000;21:809–815.
Khoury NJ, El-Khoury GY, Saltzman CL, et al. Peroneus, longus, and brevis tendon tears. MR imaging evaluation. Radiology 1996;200:833–841.
P.364
Soft Tissue Trauma/Overuse Syndromes: Achilles Tendon
Key Facts
-
The Achilles tendon is the largest and strongest tendon of the foot and ankle. There is no tendon sheath.
-
Disorders include tendinosis and partial and complete tendon tears.
-
There are four categories of tendinosis based on their histology.
-
Hypoxic fibromatosis: most common, occurs
in the critical zone (2–6 cm above the insertion). Low signal intensity
and thickening on MR images. -
Myxoid degeneration: second most common
form of tendinosis. Thickening with slight increased signa intensity on
T2-weighted MR images. -
Lipoid degeneration: occurs in older patients.
-
Calcific/ossific degeneration: 3% of tendinosis cases. Calcification or ossification in the tendon on radiographs.
-
-
Patients with tendon tears present with pain, local swelling, and inability to raise up on their toes.
-
Diagnosis is clinically missed in 25%.
-
Differential diagnoses includes muscle tear and deep venous thromboses.
-
Imaging can be accomplished with
ultrasound or MRI. Axial and longitudinal ultrasound or axial and
sagittal T2-weighted MR images are obtained. -
Treatment is cast immobilization for incomplete tears and surgical repair for complete tears.
P.365
 |
|
FIGURE 6-46 Ultrasound of Achilles tendon tear. Transaxial (A) and longitudinal (B) images of a left Achilles rupture. (Courtesy of J. W. Charboneau, Mayo Clinic, Rochester, MN.)
|
P.366
 |
|
FIGURE 6-47 MRI of Achilles tear. Axial (A) and sagittal (B) T2-weighted images showing high signal intensity fluid (arrow) resulting from a complete tear of the Achilles tendon.
|
Suggested Reading
Schweitzer ME, Karasick D. MR imaging of disorders of the Achilles tendon. AJR Am J Roentgenol 2000;175:613–625.
Tuite MJ. MR imaging of the tendons of the foot and ankle. Semin Musculoskeletal Radiol 2002;6:119–131.
P.367
Soft Tissue Trauma/Overuse Syndromes: Medial Tendon Injuries
Key Facts
-
From anterior to posterior, the medial
tendons include the tibialis posterior, flexor digitorum longus, and
flexor hallucis longus. -
Abnormalities in the medial tendons include degeneration, partial and complete tears, and subluxation or dislocation.
-
Tibialis posterior tendon disorders are
most common. Patients usually are middle-aged or older females with
ankle pain, instability, and foot deformities. -
More than 50% have abnormalities on routine radiographs.
Feature Incidence ↓ Calcaneal inclination 50% ↑ Lateral talometatarsal angle 47% ↑ Anterior talocalcaneal angle 43% Medial swelling 27% Accessory navicular 17% -
There are three types of accessory
navicular. Type I: oval, imbedded in tendon. Type II: triangular with
fibrocartilaginous synchondrosis. Type III: cornuate and incompletely
incorporated into the navicular. Types II and III: associated with
posterior tibial tendon dysfunction. -
Flexor digitorum longus and flexor
hallucis longus tenosynovitis occur and may be seen in ballet dancers
and soccer players. Rupture of these tendons is uncommon. -
MRI is the technique of choice. Axial and sagittal T2-weighted images define the type and extent of injury.
P.368
 |
|
FIGURE 6-48 Medial tendon and tarsal tunnel anatomy.
|
P.369
 |
|
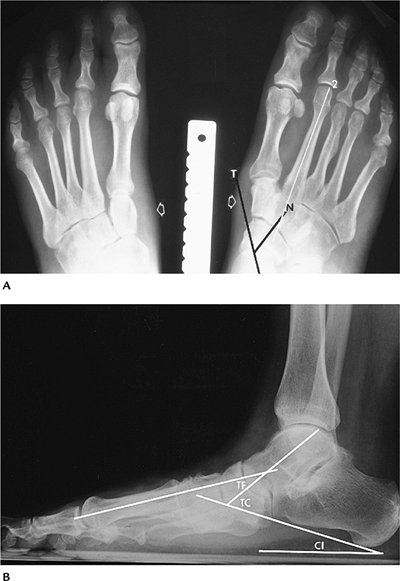
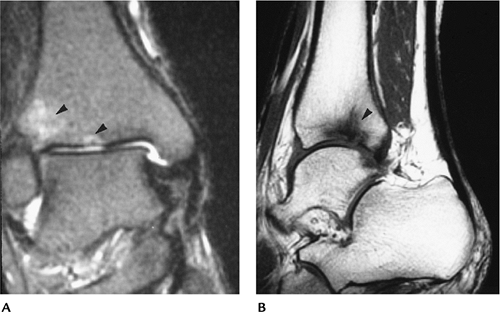
FIGURE 6-49 Standing AP (A) and lateral (B) radiographs of the foot in an elderly female with posterior tibial tendon tears. (A) There is medial soft tissue swelling (open arrows)
bilaterally. The foot is pronated with the talar axis (T) projecting medially, and the navicular (N) is rotated laterally. The second metatarsal axis (2) is medial to the talocalcaneal angle. (B) The calcaneal inclination (CI) angle is reduced to 11 degrees. The talus is plantar flexed, increasing the talocalcaneal (TC) angle to 60 degrees. The talar first metatarsal angle (TF) should be zero, but in this case it is -28 degrees. |
P.370
P.371
 |
|
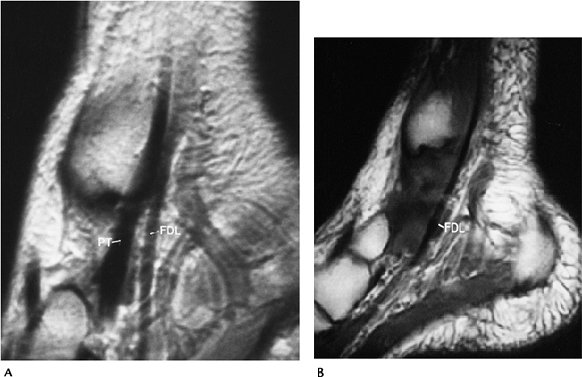
FIGURE 6-50 MRI of a posterior tibial tendon tear. (A) Normal sagittal image with posterior tibial (PT) and flexor digitorum longus (FDL) tendons clearly demonstrated. (B)
Sagittal proton density image showing the flexor digitorum longus (FDL) with no posterior tibial tendon because of a complete tear with retraction. |
Suggested Reading
Garth WP. Flexor hallucis tendinitis in ballet dancers. J Bone Joint Surg 1981;63A:1489.
Karasick D, Schweitzer ME. Tear of the posterior tibial tendon causing asymmetric flatfoot. Radiographic findings. AJR Am J Roentgenol 1993;161:1231–1240.
Schweitzer ME, Karasick D. MR imaging of disorders of the posterior tibialis tendon. AJR Am J Roentgenol 2000;175:627–635.
P.372
Soft Tissue Trauma/Overuse Syndromes: Anterior Tendon Injuries
Key Facts
-
The anterior tibial, extensor hallucis longus, and extensor digitorum longus tendons are enclosed in tendon sheaths.
-
Tendon rupture is uncommon but does occur
in patients with previous fractures, patients with degenerative
arthritis, and runners. -
Patients present with anterior ankle pain and swelling.
-
The anterior tibial tendon accounts for
80% of dorsiflexion of the foot. It is this tendon that is most often
injured. Injury usually is just below the superior retinaculum. -
Ultrasound or MRI (axial and sagittal T2-weighted images) usually is diagnostic.
 |
|
FIGURE 6-51 MRI of a partial anterior tibial tendon tear. Axial (A) and sagittal (B) T2-weighted images showing thickening and increased signal intensity in the anterior tibial tendon (arrow).
|
Suggested Reading
Gallo RA, Kolman BH, Daffner RH, et al. MRI of tibialis anterior tendon rupture. Skel Radiol 2004;33:102–106.
Khoury NJ, El-Khoury GY, Saltzman CL, et al. Rupture of the anterior tibial tendon. Diagnosis with MR imaging. AJR Am J Roentgenol 1996;167:351–354.
P.373
Soft Tissue Trauma/Overuse Syndromes: Plantar Fasciitis
Key Facts
-
The plantar fascia is composed of medial,
lateral, and central components that extend distally from the
posteromedial calcaneal tuberosity. The central component is the
strongest and 2 to 4 mm thick. -
Plantar fasciitis is a chronic and often
disabling painful condition that may be related to exercise, standing,
or walking. Pain is exaggerated by dorsiflexion of the great toe. -
Plantar fasciitis accounts for 7% to 9% of all running injuries.
-
Plantar enthesophytes are evident in 25% to 37% of cases, but many asymptomatic patients demonstrate this finding.
-
Differential diagnoses includes calcaneal stress fracture, fascial rupture, and flexor hallucis longus tendinitis.
-
Imaging can be accomplished with routine radiographs (calcaneal stress fracture), radionuclide scans, or MRI.
-
MR examinations should include T1- and T2-weighted sagittal and coronal or axial T2-weighted images.
-
Treatment includes rest, ice, heel pads, or orthotics.
 |
|
FIGURE 6-52
Sagittal fat-suppressed fast spin-echo T2-weighted image of the normal plantar fascia. There is uniform thickness with low signal intensity (arrowheads). |
P.374
 |
|
FIGURE 6-53
Active plantar fasciitis. Thinning and irregularity of the fascia with increased signal intensity above and below the fascia an this sagittal T2-weighted image. |
 |
|
FIGURE 6-54 Chronic plantar fasciitis. Sagittal T1-weighted image shows thickening of the fascia (arrowhead) near the calcaneal attachment.
|
P.375
 |
|
FIGURE 6-55 Ruptured plantar fascia. T2-weighted sagittal image demonstrating a complete tear (arrow) in the plantar fascia with laxity distally.
|
Suggested Reading
Berkowitz JF, Kier R, Radicel S. Plantar fasciitis. MR imaging. Radiology 1991;179:665–667.
Theodorou DJ, Theodorou SJ, Farooki S, et al. Disorders of the plantar fascia: Review of MR imaging appearances. AJR Am J Roentgenol 2001;176:97–104.
P.376
Soft Tissue Trauma/Overuse Syndromes: Bursitis
Key Facts
-
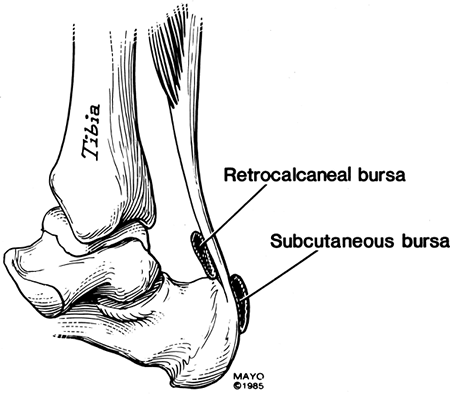
The heel has two bursae: one between the Achilles and calcaneus and the second superficial to the Achilles tendon.
-
Enlarged superficial bursae (Haglund disease) is common in younger women because of their footwear.
-
Inflammation of the retrocalcaneal bursa
is seen in patients with inflammatory arthropathies (Reiter syndrome,
gout, rheumatoid arthritis) and heel varus deformities. -
Inflamed distended bursa may be evident on radiographs. However, MRI and ultrasound are more definitive.
 |
|
FIGURE 6-56 Bursae of the heel.
|
P.377
 |
|
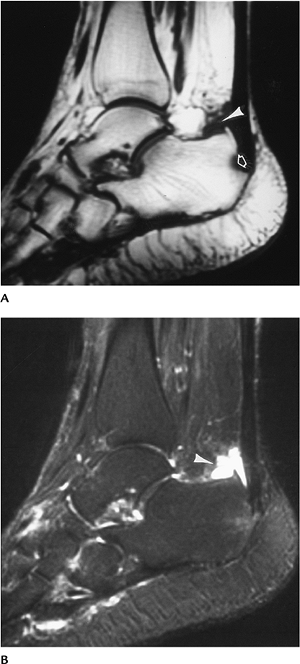
FIGURE 6-57 Retrocalcaneal bursitis. Sagittal T1-weighted (A) and T2-weighted (B) MR images showing fluid distending the bursa (arrowhead) and bone erosion (open arrow in A).
|
Suggested Reading
Bottger BA, Schweitzer ME, El-Nousam KI, et al. MR imaging of normal and abnormal retrocalcaneal bursae. AJR Am J Roentgenol 1998;170:1239–1240.
P.378
Soft Tissue Trauma/Overuse Syndromes: Os Trigonum Syndrome
Key Facts
-
The os trigonum is connected to the talus
by a cartilaginous synchondrosis. Ossification of the process occurs
from 7 to 13 years of age. -
A separate ossicle remains in 7% to 14% of patients, and it often is bilateral.
-
Os trigonum syndrome may be the result of
acute trauma or repetitive microtrauma. Process fracture, flexor
hallucis tendinitis, and posterior impingement may all be evident. -
Patients present with posterior ankle pain exaggerated by plantar flexion of the foot and soft tissue swelling.
-
Imaging is possible with several approaches.
-
Routine radiographs with stress views to exaggerate symptoms, and there is edema in the pre-Achilles fat.
-
Radionuclide scans are positive in the posterior talus. A negative scan excludes the diagnosis.
-
MRI examinations show edema and flexor hallucis tendinitis.
-
Diagnostic injection with anesthetic relieves symptoms.
-
-
Treatment usually is conservative with cast immobilization. If this fails, resection may be indicated.
 |
|
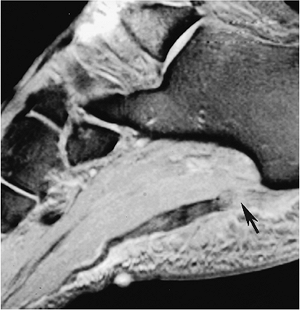
FIGURE 6-58 Computed radiography lateral view of the ankle showing an os trigonum with edema in the pre-Achilles fat (open arrow) caused by os trigonum syndrome.
|
P.379
 |
|
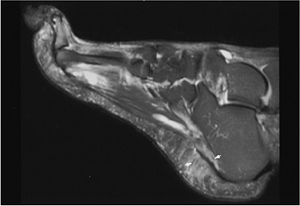
FIGURE 6-59 MRI of os trigonum syndrome. Sagittal (A) and axial (B) T2-weighted images showing fluid in the region of the os trigonum (arrowheads in A) and edema (open arrow) and tendon sheath fluid (arrowhead) around the flexor hallucis longus tendon because of associated tendinitis.
|
Suggested Reading
Wakely CJ, Johnson DP, Watt I. The value of MR imaging in diagnosis of an os trigonum syndrome. Skel Radiol 1996;25:133–136.
P.380
Soft Tissue Trauma/Overuse Syndromes: Tarsal Tunnel Syndrome
Key Facts
-
The tarsal tunnel is located in the
posteromedial ankle and extends from just above the medial malleolus to
the abductor hallucis muscle of the foot (Fig. 6-48).
It is bounded medially by the flexor retinaculum and laterally by the
talus and calcaneus. Contents of the tarsal tunnel include the
posterior tibial, flexor digitorum longus, and flexor hallucis longus
tendons and the posterior tibial nerve and vascular complex. -
Tarsal tunnel syndrome is caused by posterior tibia neuropathy in the tarsal tunnel. The causes are summarized in Table 6-4.
-
Patients typically present with paresthesias, burning in the foot, or plantar anesthesia.
-
Imaging can be accomplished with ultrasound, CT, or MRI.
-
Treatment usually is surgical decompression. Best results are obtained (79% to 95%) when a definite mass or other cause (Table 6-4) can be defined.
|
TABLE 6-4 TARSAL TUNNEL SYNDROME CAUSES
|
|
|---|---|
|
P.381
 |
|
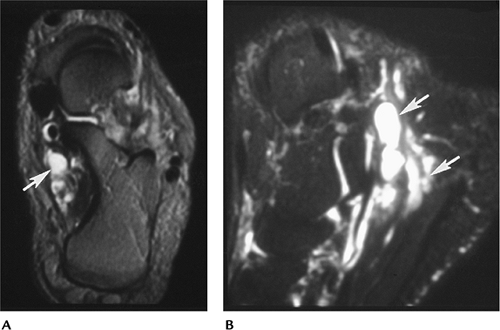
FIGURE 6-60 Enlarged veins causing tarsal tunnel syndrome. Axial (A) and sagittal (B) fat-suppressed T2-weighted images showing dilated veins or varices in the tarsal tunnel (arrows).
|
Suggested Reading
Pfeiffer WH, Cracchiolo A. Clinical results after tarsal tunnel decompression. J Bone Joint Surg 1994;76A:1222–1230.
P.382
Soft Tissue Trauma/Overuse Syndromes: Sinus Tarsi Syndrome
Key Facts
-
The tarsal canal and sinus is bordered by
the synovial capsules of the subtalar facets. It contains fat,
neurovascular structures, and the five ligaments of the tarsal canal. -
Patients with sinus tarsi syndrome
present with lateral ankle or hindfoot pain and tenderness over the
sinus tarsi to palpation. Most patients present with a history of ankle
sprain or inversion injury (70%). -
Cause may be related to calcaneofibular ligament tears, capsular hypertrophy, and space-occupying lesions.
-
Imaging of the tarsal canal and sinus can be accomplished with ultrasound, CT, or MRI. MRI is preferred in our experience.
-
Surgical repair of ligament tears or decompression of masslike lesions typically is performed.
 |
|
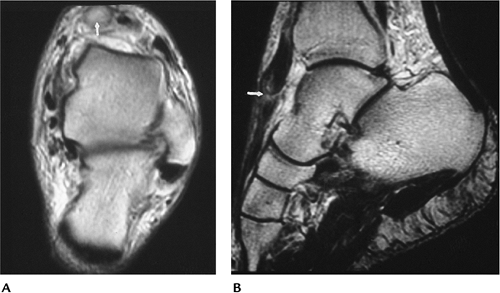
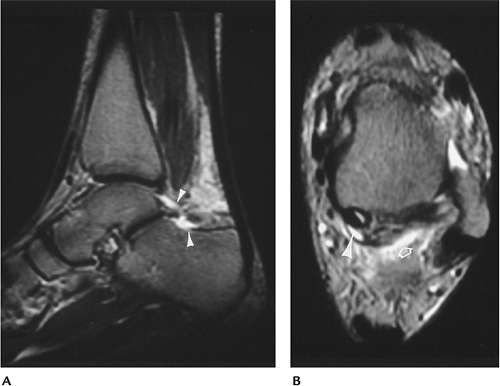
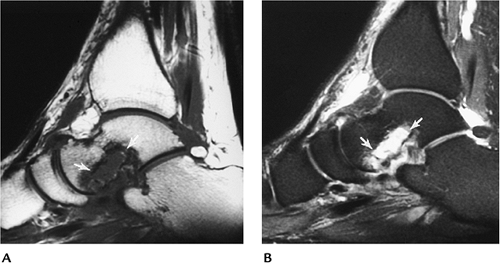
FIGURE 6-61 Sinus tarsi syndrome. Sagittal T1-weighted (A) and T2-weighted (B) images showing abnormal signal intensity in the tarsal sinus and bone erosions (arrows).
|
Suggested Reading
Klein
MA, Spreitzor AM. MR imaging of the tarsal canal and sinus. Normal
anatomy, pathologic findings, and features of sinus tarsi syndrome. Radiology 1993;186: 233–240.
MA, Spreitzor AM. MR imaging of the tarsal canal and sinus. Normal
anatomy, pathologic findings, and features of sinus tarsi syndrome. Radiology 1993;186: 233–240.
Lektrakul
N, Chung CB, Lai Y, et al. Tarsal sinus: Arthrography, MR imaging, and
pathologic findings in cadavers and retrospective study data in
patients with sinus tarsi syndrome. Radiology 2001;219:802–812.
N, Chung CB, Lai Y, et al. Tarsal sinus: Arthrography, MR imaging, and
pathologic findings in cadavers and retrospective study data in
patients with sinus tarsi syndrome. Radiology 2001;219:802–812.
P.383
Soft Tissue Trauma/Overuse Syndromes: Impingement Syndromes
Key Facts
-
Impingement syndromes in the ankle may be
related to bone or soft tissue abnormalities. There are five commonly
described syndromes: anterior, anteromedial, anterolateral, posterior,
and posteromedial.-
Anterior impingement syndrome: Common in
athletes using repetitive dorsiflexion. Osseous beaklike changes in the
anterior tibia and adjacent talus. Synovial scarring and hypertrophy. -
Anterolateral impingement syndrome:
Usually related to prior inversion or plantar flexion injury.
Associated tears in the capsule or ligaments. Chronic microtrauma with
thickening of the ligaments and capsule is also implicated. -
Anteromedial impingement syndrome:
Eversion injuries with partial ligament tears are implicated. Capsular
thickening and osteophyte formation; 55% have associated talar dome
defects. -
Posteromedial impingement syndrome: Uncommon, but seen with severe ankle injuries with crushing of the deep deltoid fibers.
-
Posterior impingement syndrome: Acute and
chronic trauma. Posterior talar process fractures, flexor hallucis
longus tendinitis, and posterior tibio-talar impingement. Analogous to
os trigonum syndrome.
-
-
Imaging can be accomplished with stress
views, CT, or MRI. MRI is most useful to confirm diagnosis and exclude
other causes of ankle pain.
P.384
 |
|
FIGURE 6-62 Anterolateral impingement syndrome. CT images with bone (A) and soft tissue (B) settings showing hypertrophy of the capsule (arrow) and a marginal osteophyte (open arrow).
|
P.385
 |
|
FIGURE 6-63 Sagittal T1-weighted image of an old partial ligament tear with soft tissue thickening (arrow) anterolaterally.
|
Suggested Reading
Robinson P, White LM. Soft tissue and osseous impingement syndromes of the ankle. Role of imaging in diagnosis and management. Radiographics 2002;22:1457–1471.
Rubin DA, Tishkaff NW, Britton CA, et al. Anterolateral soft tissue impingement of the ankle. Diagnosis using MR imaging. AJR Am J Roentgenol 1997;169:829–835.
P.386
Soft Tissue Trauma/Overuse Syndromes: Midfoot and Forefoot Syndromes
Key Facts
-
Overuse syndromes in the midfoot and forefoot are not uncommon.
-
Many conditions are diagnosed clinically and do not require imaging.
-
Table 6-5 summarizes conditions in which imaging studies may be required.
|
TABLE 6-5 FOREFOOT PAIN SYNDROMES
|
||||||||||||||||||||
|---|---|---|---|---|---|---|---|---|---|---|---|---|---|---|---|---|---|---|---|---|
|
||||||||||||||||||||
P.387
 |
|
FIGURE 6-64 Stress fracture. Subtle periosteal new bone (arrow) in the distal second metatarsal as the result of a healing stress fracture.
|
 |
|
FIGURE 6-65 Sesamoid fracture. Lateral radiograph of the forefoot demonstrates sclerosis and fracture of the medial sesamoid (arrowhead).
|
P.388
 |
|
FIGURE 6-66 Axial T1-weighted image demonstrating a Morton’s neuroma (arrow).
|
Suggested Reading
Berquist TH. Radiology of the foot and ankle, 2nd ed. Philadelphia: Lippincott Williams & Wilkins; 2000:105–170.
P.389
Neoplasms/Tumorlike Conditions: Skeletal Lesions—Benign
Key Facts
-
Skeletal neoplasms of the foot and ankle account for only 1% to 2% of primary skeletal neoplasms.
-
Benign lesions outnumber malignant lesions 4:1.
-
Giant cell tumors and osteoid osteomas are most common in some series. Enchondroma also is frequently seen in the foot.
-
Benign tumors and tumorlike conditions in the foot and ankle are as follows:
Lesion Total/No. in Foot or Ankle/% in Foot or Ankle Giant cell tumor 568/35/6% Osteoid osteoma 331/33/10% Osteochondroma 872/45/5% Nonossifying fibroma 125/40/32% Subungual exostosis 81/57/70% Aneurysmal bone cyst 289/36/12% Enchondroma 290/25/9% Chondromyxoid fibroma 45/11/24% Chondroblastoma 199/11/9% Fibrous dysplasia 560/9/2% Osteoblastoma 87/7/8% -
Imaging of the skeletal lesions begins
with routine radiographs. CT and MRI are useful for staging or better
characterizing lesions.
P.390
 |
|
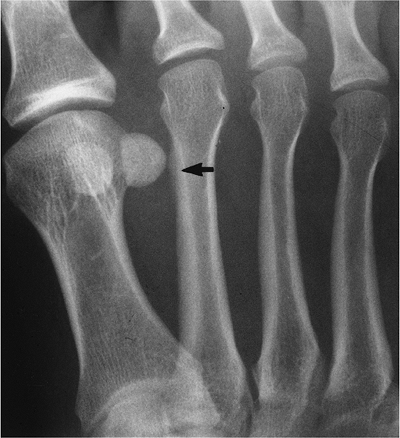
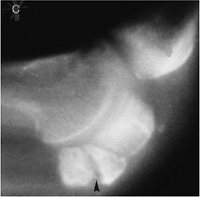
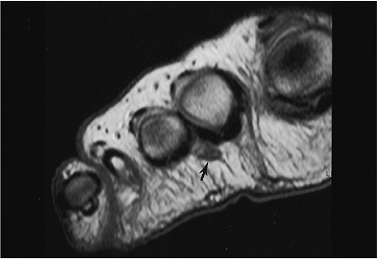
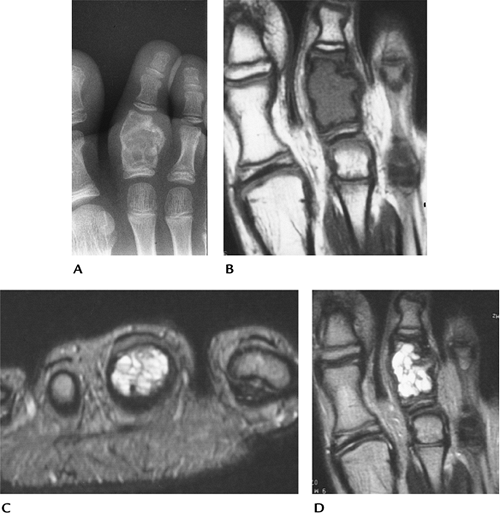
FIGURE 6-67 Aneurysmal bone cyst. (A) Radiograph showing an expanding lesion of the second proximal phalanx. Coronal T1-weighted (B) and axial (C) and coronal (D) T2-weighted images showing a septated lesion with fluid–fluid levels on the axial image (C).
|
Suggested Reading
Johnston MR. Epidemiology of soft-tissue and bone tumors of the foot. Clin Podiatr Med Surg 1993;10:581–607.
Unni KK. Dahlin’s bone tumors: General aspects and data on 11,087 cases. Philadelphia: Lippincott-Raven; 1996.
P.391
Neoplasms/Tumorlike Conditions: Skeletal Lesions—Malignant
Key Facts
-
Malignant skeletal lesions in the foot
and ankle are uncommon. Metastases are rare (0.007% to 0.3% of skeletal
metastases). Myeloma involves the foot and ankle in 0.2% of patients. -
Malignant skeletal lesions seen in the foot and ankle are as follows:
Neoplasm Total/No. in Foot and Ankle/% in Foot and Ankle Osteosarcoma 1649/62/3.7% Ewing sarcoma 512/43/8.3% Chondrosarcoma 895/32/3.5% Hemangioendothelial sarcoma 80/13/16.3% Fibrosarcoma 255/11/4.3% Lymphoma 694/12/1.7% Adamantinoma 34/6/17.6% -
Imaging of the malignant skeletal lesions
begins with routine radiographs. Features on radiographs are most
useful for characterizing the malignant nature and histology of the
lesion. -
CT and MRI are most useful for evaluating the extent of lesions and for staging.
P.392
P.393
 |
|
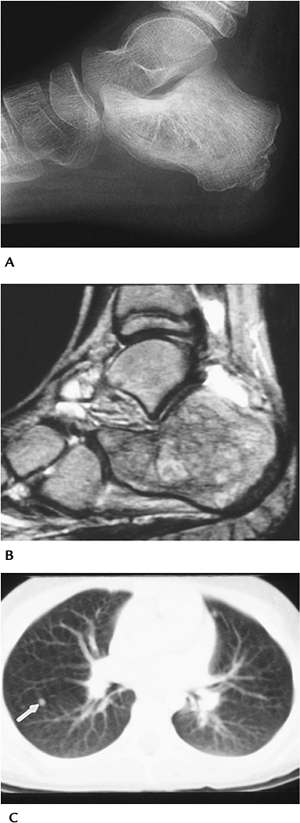
FIGURE 6-68 Ewing sarcoma of calcaneus. (A) Routine lateral radiograph showing bone sclerosis. (B) Sagittal T2-weighted image showing irregular signal intensity with joint fluid. Ewing sarcoma of calcaneus. (A) Routine lateral radiograph showing bone sclerosis. (B) Sagittal T2-weighted image showing irregular signal intensity with joint fluid. (C) CT of chest showing a metastatic nodule (arrow).
|
Suggested Reading
Unni KK. Dahlin’s bone tumors: General aspects and data on 11,087 cases. Philadelphia: Lippincott-Raven; 1996.
P.394
Neoplasms/Tumorlike Conditions: Soft Tissue Lesions—Benign
Key Facts
-
Soft tissue masses are more common than skeletal neoplasms in the foot and ankle.
-
Benign soft tissue lesions are much more common than malignant lesions (87% benign, 13% malignant).
-
Common benign lesions in the foot and
ankle include lipomas, hemangiomas, fibromatosis, ganglion cysts,
neuromas, and giant cell tumors of the tendon sheath. -
Radiographs have limited value for
characterizing soft tissue lesions. MRI and ultrasound (cystic vs.
solid) are most useful. MRI is superior for characterizing the nature
of the lesion.
P.395
 |
|
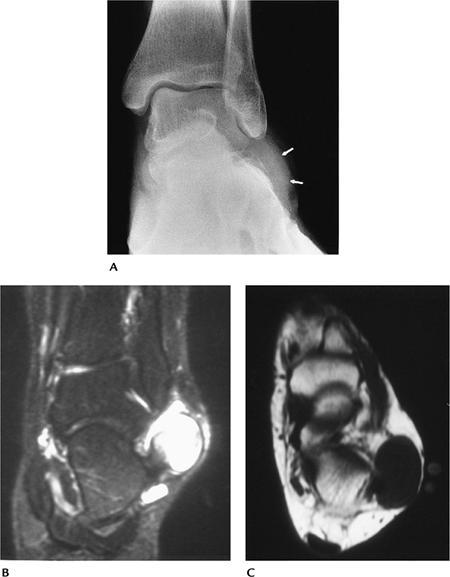
FIGURE 6-69 Peroneal tendon ganglion cyst. (A) Radiograph showing focal lateral swelling (arrows). Coronal T2-weighted (B) and axial T1-weighted (C) images showing a homogenous low-intensity lesion on T1-weighted image (C) and high-intensity lesion on T2-weighted (B) images.
|
Suggested Reading
Kirby SJ, Shereff MJ, Lewis MM. Soft tissue tumors and tumor-like conditions of the foot. Analysis of 83 cases. J Bone Joint Surg 1989;71A:621–626.
P.396
Neoplasms/Tumorlike Conditions: Soft Tissue Lesions—Malignant
Key Facts
-
Soft tissue malignancies in the foot and ankle are uncommon.
-
Malignant soft tissue tumors in the foot and ankle include
-
Synovial sarcoma
-
Clear cell sarcoma
-
Liposarcoma
-
Angiosarcoma
-
Hemangiopericytoma
-
-
MRI is the technique of choice for
evaluating soft tissue malignancies. Typically, malignant lesions have
inhomogeneous signal intensity (T2-weighted sequence) and irregular
margins, and they can encase neurovascular structures and bone.
 |
|
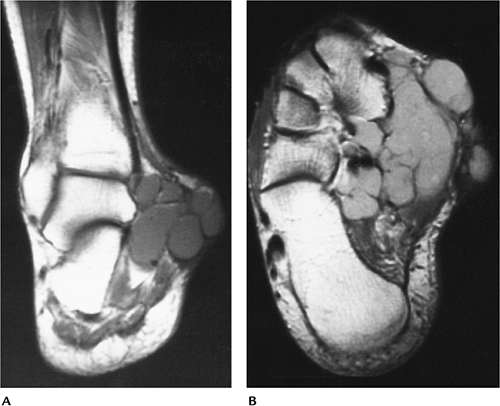
FIGURE 6-70 Synovial sarcoma. Coronal T1-weighted (A) and axial proton density (B) images showing a multicystic loculated lesion that could be confused with a benign process.
|
Suggested Reading
Weiss SW, Goldblum JR. Enzinger and Weiss’s soft tissue tumors. 4th ed. St. Louis, Mosby; 2001.
P.397
Arthritis: Osteoarthritis (Degenerative Joint Disease)
Key Facts
-
Radiographic features of osteoarthritis
include increased bone density, osteophyte formation, subchondral
sclerosis, asymmetric joint space narrowing, subchondral cysts, and
loose bodies. -
The ankle, midfoot, and first MTP joints are affected most frequently.
-
Calcaneal osteophytes at the Achilles
insertion and plantar aponeurosis attachments are common. These are
well defined compared with changes described later in Reiter syndrome.
P.398
 |
|
FIGURE 6-71
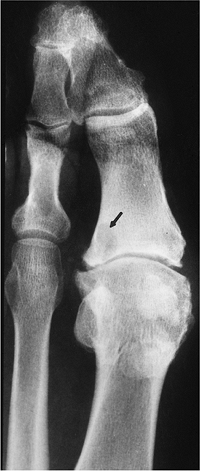
AP view of the forefoot showing osteoarthritis of the first MTP joint with asymmetric joint space narrowing, bone sclerosis, and a subchondral cyst (arrow). |
Suggested Reading
Bancroft LW, McLeod RA. Arthritis. In Berquist TH, ed. Radiology of the foot and ankle, 2nd ed. Philadelphia: Lippincott Williams & Wilkins; 2000:281–314.
P.399
Arthritis: Rheumatoid Arthritis
Key Facts
-
The foot is an early site of involvement in rheumatoid arthritis. The foot is involved in 90% of patients.
-
The condition is symmetric and has
characteristic joint distribution. The lateral aspect of the fifth MTP
joint frequently is involved first. The interphalangeal joint of the
great toe is commonly involved. The distal interphalangeal joints are
spared. -
Proximal joints of the foot and ankle
also may be affected with osteopenia joint space narrowing and, when
present, ill-defined marginal erosions. -
Inflammatory changes in synovium, capsules, and ligaments may lead to subluxation.
-
Subcutaneous rheumatoid nodules can occur, but only 1% involve the feet.
P.400
 |
|
FIGURE 6-72 Rheumatoid arthritis limited to the fifth MTP joint (arrow) (A) and involving all MTP joints with erosions and joint subluxation (B).
|
Suggested Reading
Bancroft LW, McLeod RA. Arthritis. In: Berquist TH, ed. Radiology of the foot and ankle, 2nd ed. Philadelphia: Lippincott Williams & Wilkins; 2000:281–314.
P.401
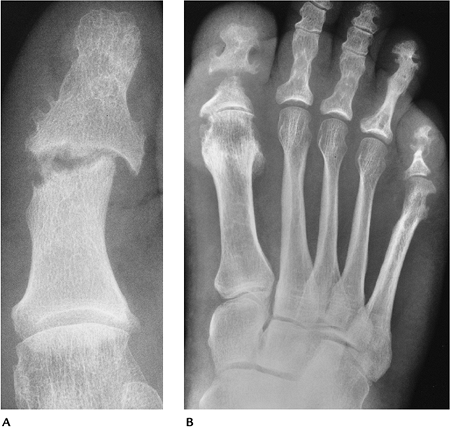
Arthritis: Psoriatic Arthritis
Key Facts
-
Psoriatic arthritis involves the hands
and feet equally, is asymmetric, and involves the distal
interphalangeal joints with joint space widening, tuft erosion, and
phalangeal ankylosis. Bone density is increased. -
Three to five percent of patients with psoriasis develop arthropathy. In most, skin changes precede arthropathy.
-
Calcaneal changes may occur similar to Reiter syndrome and ankylosing spondylitis.
-
In some patients, arthropathy resembles rheumatoid arthritis.
 |
|
FIGURE 6-73 (A)
AP view of the great toe with asymmetric joint destruction and bone proliferation at the base of the distal phalanx characteristic of seronegative spondyloarthropathies. (B) Characteristic swelling and joint space changes in the great toe with ankylosis of the fourth toe caused by psoriatic arthritis. |
Suggested Reading
Avila R, Pugh DG, Slocumb CH, et al. Psoriatic arthritis. A roentgenologic study. Radiology 1960;75:691–701.
P.402
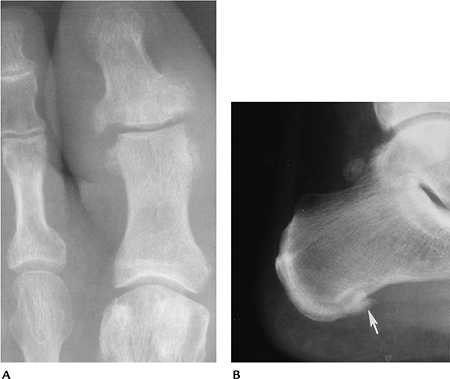
Arthritis: Reiter Syndrome
Key Facts
-
Reiter syndrome involves the feet and, unlike psoriatic arthritis, spares the hands.
-
Key areas of involvement include the calcaneus, phalangeal joints, and sacroiliac joint.
-
Reiter syndrome usually is seen after a genitourinary infection. Arthropathy typically begins 2 to 4 weeks after infection.
-
Approximately one third of patients
present with the classic triad of urethritis, conjunctivitis, and
arthritis. Forty percent of patients develop arthritis. -
Erosions with bone proliferation differentiate Reiter syndrome from rheumatoid arthritis.
-
Phalangeal involvement, especially the great toe, is common.
-
Calcaneal features are characteristic. Swelling, erosion, and osseous proliferation occur, usually at the plantar aspect.
 |
|
FIGURE 6-74 (A) Sausage digit in Reiter syndrome. Characteristic diffuse swelling with erosions and proliferation of the distal joint. (B) Poorly defined spur (arrow) and swelling at the plantar aspect of the calcaneus caused by Reiter syndrome.
|
Suggested Reading
Peterson CC, Silbiger ML. Reiter’s syndrome and psoriatic arthritis. Their roentgen spectra and some interesting similarities. AJR Am J Roentgenol 1967;101:860–871.
P.403
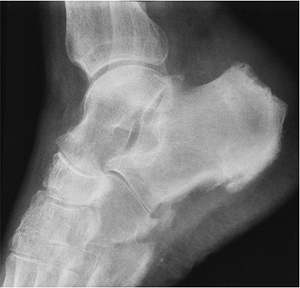
Arthritis: Ankylosing Spondylitis
Key Facts
-
Ankylosing spondylitis involves both sacroiliac joints. There is asymmetric oligoarthropathy and calcaneal involvement.
-
Males 15 to 40 years of age are most commonly affected.
-
Peripheral joint involvement is most common in the hip and shoulder and is seen in 5% to 50% of patients.
-
In the foot, ankylosing spondylitis involves the MTP, first tarsometatarsal, and interphalangeal joints.
-
Calcaneal involvement is common when the foot is involved. Changes are similar to those in Reiter syndrome.
 |
|
FIGURE 6-75 Poorly defined proliferative changes in the posterior and plantar aspects of the calcaneus caused by ankylosing spondylitis.
|
Suggested Reading
El-Khoury FV, Kathol MH, Brandser EA. Seronegative spondyloarthropathies. Radiol Clin North Am 1996;34:343–357.
P.404
Arthritis: Neurotrophic Arthropathy
Key Facts
-
Neurotrophic arthropathy is caused by repetitive trauma secondary to sensory impairment.
-
Disorders may be the result of central
(syphilis or meningomyelocele), peripheral (diabetes), or congenital
insensitivity to pain. -
The condition is most common in diabetics and involves the ankle (11%), hindfoot (24%), midfoot (30%), and forefoot (34%).
-
Neurotrophic arthropathy may be atrophic
or hypertrophic. Bone sclerosis and degenerative changes predominate in
the latter. The atrophic or osteopenic form is more common in the
forefoot. -
Atrophic or resorptive form is more difficult to differentiate from osteomyelitis.
-
Differentiation of neuropathic
arthropathy from osteomyelitis may require combined radionuclide scans,
positron emission tomography, or MRI with contrast enhancement.
 |
|
FIGURE 6-76 AP (A) and lateral (B) radiographs showing characteristic fragmentation in the midfoot as the result of neurotrophic arthritis.
|
Suggested Reading
Cofield
RH, Morrison MJ, Beabout JW. Diabetic neuropathy in the foot. Patient
characteristics and patterns of radiographic change. Foot Ankle 1983;4:15–22.
RH, Morrison MJ, Beabout JW. Diabetic neuropathy in the foot. Patient
characteristics and patterns of radiographic change. Foot Ankle 1983;4:15–22.
Moore TE, Yuh WTC, Kathol MH, et al. Abnormalities of the foot in patients with diabetes mellitus: Findings on MR imaging. AJR Am J Roentgenol 1991;157:813–816.
P.405
Arthritis: Gout
Key Facts
-
Gout is a common self-limited inflammatory arthropathy.
-
The arthropathy is most common in the lower extremities; 85% involve the foot.
-
Radiographic features include soft tissue swelling, tophi, and well-defined cortical erosions with overhanging margins.
-
Chronic gout results in deposition of monosodium urate crystals in synovial fluid, synovium, and periarticular tissues.
-
Involved digits demonstrate asymmetric swelling and joint involvement.
 |
|
FIGURE 6-77
Gout. Extensive erosive changes in the first MTP joint, primarily the metatarsal head. Note the tophaceous soft tissue mass medially. |
Suggested Reading
Ya JS, Chung C, Recht M, et al. MR imaging of tophaceous gout. AJR Am J Roentgenol 1997;168: 523–527.
P.406
Arthritis: Calcium Pyrophosphate Deposition Disease
Key Facts
-
Calcium pyrophosphate deposition disease
results in joint pain and calcification in fibrocartilage, hyaline
cartilage, and periarticular soft tissues. -
Subchondral cystic changes are common and degenerative changes predominate.
-
Calcium pyrophosphate deposition disease does not commonly involve the foot and ankle.
-
Changes on radiographs or CT include degenerative change and subtle to gross calcifications.
 |
|
FIGURE 6-78 CT of ankle. Coronal CT image demonstrating cartilage calcification.
|
Suggested Reading
Pascual E. The diagnosis of gout and CPPD arthropathy. Br J Rheumatol 1996;35:306–308.
P.407
Infection: Osteomyelitis
Key Facts
-
Osteomyelitis is an infection involving the bone.
-
Osteomyelitis may involve patients of any
age. The route of infection may be hematogenous (children and older
adults, calcaneus most commonly involved), direct extension from soft
tissue infection or puncture wounds, or secondary to previous surgical
procedures. -
Imaging of infections depends on suspected site (bone or soft tissue) and clinical condition.
Technique Applications CT Subtle cortical destruction
Cloacae
Sequestra
Gas in soft tissuesMRI Early subtle changes in marrow, soft tissues, tendon sheaths, bursae, and fascia Ultrasound Joint fluid
Fluid collections in soft tissuesRadionuclide scans Early bone involvement
(technetium-99m methylene diphosphate, gallium-67, indium-111 white
blood cells, Tc-99m white blood cells)Positron emission tomography Subtle postoperative infections -
Confirmation of organism may require bone biopsy.
-
Staphylococcus aureus is commonly isolated. Puncture wounds may result in organisms found in the soil (i.e., Pseudomonas aeruginosa).
P.408
 |
|
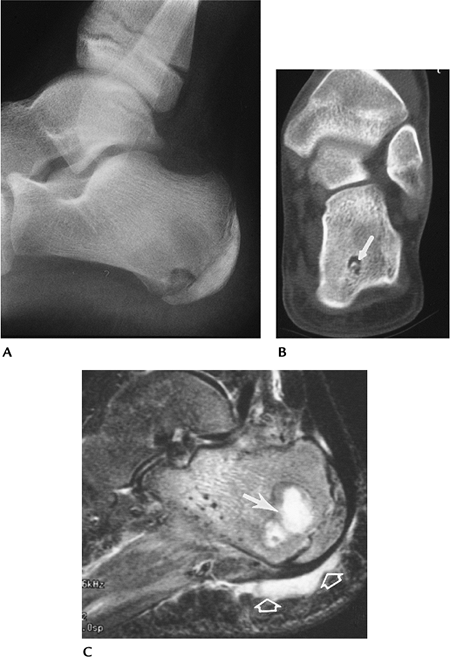
FIGURE 6-79 Osteomyelitis. (A) Lateral radiograph of the calcaneus shows lytic changes posteriorly. (B) Coronal CT image demonstrates a sequestrum (arrow) in the area of infection. (C) Sagittal T2-weighted MR image shows areas of bone infection (arrow) and fluid in the soft tissues (open arrows).
|
Suggested Reading
Ledermann
HP, Morrison WB, Schweitzer ME. MR image analysis of pedal
osteomyelitis: Distribution, patterns of spread, and frequency of
associated ulceration and septic arthritis. Radiology 2002;223:747–755.
HP, Morrison WB, Schweitzer ME. MR image analysis of pedal
osteomyelitis: Distribution, patterns of spread, and frequency of
associated ulceration and septic arthritis. Radiology 2002;223:747–755.
P.409
Infection: Soft Tissue Infection
Key Facts
-
Soft tissue infection may involve
distinct regions, such as tendon sheaths, bursae, or fascia. Infections
may extend to involve bone. -
Soft tissue infections of the foot and
ankle are particularly common in children with bare feet and adults
with ischemic disease or diabetes mellitus. -
Necrotizing fasciitis is an uncommon, but
serious, soft tissue infection. Older patients with pre-existing
conditions are most commonly affected. Seventy-five percent have mixed
staphylococcal and streptococcal infections. -
Imaging of soft tissue infections can be
accomplished with CT, contrast-enhanced MRI, or ultrasound. CT is most
useful for detecting fascial changes and gas in the soft tissues in
necrotizing fasciitis.
 |
|
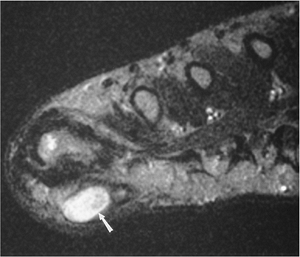
FIGURE 6-80 Axial T2-weighted MR image demonstrating an abscess (arrow) after puncture wound to the foot.
|
Suggested Reading
Laughlin JT, Armstrong DG, Corporusso J, et al. Soft tissue and bone infection after puncture wounds in children. West J Med 1997;166:126–128.
Ledermann
HP, Morrison WB, Schweitzer ME. Is soft tissue inflammation in pedal
infections contained by fascial planes? Analysis of compartmental
involvement in 115 feet. AJR Am J Roentgenol 2002;178:605–612.
HP, Morrison WB, Schweitzer ME. Is soft tissue inflammation in pedal
infections contained by fascial planes? Analysis of compartmental
involvement in 115 feet. AJR Am J Roentgenol 2002;178:605–612.
P.410
Infection: Joint Space Infection
Key Facts
-
Joint space infections are most often caused by S. aureus.
-
Infections are most common in children.
Patients taking steroids or with debilitating illnesses also have an
increased incidence of joint space infection. -
Infections may be hematogenous, occur by puncture wound or direct extension from bone, or result from previous surgery.
-
The earliest image findings are swelling
and joint effusion. Early bone changes are most easily appreciated with
radionuclide scans or MRI. -
Joint aspiration or synovial biopsy may
be required to define the organism. Aspiration/biopsy can be
accomplished with ultrasound or fluoroscopic guidance.
 |
|
FIGURE 6-81 Joint space infection. (A) Coronal T2-weighted image showing a joint effusion with two areas of bone involvement (arrowheads). (B) Sagittal T1-weighted image showing abnormal signal intensity (arrowhead) from infection extending from the joint.
|
Suggested Reading
Brower AC. Septic arthritis. Radiol Clin North Am 1996;34:293–310.
P.411
Infection: Diabetic Foot
Key Facts
-
Diabetic foot disorders result in more hospitalizations than other diabetic complications.
-
Up to 6% of diabetic persons undergo amputation because of infection and/or ischemic disease.
-
Ulcerations tend to occur over pressure
points (heel, metatarsal heads, tips of toes) on the foot. More than
90% of cases of osteomyelitis in the diabetic foot result from
contiguous spread from infected ulcers. -
Infection may be difficult to differentiate from neurotrophic arthropathy, especially the atrophic or osteopenic type.
-
Table 6-6 presents imaging approaches to infection in the diabetic foot.
|
TABLE 6-6 DIABETIC FOOT INFECTIONS: IMAGING APPROACHES
|
|||||||||||||||||||||||||||||||||||||||||||||
|---|---|---|---|---|---|---|---|---|---|---|---|---|---|---|---|---|---|---|---|---|---|---|---|---|---|---|---|---|---|---|---|---|---|---|---|---|---|---|---|---|---|---|---|---|---|
|
|||||||||||||||||||||||||||||||||||||||||||||
P.412
 |
|
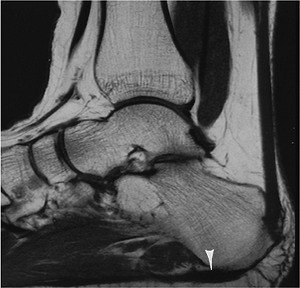
FIGURE 6-82 Diabetic patient with heel ulcer (open arrow) and abnormal signal intensity in the calcaneus caused by osteomyelitis.
|
Suggested Reading
Lipsky BA, Pecasaro RE, Wheat LJ. The diabetic foot: Soft tissue and bone infection. Infect Dis Clin North Am 1990;4:409–432.
Morrison
WB, Schweitzer ME, Wapner KL, et al. Osteomyelitis in feet of
diabetics: Clinical accuracy, surgical utility, and cost effectiveness
of MR imaging. Radiology 1995;196:557–564.
WB, Schweitzer ME, Wapner KL, et al. Osteomyelitis in feet of
diabetics: Clinical accuracy, surgical utility, and cost effectiveness
of MR imaging. Radiology 1995;196:557–564.
P.413
Pediatric Disorders: Terminology
| Term | Definition |
|---|---|
| Talipes | Congenital deformity of the foot |
| Pes | Acquired deformity of the foot |
| Valgus | Orientation of bones distal to a joint away from the midline |
| Varus | Orientation of bones distal to a joint toward the midline |
| Adduction | Displacement of bones or anatomic part in transverse plane toward the axis of the body |
| Abduction | Displacement of bones or anatomic part in a transverse plane away from the axis of the body |
| Equinus | Fixed plantar flexion of the foot |
| Calcaneus | Fixed dorsiflexion of the foot |
| Cavus | Raised longitudinal arch |
| Planus | Flattened longitudinal arch |
Pediatric Disorders: Normal Angles of the Foot and Ankle
Key Facts
-
AP talocalcaneal angle
-
Newborn 40 degrees (range 25–55 degrees)
-
-
Lateral talocalcaneal angle
-
40 degrees (range 25–55 degrees)
-
-
Talo–first metatarsal angle
-
Newborn 20 degrees (range 9–31 degrees)
-
-
Tibiocalcaneal angle
-
Newborn 75 degrees
-
6 years 65 degrees
-
-
Lateral longitudinal arch
-
150 to 175 degrees
-
Pes cavus ≤150 degrees
-
Pes planus >175 degrees
-
P.414
 |
|
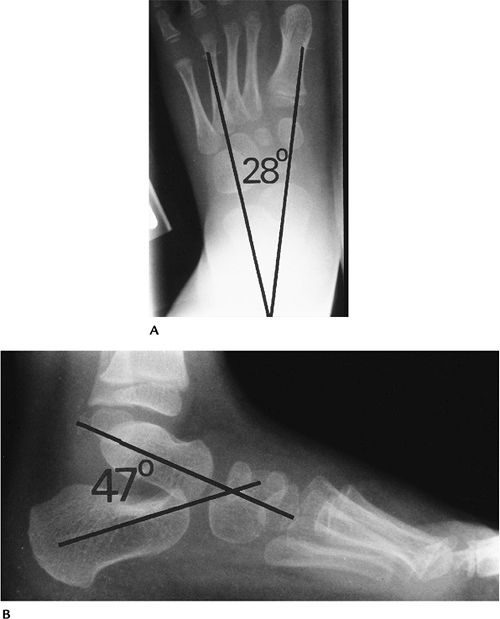
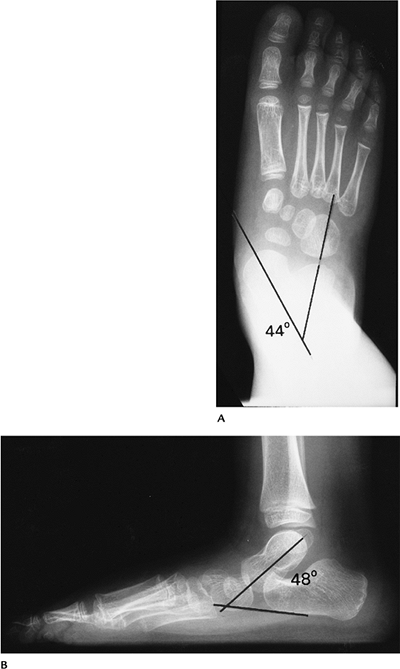
FIGURE 6-83 Normal simulated weight-bearing views of the pediatric foot. Normal AP (A) and lateral (B) talocalcaneal angles are 28 degrees (range 25–55 degrees) and 47 degrees (range 25–55 degrees), respectively.
|
P.415
 |
|
FIGURE 6-84
Lateral talo–first metatarsal angle is 10 degrees (range 9–31 degrees). Measured by lines along talar and first metatarsal axes. |
 |
|
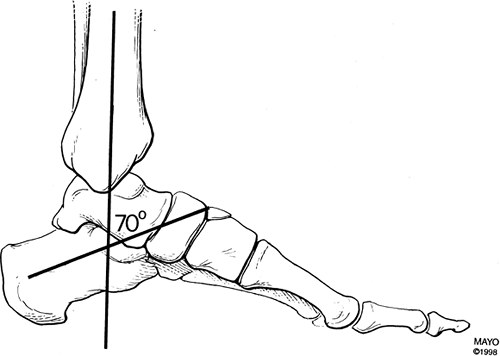
FIGURE 6-85
Tibiocalcaneal angle measured by lines along the tibial and calcaneal axes. In this case, 70 degrees; newborn 75 degrees; 6 years 65 degrees. |
P.416
 |
|
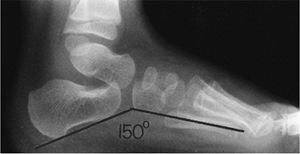
FIGURE 6-86 Longitudinal plantar arch angle measured by lines at the calcaneus and fifth metatarsal. Normal 150 to 170 degrees.
|
Suggested Reading
Vander Wilde R, Staheli LT, Chew DE, et al. Measurements on radiographs of the foot in normal infants and children. J Bone Joint Surg 1998;70A:407–415.
P.417
Pediatric Disorders: Hindfoot Abnormalities
Key Facts
-
Hindfoot valgus includes a group of
disorders where the calcaneus is abducted and the distal bones move
laterally. The talocalcaneal angle is increased on AP and lateral
radiographs. Causes include congenital vertical talus, talipes
calcaneovalgus, and neuromuscular disorders. -
Hindfoot varus includes talipes
equinovarus (clubfoot) and various neuromuscular disorders. The
talocalcaneal angle is decreased on AP and lateral radiographs. When
ossified, the navicular lies medial to the long axis of the talus. -
Hindfoot equinus shows plantar flexion of
the foot or declination of the calcaneus. The tibiocalcaneal angle is
greater than 90 degrees. This disorder is seen with clubfoot,
congenital vertical talus, and neuromuscular disorders. -
Hindfoot calcaneus is a group of
disorders resulting in increased calcaneal inclination or dorsiflexion.
The anterior tibiocalcaneal angle is less than 65 degrees. Pes cavus is
commonly associated with hindfoot calcaneus.
P.418
 |
|
FIGURE 6-87 Hindfoot valgus. (A)
AP radiograph showing an increased talocalcaneal angle with the long axis of the talus directed medial to the navicular and first metatarsal. (B) Lateral view showing an increased angle with midfoot incongruency. |
P.419
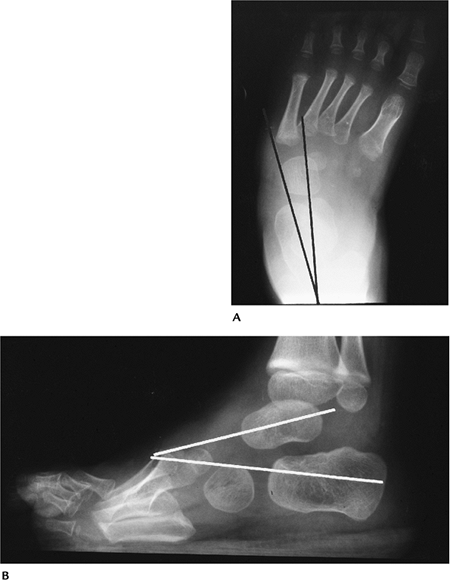 |
|
FIGURE 6-88 Hindfoot varus. (A) AP radiograph showing a decreased talocalcaneal angle with metatarsus adductus. (B) Lateral radiograph showing a decreased talocalcaneal angle.
|
P.420
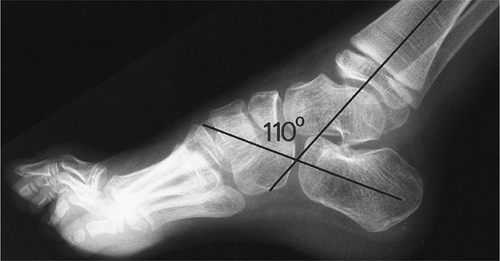 |
|
FIGURE 6-89 Hindfoot equinus. The foot is plantar flexed with tibiocalcaneal angle greater than 90 degrees (in this case, 110 degrees).
|
Suggested Reading
Ozonoff MB. Pediatric orthopedic radiology. Philadelphia: WB Saunders; 1992:397–460.
P.421
Pediatric Disorders: Plantar Arch Abnormalities
Key Facts
-
Pes planus (flatfoot) results with
decreased calcaneal inclination. The normal arch is lost with a
calcaneal–fifth metatarsal angle exceeding 175 degrees. Flatfoot may be
flexible or rigid (often associated with tarsal coalition). “Rocker
bottom” deformity occurs when the calcaneal–fifth metatarsal angle
exceeds 180 degrees. -
Pes cavus is an increased longitudinal
arch with increased calcaneal inclination. Pes cavus is associated with
neuromuscular disorders and peroneal muscle atrophy. Pes cavus can be
associated with forefoot adduction and hindfoot varus (pes cavo varus).
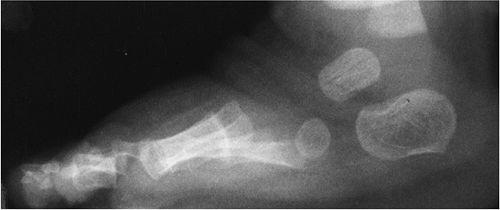 |
|
FIGURE 6-90 Lateral radiograph demonstrating pes planus with talo–fifth metatarsal angle greater than 175 degrees.
|
P.422
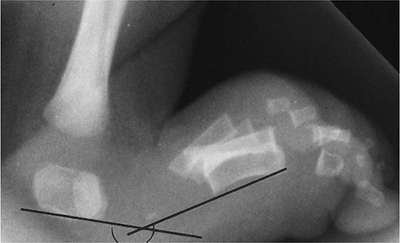 |
|
FIGURE 6-91 “Rocker bottom” deformity with calcaneal–fifth metatarsal angle greater than 180 degrees.
|
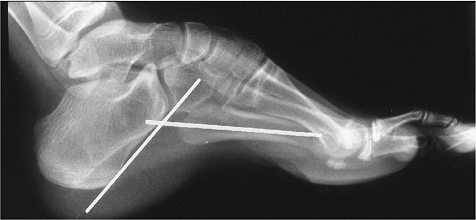 |
|
FIGURE 6-92
Pes cavus with increased calcaneal dorsiflexion and plantar flexion of the metatarsals. Calcaneal–fifth metatarsal angle is less than 150 degrees. |
Suggested Reading
Vander Wilde R, Staheli LT, Chew DE, et al. Measurements on radiographs of the foot in normal infants and children. J Bone Joint Surg 1988;70A:407–415.
P.423
Pediatric Disorders: Forefoot Abnormalities
Key Facts
-
Metatarsus adductus (medial deviation of
the forefoot) is the most common childhood foot deformity. The
condition may be associated with midfoot and hindfoot disorders. There
is no sex predilection; 50% are unilateral. The condition may be
asymptomatic and resolve spontaneously. -
Skewfoot (hooked foot or “Z” foot)
presents with forefoot adduction and associated deformities, such as
hindfoot valgus, forefoot varus, or pes cavus.
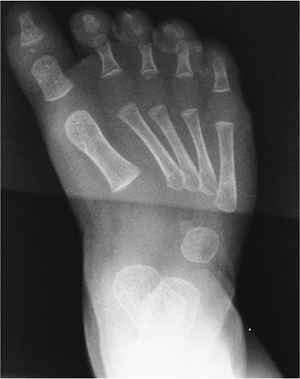 |
|
FIGURE 6-93 AP radiograph demonstrating metatarsus adductus with hindfoot valgus.
|
P.424
 |
|
FIGURE 6-94 AP radiograph of a patient with skewfoot (hooked or “Z” foot).
|
Suggested Reading
Hubbard AM, Davidson RS, Meyer JS, et al. Magnetic resonance imaging of skewfoot. J Bone Joint Surg 1996;78A:389–397.
P.425
Pediatric Disorders: Talipes Equinovarus
Key Facts
-
Talipes equinovarus (clubfoot) consists
of hindfoot equinus, hindfoot varus, and forefoot adductus. The
incidence is 1 to 1.5 per 1,000 births. Males outnumber females 2:1. -
The condition may be congenital or acquired.
Congenital Acquired Idiopathic Polio Meningocele Cerebral palsy Myelomeningocele Sciatic nerve injury Diastematomyelia Vascular compromise Abnormal muscle insertions Tarsal anomalies -
Talipes equinovarus is seen in 30% of children with spina bifida and in 12% to 56% of children with constriction bands.
-
Routine radiographs usually demonstrate the abnormalities. MRI is useful for unossified structures and muscle anomalies.
-
Conservative therapy with manipulation
and casting in newborns is attempted initially. Surgical release is
considered when this fails.
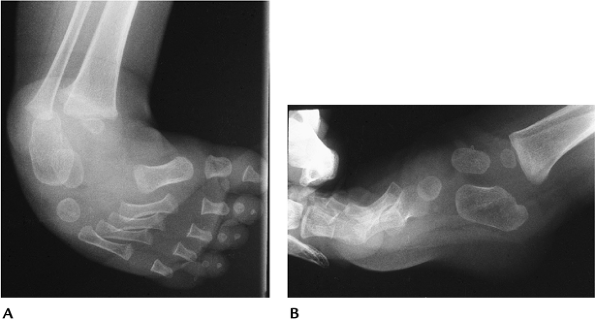 |
|
FIGURE 6-95 AP (A) and lateral (B) radiographs showing hindfoot equinus, hindfoot varus, and forefoot adductus.
|
Suggested Reading
Hersh A. The role of surgery in treatment of clubfoot. Foot Ankle Int 1995;16:672–681.
P.426
Pediatric Disorders: Congenital Vertical Talus
Key Facts
-
Congenital vertical talus consists of
dorsal and lateral articulation with the navicular with a vertically
oriented talus and flatfoot deformity. -
The condition is not reducible and may be unilateral or bilateral.
-
The condition often is seen with arthrogryposis or myelomeningocele.
-
Radiographs demonstrate hindfoot valgus on the AP view and plantar flexion of the calcaneus and talus on the lateral view.
-
Surgical release and K-wire fixation is generally required for treatment.
P.427
 |
|
FIGURE 6-96 Congenital vertical talus. (A) AP radiographs showing hindfoot valgus (lines) greater on the right. (B) Lateral radiographs showing vertically oriented tali (lines) and calcaneal plantar flexion with flatfoot deformities.
|
Suggested Reading
Naptiontek M. Congenital vertical talus: a critical review of 32 feet operated by peritalar reduction. J Pediatr Orthop 1995;4:179–185.
P.428
Pediatric Disorders: Pes Planovalgus
Key Facts
-
Pes planovalgus (flexible flatfoot
deformity) presents with an increased talocalcaneal angle, hindfoot
valgus, and forefoot abduction. -
The longitudinal and transverse arches flatten so the metatarsals appear parallel on AP radiographs.
-
The condition is flexible, painless, and the result of ligament laxity.
-
The disorder is familial and often bilateral.
-
Surgery is reserved for patients who become symptomatic or when orthotics fail.
P.429
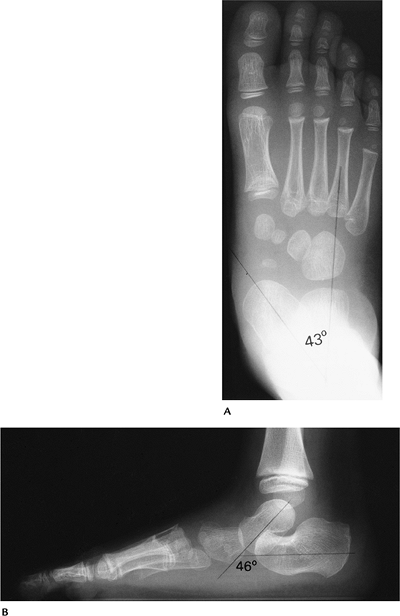 |
|
FIGURE 6-97 Pes planovalgus (flexible flatfoot). (A)
AP radiograph showing an increased talocalcaneal angle with lateral subluxation of the navicular. The forefoot is abducted and metatarsals parallel. (B) Lateral radiograph showing arch collapse with increased talocalcaneal angle. |
Suggested Reading
Ozonoff MB. Pediatric orthopedic radiology. Philadelphia: WB Saunders; 1992:397–460.
P.430
Pediatric Disorders: Tarsal Coalitions
Key Facts
-
Tarsal coalitions are abnormal fibrous, cartilaginous, or bony bars between the tarsal bones.
-
The condition may be congenital or acquired (infection, trauma, surgery).
-
Calcaneonavicular coalitions are most
common. The condition may be bilateral and asymptomatic or associated
with rigid flatfoot. Talar beaking may be associated. -
Talocalcaneal coalitions are more common
in males and bilateral in 20% to 25%. The midsubtalar joint is
difficult to see, and talar beaking may be present. -
Calcaneocuboid coalitions are rare.
-
Imaging may be accomplished with routine
radiographs (oblique view best for calcaneonavicular coalitions), CT,
or MRI. CT is used to define the extent of the coalition. MRI can
differentiate fibrous, cartilaginous, and osseous coalitions.
P.431
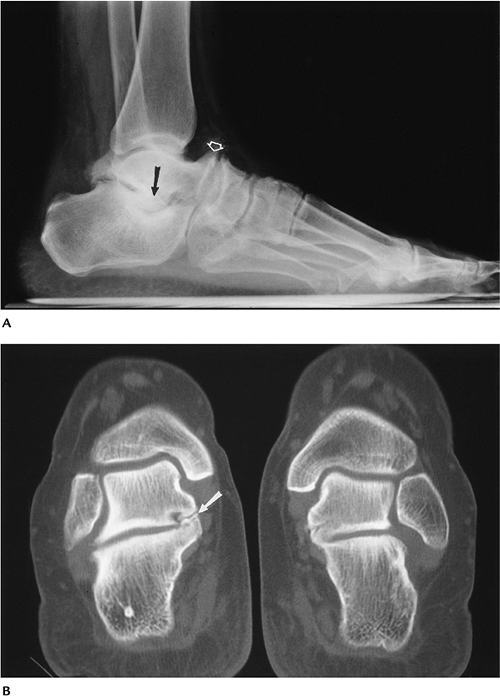 |
|
FIGURE 6-98 Talocalcaneal coalition. (A) Lateral radiograph showing flatfoot deformity with osseous density (arrow) in the midsubtalar joint and a prominent talar beak (open arrow). (B) Coronal CT image confirms the coalition (arrow).
|
P.432
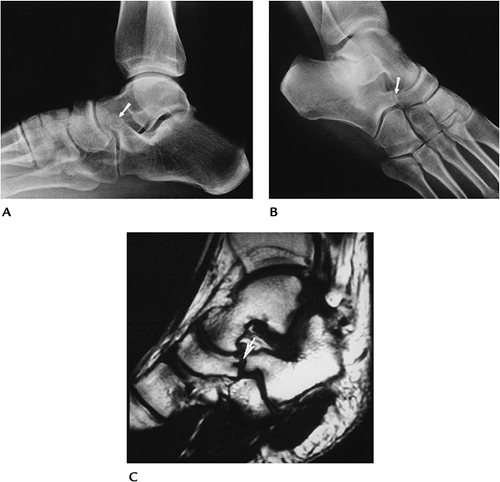 |
|
FIGURE 6-99 Calcaneonavicular fibrous coalition. Lateral (A) and oblique (B) radiographs showing elongation of the anterior calcaneal process (arrow). The coalition (arrow) is best seen on the oblique view. (C) Oblique sagittal T1-weighted MR image showing low intensity between the navicular and calcaneus (arrow) consistent with fibrous tissue.
|
Suggested Reading
Newman SJ, Newberg AH. Congenital tarsal coalition: Multimodality evaluation with emphasis on CT and MR imaging. Radiographics 2000;20:321–332.
P.433
Pediatric Disorders: Overgrowth/Hypoplasia/Aplasia
Key Facts
-
Macrodactyly:
Overgrowth of soft tissues or osseous structures may be generalized or
focal. In the foot, all structures in one or more digits may be
affected. The condition may be idiopathic or associated with
hemangiomas, arteriovenous malformations, or neurofibromatosis. -
Bradydactyly:
Abnormal shortening of the toes. Digits and phalanges affected are
variable. Bradydactyly may be associated with trisomy 13 and 18, fetal
alcohol syndrome, and certain mucopolysaccharidoses. -
Syndactyly:
Lack of differentiation between two or more digits. The condition may
involve only soft tissues or soft tissue and bone. Males are affected
more often than females. The condition may be isolated or associated
with conditions such as Apert syndrome, Poland syndrome, and mesomelic
dysplasia. -
Polydactyly:
Common, resulting in supernumerary digits or metatarsals. The condition
is seen in 1.7 per 1,000 births and is bilateral in 25% to 50%. It
usually is an isolated condition, but 15% are associated with other
congenital anomalies.
 |
|
FIGURE 6-100 Macrodactyly. AP radiographs showing increased size of the right toes.
|
P.434
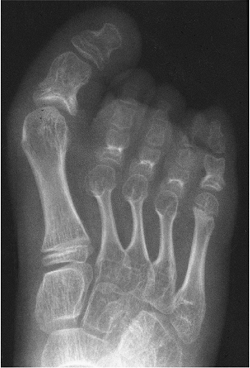 |
|
FIGURE 6-101 Bradydactyly. AP radiograph showing generalized shortening of the second to fourth rays.
|
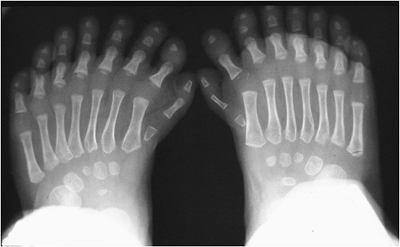 |
|
FIGURE 6-102 Polydactyly. AP radiographs showing bilateral supernumerary metatarsals and digits.
|
Suggested Reading
Taybi H, Lachman RS. Radiology of syndromes, metabolic disorders, and skeletal dysplasias. St. Louis: CV Mosby-Yearbook; 1996.
P.435
Pediatric Disorders: Freiberg Infraction
Key Facts
-
Freiberg infraction is posttraumatic
osteonecrosis of the metatarsal head. The condition is three to four
times more common in females than males. -
Patients present in late childhood or adolescence. The condition is bilateral in 10%.
-
The second metatarsal is involved most often, followed by the third and fourth metatarsal heads.
-
Radiographs demonstrate flattening of the metatarsal head with sclerosis and fragmentation.
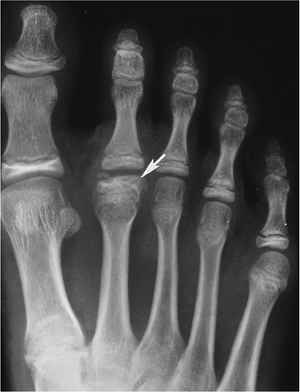 |
|
FIGURE 6-103 Freiberg infraction. AP radiograph showing a flattened sclerotic second metatarsal head (arrow).
|
Suggested Reading
Smillie IS. Freiberg’s infraction (Kohler’s second disease). J Bone Joint Surg 1957;39B:580.
P.436
Pediatric Disorders: Köhler Disease
Key Facts
-
Köhler disease is an osteochondrosis of the navicular.
-
Patients present at 5 years of age. Males outnumber females 6:1.
-
Patients have pain, swelling, and local tenderness.
-
It may be difficult to differentiate this process from normal variants in appearance of the navicular.
-
Radiographs demonstrate a flattened, sclerotic, fragmented navicular. Radionuclide scans may demonstrate a photopenic region.
-
The navicular returns to normal or near-normal configuration over 3 to 4 months, regardless of treatment.
P.437
 |
|
FIGURE 6-104 Köhler disease. AP (A) and lateral (B) radiographs showing a sclerotic flattened navicular (arrow).
|