
Editors: Berquist, Thomas H.
Title: Musculoskeletal Imaging Companion, 2nd Edition
Copyright ©2007 Lippincott Williams & Wilkins
> Table of Contents > Chapter 14 – Metabolic Diseases
Chapter 14
Metabolic Diseases
Thomas H. Berquist
Osteoporosis: Basic Concepts
Key Facts
-
Osteoporosis is a reduction in bone mass. It is the most common clinical bone disease.
-
Osteoporosis affects 75 million people in the United States, Europe, and Japan, accounting for 1.5 million fractures per year.
-
Osteoporosis is categorized as generalized, regional, or local. Table 14-1 summarizes the causes of osteoporosis.
-
Radiographic and imaging features vary with the type of osteoporosis and site.
P.852
|
TABLE 14-1 CAUSES OF OSTEOPOROSIS
|
||||
|---|---|---|---|---|
|
Suggested Reading
Eastell R. Treatment of postmenopausal osteoporosis. N Engl J Med 1998;338:736–746.
Lanchik L, Sartoris DJ. Current concepts in osteoporosis. AJR Am J Roentgenol 1997;168:905–911.
P.853
Osteoporosis: Generalized
Key Facts
-
Generalized osteoporosis may be the result of a long list of disorders (Table 14-1).
-
Senile or postmenopausal osteoporosis
usually develops in women aged more than 50 years. Fracture risk
approaches 60% in females aged more than 50 years. -
Endocrine disorders (Table 14-1)
are the most common cause of secondary osteoporosis. The five most
common endocrine disorders are hypogonadism, insulinopenia,
hyperparathyroidism (HPT), hyperthyroidism, and hyper-cortisolemia. -
Imaging of osteoporosis typically is
accomplished with routine radiographs and bone mineral density
measurements (dual-energy x-ray absorptiometry [DXA]). Computed
tomography and ultrasound have also been used. However, management
decisions and patient monitoring are most often accomplished with DXA. -
Combining DXA data with clinical factors
(age, prevalent fractures, family history of fractures, low body mass
index, increased risk of falls, and steroids) allows estimation of
fracture probabilities over 5- and 10-year periods.-
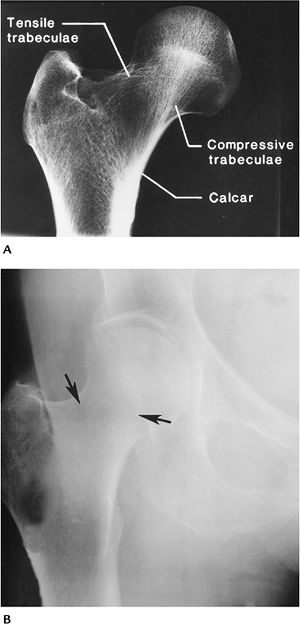
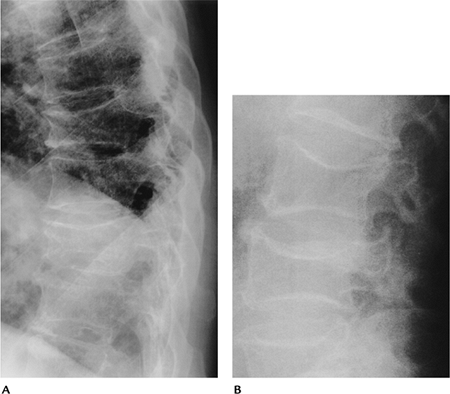
Radiographic features: Spine and proximal
extremities are primarily involved. Thin cortical bone, vertebral
contour abnormalities (endplate compression, compression fractures).
Coarsened trabecular pattern in the pelvis and trabecular resorption in
the proximal femurs. -
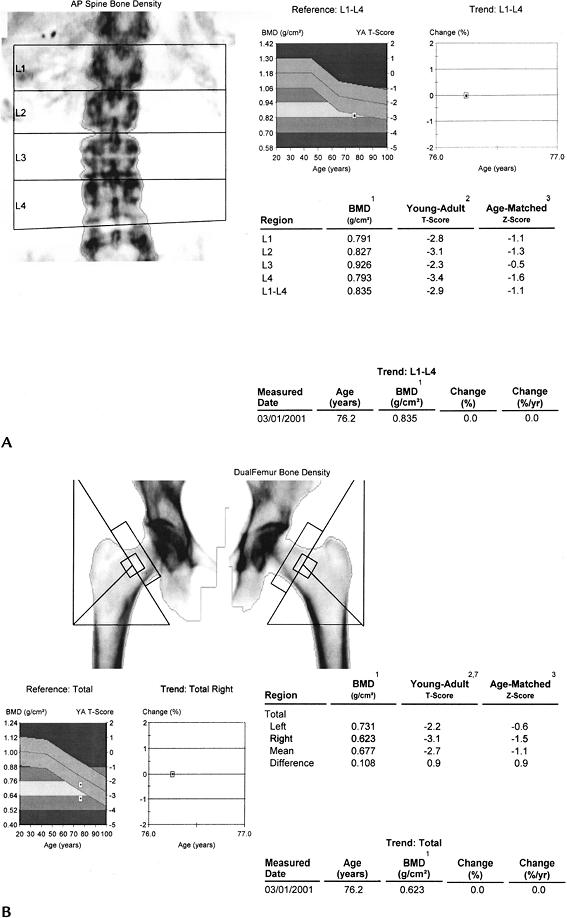
DXA: Lumbar spine, femoral neck, and
wrists typically are studied. Bone density is compared with density in
healthy 30-year-old persons (T-score) and the patient’s age group (Z
score).Normal: >-1Osteopenia: <-1 to -2.5Osteoporosis: <-2.5
-
-
Treatment may include ralozifene (mean
increase in spine density 2.6% over 4 years), bisphosphonates (mean
increase 10%–15% after 7–10 years), teriparatide (13% density increase
after 18 months), or strontium ranelate (14.5% density increase after 3
years). Treatments may reduce fracture risk by 30% to 50%. DXA studies
are used to monitor therapy at 1- to 2-year intervals.
P.854
 |
|
FIGURE 14-1 Osteoporosis. (A) Normal right hip with trabecular pattern well demonstrated. (B) Osteoporotic right hip with poorly defined trabeculae (arrows).
|
P.855
 |
|
FIGURE 14-2 (A) Lateral thoracic spine with osteoporosis and compression fractures. (B) Lateral lumbar space showing endplate compression (fish vertebra) with biconcave appearance.
|
P.856
 |
|
FIGURE 14-3 Bone mineral density with osteoporosis in a 76-year-old woman with lumbar (A) and hip (B) T scores of -2.9 and -3.1 for the lumbar spine and right hip, respectively.
|
P.857
 |
|
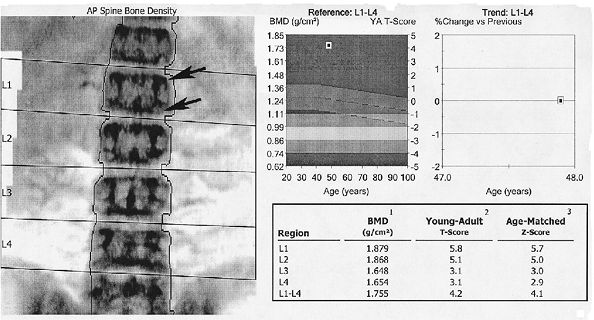
FIGURE 14-4 DXA study of the spine in a patient with chronic renal failure and renal osteodystrophy. The endplates are dense (arrows) and bone density increased with T-scores of up to 5.8 in L1.
|
Suggested Reading
Briot K, Roux C. What is the role of DXA, QUS, and bone markers in fracture prediction, treatment allocation, and monitoring? Best Pract Res Clin Rheumatol 2005;19:951–964.
Ralston SH. Bone densitometry and bone biopsy. Best Pract Res Clin Rheumatol 2005;19:487–501.
P.858
Osteoporosis: Regional Osteoporosis
Key Facts
-
Osteoporosis may be more localized, affecting single or multiple osseous structures or periarticular regions.
-
Changes are most common in the extremities.
-
Several disease categories are included in regional osteoporosis.
-
Disuse osteoporosis: Disuse or
immobilization osteoporosis is common after trauma with reduced use.
Other painful conditions or paralysis also may result in disuse
osteoporosis. Radiographic features include generalized osteopenia,
subchondral osteopenia, or foci of cortical or medullary lucency. -
Transient regional osteoporosis:
Transient regional osteoporosis have in common focal involvement, rapid
onset, and pain, and conditions are self-limited. One of the most
common is transient osteoporosis of the hip (see Chapter 4). Radiographic features include rapid-onset osteopenia of the femoral head and neck without acetabular involvement. -
Reflex sympathetic dystrophy (RSD): RSD
usually follows trauma but also may follow myocardial infarction or
hemiplegia. Patients with neoplasms (lung, ovary, breast, pancreas)
also may present with RSD. Patients present with pain, swelling, and
reduced motion. -
Radiographic features include swelling
and prominent juxta-articular osteopenia. Radionuclide scans show
increased tracer in the involved osseous structures.
-
 |
|
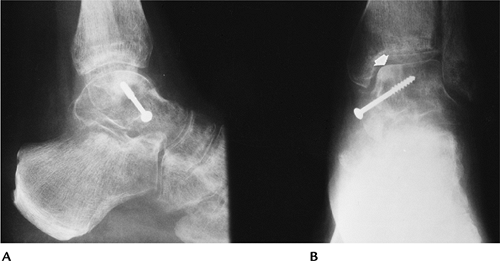
FIGURE 14-5 Disuse osteoporosis. Talar neck fracture with screw fixation. Lateral (A) and anteroposterior (AP) (B) radiographs showing osteopenia with sclerosis (arrow) medially caused by avascular necrosis.
|
P.859
 |
|
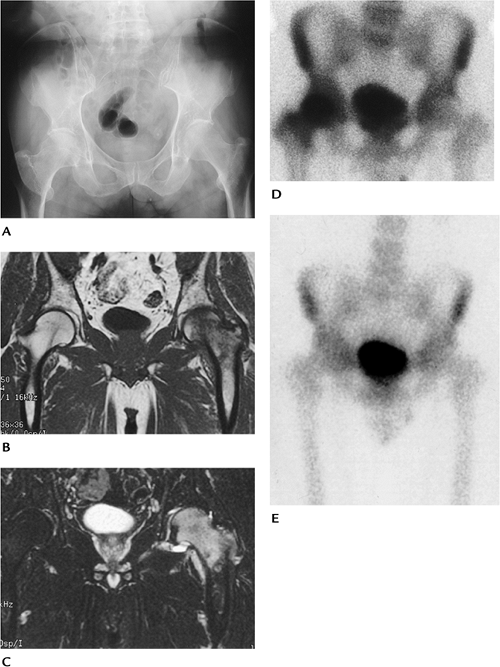
FIGURE 14-6 Transient osteoporosis of the hip: (A) AP radiograph of the pelvis showing osteopenia in the left upper femur. Coronal T1-weighted (B) and T2-weighted (C) magnetic resonance images showing abnormal signal intensity in the femoral head and neck with a joint effusion. (D)
Radionuclide bone scan in a different patient during early symptomatic phase showing increased tracer in the femoral head and neck. (E) Six months later, after symptoms have cleared, the bone scan is normal. |
P.860
 |
|
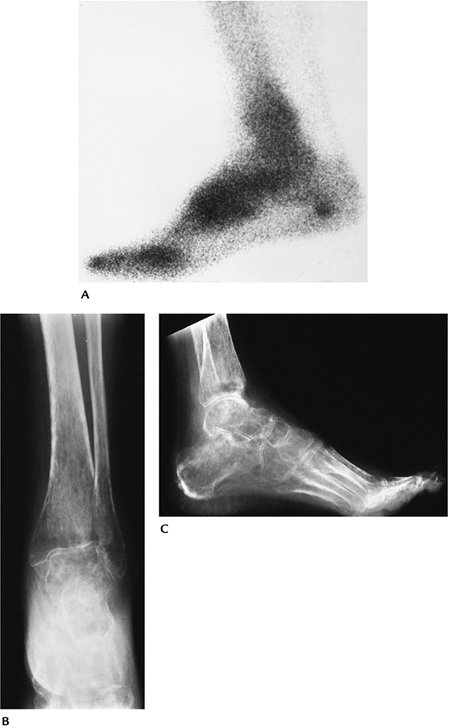
FIGURE 14-7 RSD. (A) Radionuclide bone scan showing increased tracer in the ankle, hind, and midfoot. AP (B) and lateral (C) radiographs showing advanced periarticular osteopenia.
|
P.861
Suggested Reading
Genant HK, Kozir F, Beherman C, et al. The reflex sympathetic dystrophy syndrome. Radiology 1975;117:21–32.
Hayes
CW, Conway WF, Daniel WW. MR imaging of bone marrow edema pattern:
Transient osteoporosis, transient bone marrow edema, or osteonecrosis. Radiographics 1993;13:1001–1011.
CW, Conway WF, Daniel WW. MR imaging of bone marrow edema pattern:
Transient osteoporosis, transient bone marrow edema, or osteonecrosis. Radiographics 1993;13:1001–1011.
Jones G. Radiographic appearances of disuse osteoporosis. Clin Radiol 1969;20:345–353.
P.862
Rickets and Osteomalacia: Basic Concepts
Key Facts
-
Rickets and osteomalacia are similar
histologically. The basic defect is inadequate osteoid mineralization,
although osteoid production also is reduced. -
Rickets affects the immature skeleton, with changes most obvious in the growth plate.
-
Osteomalacia affects mature bone, although osteomalacia and rickets can coexist in childhood.
-
Table 14-2 summarizes the causes of these conditions.
-
Figure 14-8 summarizes vitamin D metabolism and associated diseases that lead to rickets and osteomalacia.
|
TABLE 14-2 RICKETS AND OSTEOMALACIA
|
||||
|---|---|---|---|---|
|
P.863
 |
|
FIGURE 14-8 Vitamin D metabolism and diseases leading to rickets and osteomalacia. (From
Berquist TH, ed. Radiology of the foot and ankle, 2nd ed. Philadelphia: Lippincott Williams & Wilkins; 2000.
) |
Suggested Reading
Rasmussen H, Bordier P, Kurokawa K, et al. Normal control of skeletal and mineral homeostasis. Am J Med 1974;56:751–758.
P.864
Rickets and Osteomalacia: Rickets
Key Facts
-
Rickets is caused by improper mineralization of the growth plates.
-
Radiographic changes of rickets are most
obvious in regions of rapid growth. Therefore, changes are most
commonly observed in the ribs, proximal humerus, knees, distal tibia,
and wrist. -
Radiographic features:
-
Osteopenia
-
Decreased mineralization in the zone of provisional calcification
-
Growth plate widening and irregularity
-
Epiphyseal irregularity
-
Joint swelling
-
“Rachitic rosary” resulting from prominent costochondral junctions of the ribs
-
Lower extremity bowing
-
Scoliosis
-
 |
|
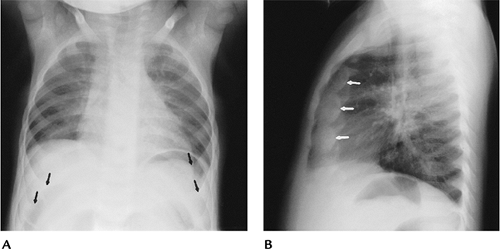
FIGURE 14-9 “Rachitic rosary.” AP (A) and lateral (B) radiographs of the chest showing prominence of the costochondral junctions (arrows).
|
P.865
 |
|
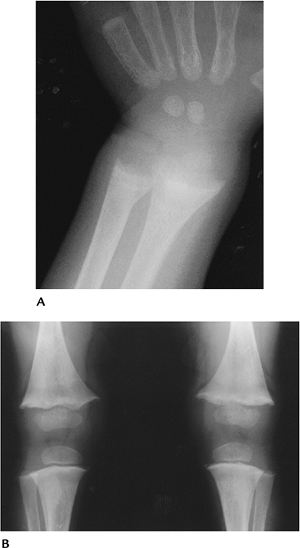
FIGURE 14-10 Rickets in a young child with growth plate widening and irregularity in the wrist (A) and knees (B). Note the small epiphyses in the knees.
|
P.866
 |
|
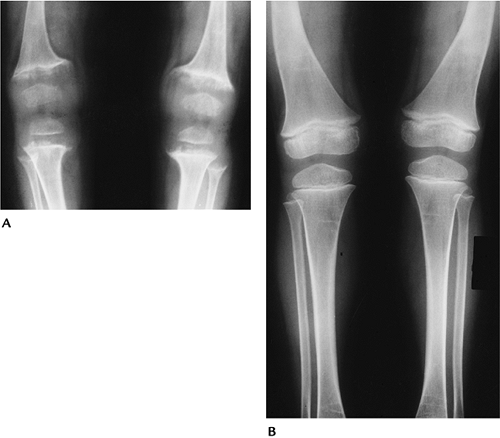
FIGURE 14-11 Vitamin D-resistant rickets in a 1-year-old child. (A)
AP radiograph of the knees showing irregularity and widening of the growth plates. The epiphyses are small and irregular as well. (B) Three years after high-dose vitamin D therapy, the knees appear normal. There is residual femoral bowing. (From Berquist TH, ed. Radiology of the foot and ankle, 2nd ed. Philadelphia: Lippincott Williams & Wilkins; 2000.
) |
Suggested Reading
Steinbach HL, Noetzli M. Roentgen appearance of the skeleton in osteomalacia and rickets. AJR Am J Roentgenol 1964;91:955–972.
P.867
Rickets and Osteomalacia: Osteomalacia
Key Facts
-
Osteomalacia and rickets may coexist in the immature skeleton.
-
Features of adult osteomalacia include osteopenia, pseudofractures, and bone deformity.
-
Pseudofractures (uncalcified osteoid
seams) are considered pathognomonic. Pseudofractures are typically
bilateral and symmetrical. Common locations include the femoral necks,
pubic symphysis, ribs, and scapula. -
Axial osteomalacia is a rare condition
involving the axial skeleton with prominent trabeculae, but typically
not pseudofractures. The condition typically involves males. -
Osteomalacia and vitamin D-resistant
rickets are becoming more frequently recognized with malignancies.
Vascular neoplasms predominate.
 |
|
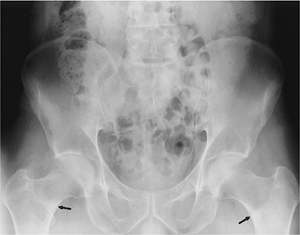
FIGURE 14-12 Osteomalacia. AP radiograph of the pelvis showing osteopenia with bilateral femoral neck pseudofractures (arrows).
|
P.868
 |
|
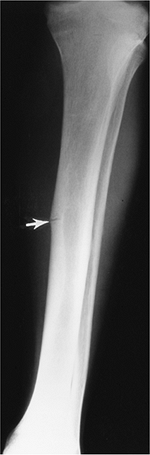
FIGURE 14-13 AP radiograph of the tibia showing a midshaft pseudofracture (arrow).
|
Suggested Reading
Jawarski ZFG. Pathophysiology, diagnosis, and treatment of osteomalacia. Orthop Clin North Am 1972;3:623–652.
P.869
Renal Osteodystrophy
Key Facts
-
Osseous changes caused by chronic renal
disease are not completely understood, but changes are predominantly
the result of secondary HPT and abnormal vitamin D metabolism. -
Vitamin D metabolism is altered because of decreased renal production of the active metabolite (1,25-dihydroxyvitamin D3 [1,25(OH)2D3]).
-
Radiographic features vary with age.
Brown tumors are less common than with primary HPT. Osteosclerosis is
more common. Five basic features may be evident:-
Osteitis fibrosis cystica
-
Rickets or osteomalacia
-
Osteosclerosis
-
Osteoporosis
-
Avascular necrosis in patients undergoing steroid therapy
-
-
Features of HPT:
-
Periosteal, cortical, subchondral bone resorption; brown tumors; bone sclerosis; chondrocalcinosis
-
Rickets and osteomalacia; osteopenia; metaphyseal changes (see section on “Rickets and Osteomalacia”); pseudofractures; slipped capital femoral epiphysis
-
Osteoporosis and associated fractures
-
P.870
P.871
 |
|
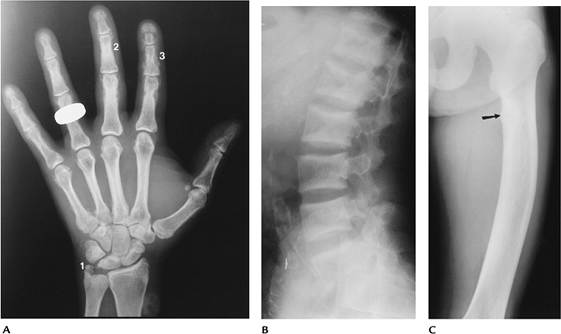
FIGURE 14-14 Renal osteodystrophy in an adult. (A)
Radiograph of the hand showing chondrocalcinosis (1), subperiosteal resorption of the radial aspect of the middle phalanges (2), and subtendinous resorption (3). (B) Lateral radiograph of the lumbar spine showing endplate sclerosis (“rugger jersey spine”). (C) AP view of the femur showing bowing with a proximal pseudofracture (arrow). |
P.872
 |
|
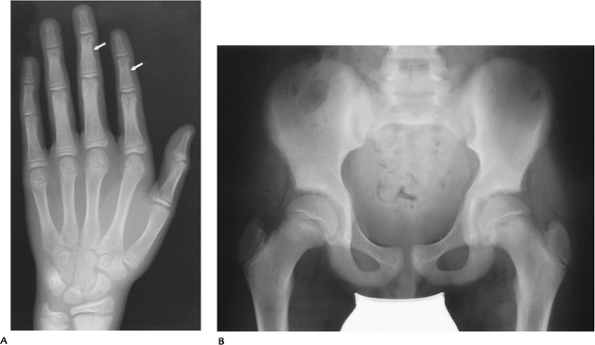
FIGURE 14-15 Renal osteodystrophy in the immature skeleton. (A)
AP radiograph of the hand and wrist showing physeal irregularity in the distal radius and ulna. There is subtle subperiosteal resorption in the radial aspect of the middle phalanges (arrows). (B) AP radiograph of the pelvis showing widening and irregularity of the sacroiliac joints caused by subchondral bone resorption. The femoral physis also is slightly irregular. |
P.873
Suggested Reading
Mankin HJ. Rickets, osteomalacia, and renal osteodystrophy. Part II. J Bone Joint Surg 1974;56A:352–386.
P.874
Parathyroid Disorders: Hyperparathyroidism
Key Facts
-
Parathyroid hormone is essential for proper transport of Ca2+ and related ions in the kidney, bone, and intestinal tract.
-
HPT has three categories:
-
Primary parathyroid adenoma, hyperplasia, or carcinoma. Ectopic parathormone may be secreted by lung or renal neoplasms.
-
Secondary decreased Ca2+ leads
to increased parathormone secretion. The list of causes is long, but
the most common include chronic renal disease, decreased intestinal
absorption of calcium, and impaired vitamin D metabolism. -
Tertiary patients on renal dialysis, in
chronic renal failure, and with malabsorption. Patients have
long-standing secondary HPT, and therefore the parathyroid glands no
longer respond to Ca2+ levels.
-
-
Radiographic features of HPT are as follows:
-
Bone resorption (parathormone stimulates osteoclastic resorption)
-
Subperiosteal (typical in phalanges of the hands)
-
Cortical endosteal
-
Subchondral
-
-
Peritendinous or subligamentous
-
Paraphyseal
-
Lamina dura about teeth
-
-
-
Osteopenia
-
Pathologic fractures
-
Brown tumors (most common with primary HPT)
-
Osteosclerosis (secondary HPT or renal osteodystrophy)
-
Articular calcification (secondary > primary HPT)
-
Vascular calcification (secondary > primary HPT)
-
Nephrolithiasis
-
Peptic ulcer disease
P.875
 |
|
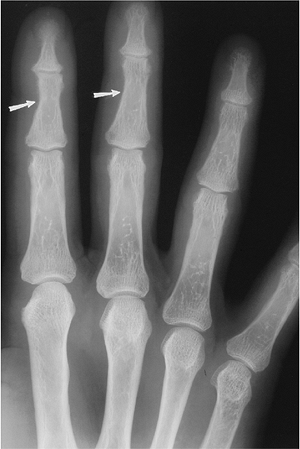
FIGURE 14-16
Primary HPT. Posteroanterior radiograph of the fingers showing early subperiosteal resorption in the characteristic radial side of the middle phalanges (arrows). Cortical bone thickness also is reduced. |
P.876
 |
|
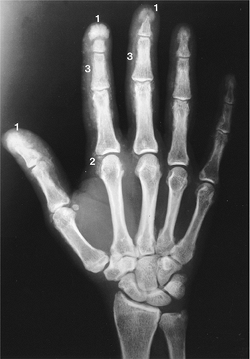
FIGURE 14-17
Secondary HPT. Radiograph of the hand showing resorption of the first to third tufts with soft tissue calcification (1). There is articular calcification (2), and subperiosteal and subligamentous resorption (3). |
P.877
 |
|
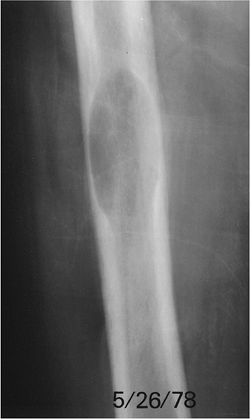
FIGURE 14-18 Primary HPT. Radiograph of the midfemur showing a brown tumor.
|
P.878
 |
|
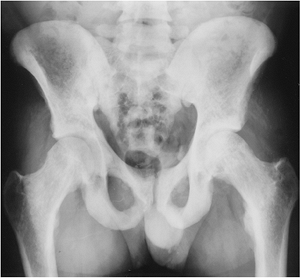
FIGURE 14-19 Secondary HPT. Radiograph of the pelvis and hips showing diffuse osteosclerosis.
|
Suggested Reading
Resnick D, Kransdorf MJ. Parathyroid disorders and renal osteodystrophy. In: Resnick D, Kransdorf MJ, eds. Bone and joint imaging, 3rd ed. Philadelphia: Elsevier- Saunders; 2005:603–622.
P.879
Parathyroid Disorders: Hypoparathyroidism, Pseudohypoparathyroidism, and Pseudo-pseudohypoparathyroidism
Key Facts
-
Hypoparathyroidism may be the result of
resection with thyroidectomy, or it may be idiopathic. The idiopathic
form is more common in children (more common in females than males).
Patients present with neuromuscular symptoms and decreased serum
calcium. -
Pseudohypoparathyroidism differs from
hypoparathyroidism in that parathormone levels are normal. Parathyroid
glands are normal or hyperplastic, but end-organ resistance is present.
Patients present in the second decade with short obese stature, round
faces, bradydactyly, and mental retardation. There is sex-linked
dominant inheritance. Serum Ca2+ is decreased, and PO4 is increased. -
Pseudo-pseudohypoparathyroidism may be
seen in the same families as pseudohypoparathyroidism. Clinical
features are similar, but serum Ca2+ is normal. -
Radiographic features are summarized as follows:
Radiographic Feature Hypoparathyroidism Pseudo and Pseudo-pseudohypoparathyroidism Osteosclerosis + + Soft tissue calcification Subcutaneous Periarticular Calvarial thickening + + Hypoplastic dentition + – Spinal calcification + – Exostoses – + Bowing deformities – + Premature physeal fusion + + Shortening of metacarpals, metatarsals, phalanges – +
P.880
 |
|
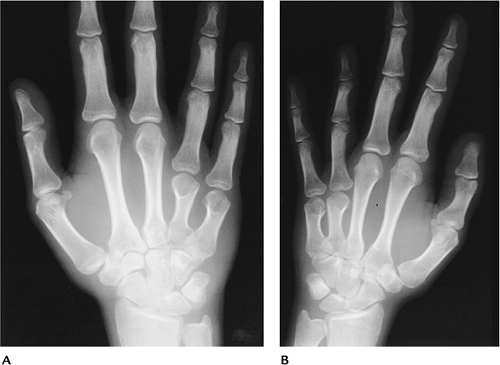
FIGURE 14-20 Pseudohypoparathyroidism. (A,B) AP radiographs of the hands showing shortening of the fourth and fifth metacarpals.
|
Suggested Reading
Burnstein MI, Kottainaser SR, Pettifar JM, et al. Metabolic bone disease in pseudohypoparathyroidism. Radiology 1985;155:351–356.
P.881
Thyroid Disorders
Key Facts
-
Thyroxine and triiodothyronine are the
active forms of thyroid hormone. They affect fat, protein, and
carbohydrate metabolism and mineral turnover. -
Hyperthyroidism is most often associated
with Graves disease or goiter with active thyroid adenomas. Patients
typically present with tachycardia, weakness, and exophthalmus. -
Hypothyroidism is the result of reduced
thyroid hormones. Primary hypothyroidism may be related to surgery,
thyroiditis, or iodine therapy. Patients present with hoarseness, dry
skin and hair, and bradycardia. -
Radiographic features:
-
Hyperthyroidism: osteopenia. Thyroid acropachy (1% of patients): swelling of the hands and feet with diaphyseal periostitis.
-
Hypothyroidism: adults: increased or decreased bone density. Infants and children: delayed skeletal maturation.
-
P.882
 |
|
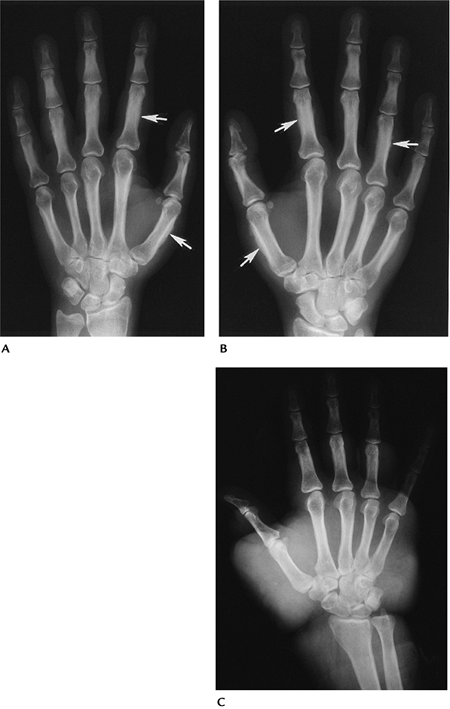
FIGURE 14-21 Thyroid acropachy. (A,B) Radiographs of the hands showing diaphyseal periostitis (arrows) and generalized swelling. (C) Radiograph in a different patient showing marked soft tissue prominence.
|
P.883
Suggested Reading
Meurier RJ, Bianchi GG, Edouad CM, et al. Bony manifestations of thyrotoxicosis. Orthop Clin North Am 1972;3:745–775.
P.884
Pituitary Disorders
Key Facts
-
Growth hormone (somatotropin) is essential for normal skeletal development.
-
Hypopituitarism may be the result of surgery, infection, vascular insufficiency, or neoplasm.
-
Acromegaly and gigantism are the result
of hypersecretion of growth hormone. The condition typically is related
to acidophilic or chromophobic adenomas. Elevated growth hormone during
development leads to gigantism. In the mature skeleton, it results in
acromegaly. -
Patients with acromegaly present with
prominent mandibles, frontal bossing, hepatosplenomegaly, and
arthropathy with spadelike appearance of the fingers. Up to 25% have
diabetes mellitus, and there is an increased incidence of pancreatic
adenomas. -
Radiographic features:
• Hypopituitarism: Delayed skeletal maturation • Acromegaly: Calvarian Soft tissue thickening in
scalp, fingers, toes, heel pad; calvarial thickening, enlarged sella,
prominent frontal sinuses, occipital spurringWidened disc spaces and osteophytes in the spine Joint space widening and degenerative changes in the extremities New bone formation at sites of ligament and tendon attachments Cortical thickening. Prominent (spadelike) tufts on the distal phalanges
P.885
 |
|
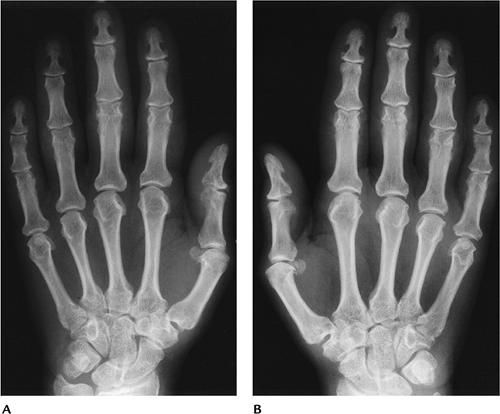
FIGURE 14-22 Acromegaly. (A,B) Radiographs of the hands showing spadelike tufts and metacarpophalangeal joint space widening.
|
Suggested Reading
Lang EK, Bessler WT. The roentgen features of acromegaly. AJR Am J Roentgenol 1961;86:321–328.
P.886
Paget Disease
Key Facts
-
Paget disease is a common condition in
older adults causing excessive and disordered bone remodeling. Ninety
percent of patients are aged more than 55 years. -
The cause remains unknown.
-
The most common sites of involvement are the axial skeleton, femur, and tibia.
-
Symptoms are not always present, but are more common in the axial skeleton. Many cases are detected incidentally on radiographs.
-
Laboratory data may show elevated alkaline phosphatase and increased serum and urine hydroxyproline.
-
Radiographic features typically are divided into four stages:
Initial stage Predominately lytic with geographic lucent areas Skull—osteoporosis circumscripta Long bones—“blade-of-grass” appearance Mixed stage Mixed lytic and sclerotic changes Sclerotic stage Cortical thickening, prominent trabeculae, medullary sclerosis Malignant degeneration Occurs in up to 10%: typically osteosarcoma or fibrosarcoma (see Chapter 10) -
Radionuclide scans are intensely positive because of the increased metabolic activity.
-
Magnetic resonance imaging may present a confusing picture unless radiographs are available for comparison.
-
Complications of Paget disease are as follows:
-
Pathologic fractures
-
Malignant degeneration (magnetic resonance imaging superior for imaging when suspected)
-
Platybasia
-
Cord compression
-
Spinal stenosis
-
P.887
P.888
 |
|
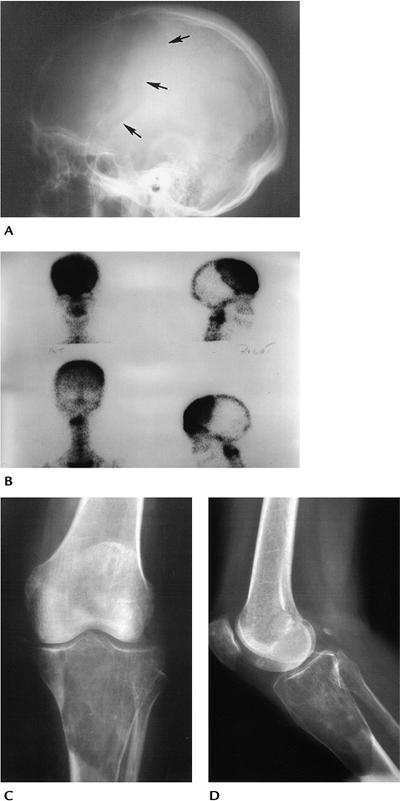
FIGURE 14-23 Calvarial features. (A) Lateral view of the skull showing a large geographic lytic area (arrows) (osteoporosis circumscripta). (B) Radionuclide scan showing dramatically increased tracer in this region. AP (C) and lateral (D) radiographs of the tibia show lytic Paget’s disease with sharp margination (“blade-of-grass”).
|
P.889
 |
|
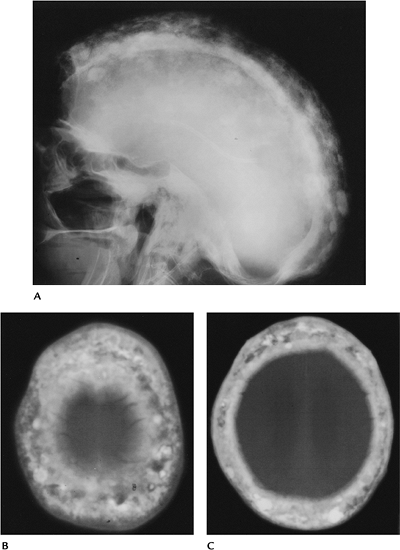
FIGURE 14-24 Sclerotic phase. (A) Lateral radiograph of the skull showing thickening and sclerosis with basilar invagination. (B,C) Computed tomography images showing sclerotic areas in the markedly thickened calvarium.
|
P.890
 |
|
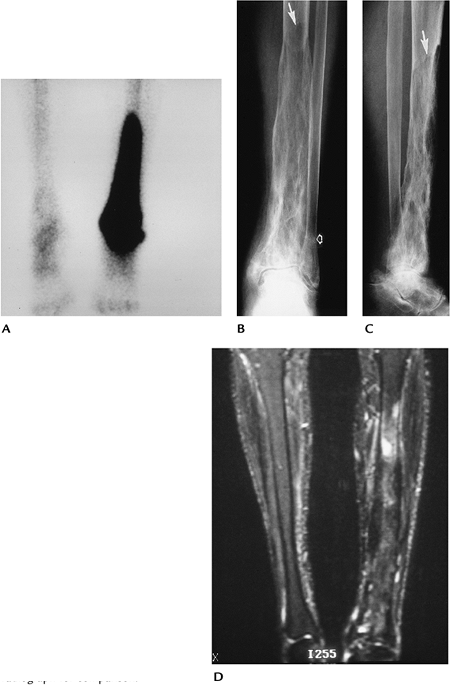
FIGURE 14-25 Paget disease in the tibia and talus. (A) Radionuclide bone scan showing intense increased uptake in the distal tibia and talus on the left. AP (B) and lateral (C) radiographs showing lytic changes proximally with sharp demarcation (arrow) (“blade of grass”) at the upper margin. There is trabecular thickening distally and a stress fracture in the fibular (open arrow). (D)
Fat-suppressed T2-weighted magnetic resonance image showing variable signal intensity changes in the involved tibia. This image would be confusing to interpret without the radiograph for comparison. |
P.891
 |
|
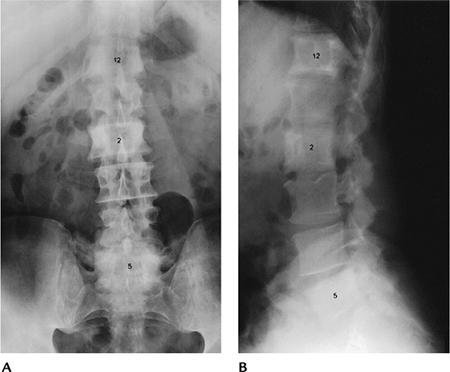
FIGURE 14-26 Paget disease in the spine. AP (A) and lateral (B)
radiographs showing involvement of T12, L2, and L5, with sclerosis, increased size (L2), and cortical and trabecular thickening. |
P.892
 |
|
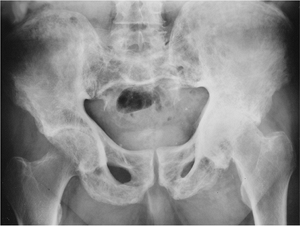
FIGURE 14-27
Paget disease in the pelvis. AP radiograph showing mixed lytic and sclerotic changes, with cortical thickening and protrusio acetabuli in the left hip. |
Suggested Reading
Roberts MC, Kressel HY, Fallon MD, et al. Paget disease. MR image findings. Radiology 1989;177:341–345.
Sundarum
M, Khanna G, El-Khoury GY. T1-weighted MR imaging for distinguishing
large osteolysis of Paget disease from sarcomatous degeneration. Skel Radiol 2001;30:378–383.
M, Khanna G, El-Khoury GY. T1-weighted MR imaging for distinguishing
large osteolysis of Paget disease from sarcomatous degeneration. Skel Radiol 2001;30:378–383.