
was the first edition to publish a chapter dealing with the
epidemiology of fractures. There were two sections: the first section
contained information about the overall epidemiology of fractures in a
defined population, and the second section examined the overall
fracture epidemiology in the United States. In this edition, we have
changed the focus of the chapter to try to compare two different types
of orthopaedic trauma unit. In the first part of the chapter, the
epidemiology of fractures presenting to the Royal Infirmary of
Edinburgh in Scotland in a 1-year period in 2007-2008 will be analyzed.
This hospital is the only hospital admitting orthopaedic trauma in a
well-defined population containing the City of Edinburgh, Midlothian,
and East Lothian, and therefore its data can be used to calculate the
prevalence and incidence of different fractures in the population. The
Royal Infirmary of Edinburgh is the largest orthopaedic trauma hospital
in the United Kingdom, and we believe that the epidemiological results
should be applicable to many developed countries. We accept that there
will be some epidemiological differences in different countries mainly
depending on social demographics, but it is likely that the
epidemiological results from the Royal Infirmary of Edinburgh will
reflect the fracture epidemiology in similar countries.
epidemiology from the R. Adams Cowley Shock Trauma Center in Baltimore,
Maryland, USA, will be presented. This is a Level I Trauma Center that
is the main primary adult resource center for the Maryland Emergency
Medical Services System. It is the highest volume Trauma Center in the
United States, and its trauma and critical care admissions average 7800
patients per year. Unlike the Royal Infirmary of Edinburgh, the R.
Adams Cowley Shock Trauma Center mainly treats severely injured
patients; the less severely injured patients being treated in other
hospitals in the Baltimore area. There are three Level I Trauma Centers
in Baltimore; therefore, the population that is treated in the R. Adams
Cowley Shock Trauma Center is a subset of the overall population and
the overall prevalences and incidences of different fractures in the
community cannot be calculated. However, we believe that a comparison
of the results of these two large hospitals will be of interest to many
orthopaedic surgeons, many of whom work in institutions that are
similar to either the Royal Infirmary of Edinburgh or the R. Adams
Cowley Shock Trauma Center.
proven to be very difficult to accurately estimate their incidence
within
the population and there are very few studies where this has been done.7,12,13,14,23,35,36 Table 3-1 shows the results of several analyses of fracture epidemiology in the United Kingdom,7,12,13,23,35 Norway,36 and the United States.14 The difference in results is striking. All the studies shown in Table 3-1
have included both children and adults, but the studies use different
methodologies and we believe that this is one of the principal reasons
for the significant discrepancies in the results.
|
TABLE 3-1 The Fracture Incidence Reported in Various Studies
|
||||||||||||||||||||||||||||||||||||||||||||||||||||||||||||
|---|---|---|---|---|---|---|---|---|---|---|---|---|---|---|---|---|---|---|---|---|---|---|---|---|---|---|---|---|---|---|---|---|---|---|---|---|---|---|---|---|---|---|---|---|---|---|---|---|---|---|---|---|---|---|---|---|---|---|---|---|
|
||||||||||||||||||||||||||||||||||||||||||||||||||||||||||||
examined a geographically well-defined population in England and looked
at both the inpatient and outpatient fractures in the area. They
observed that they might be missing a few toe fractures and some spinal
fractures in the elderly, but they felt that they had missed very few
fractures. A very similar methodology was employed by Court-Brown and
Caesar in the sixth edition of Rockwood and Green.8
They assessed the number of adult fractures in the well-defined
population served by the Royal Infirmary of Edinburgh in 2000. The
pediatric fractures were also recorded in the same year.35
When the pediatric and adult databases are combined, the overall
database gives figures that, given the 20-year gap between the two
studies, must be regarded as being equivalent to those of Donaldson et
al.12
studies have demonstrated a much higher incidence of fractures in the
population, although all have agreed that more fractures occur in males
than females. The studies by Johansen et al. in Wales,23 Sahlin in Norway,36 and Fife and Barancik in the United States14
all record similar fracture incidences. The notable difference between
these studies and the Edinburgh studies is that in the Edinburgh
studies all diagnoses were made from radiographs by experienced
surgeons or radiologists. In the other studies, the outpatient
fractures in particular were often diagnosed by junior doctors who were
not orthopaedic surgeons and were inexperienced in diagnosing
fractures. These studies analyze hospital or community data but do not
check the veracity of fracture diagnosis. We believe that this leads to
an overestimate of a number of fractures particularly in locations
where soft tissue injuries are relatively common such as the hand,
wrist, ankle, and foot. It is of interest that the incidence of
fractures of the forearm, wrist, and hand in the Welsh study23
was 9.2/1000/year compared with 6.1/1000/year in Edinburgh where all
the radiographs were reviewed by an experienced surgeon or radiologist.
This is also true of ankle fractures (1.42/1000/year in Wales and
0.96/1000/year in Edinburgh) and foot fractures (2.41/1000/year in
Wales and 1.3/1000/year in Edinburgh), but not of the more obvious
fractures of the femur, where the incidence in the two studies were
virtually identical (1.6/1000/year in Wales and 1.4/1000/year in
Edinburgh).
employed is where patients are asked to complete a questionnaire
regarding whether they have had a fracture in a given period. This type
of methodology was adopted by Donaldson et al.13 in a later study. Table 3-1
shows that when this type of survey is used, even higher estimates of
fracture incidence are achieved. We think it unlikely that the overall
incidence of fractures is as high as 36/1000/year, and we believe that
the difference is attributable to the type of methodology used. Many
patients are told that recurrent or continuing pain may be secondary to
undiagnosed fractures by family physicians, physiotherapists, nurses,
osteopaths, or other paramedical professionals without there being any
proof; we believe that this has skewed the results of this study.
a further year of fracture treatment at the Royal Infirmary of
Edinburgh in Scotland. In the sixth edition,8
all fractures presenting to the Royal Infirmary in 2000 were analyzed.
For this chapter, we have analyzed the fractures presenting to the
hospital between July 1, 2007, and June 30, 2008. We have concentrated
on adults aged 16 years or older and used the 2001 United Kingdom census15
to calculate incidence. This is the most recent United Kingdom census.
No patients aged less than 16 years have been included, and all soft
tissue injuries and dislocations have been excluded. We have not
included spinal fractures as these are treated both by the Edinburgh
orthopaedic surgeons and neurosurgeons, and patients with spinal
injuries are treated at the National Spinal Injuries Centre in Glasgow.
Local patients injured outside the catchment area of the Royal
Infirmary of Edinburgh but treated in the Royal Infirmary have been
included, and all patients injured in Edinburgh but living outside the
catchment area have been excluded.
years or more was 13.7/1000/year in 2007-2008. The incidence of
fractures in males was 13.7/1000/year and in females it was
13.6/1000/year. There were 6986 fractures of which 3304 (47.3%)
occurred in males and 3687 (52.7%) in females. The overall average age
was 52.9 years with an average of 41.4 years in males and 63.0 years in
females.
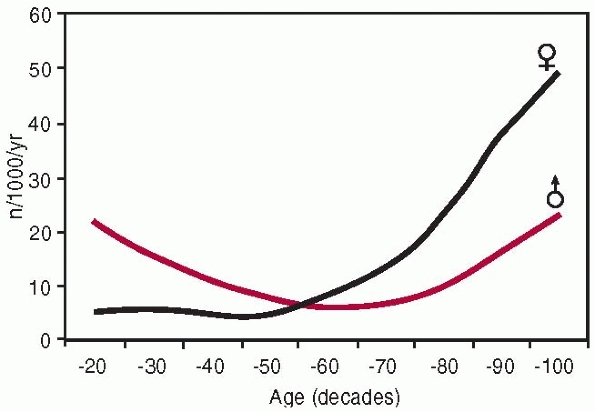
have highlighted the fact that men have a bimodal distribution of
fractures and women have a unimodal distribution with a significant
progressive increase in fracture incidence in the postmenopausal years.7,12,14,23,28 The overall fracture distribution curve shown in Figure 3-1
is no different. It shows the overall age and gender-specific fracture
incidence curves. In males, the incidence of fractures between 16-19
years of age is 26.2/1000/year compared with 5.9/1000/year in females.
The lowest incidence in males is 8.1/1000/year, which occurs between
50-59 years. In females, the lowest incidence is 4.8/1000/year, which
occurs between 30-39 years of age. In older males, the incidence rises
to 65.7/1000/year in males aged at least 90 years of age, compared with
80.3/1000/year in females aged at least 90 years of age. The later male
peak has become more obvious in recent years because males are now
living longer and they are at greater risk of osteopenic or
osteoporotic fractures.24
They analyzed 8539 fractures over a 5-year period in Oxford, England,
and proposed five basic curves. Their Type A curve affected young and
middle-aged men and they referred to it as a “wage earners” curve. They
suggested that this occurred in patients who presented with fractures
of the hand, medial malleolus, metatarsus, foot phalanges, and spine.
Their J-shaped curve affected older males and females and obviously
described fragility, or osteoporotic, fractures. It is equivalent to
our Type F curve (Fig. 3-2). They stated that
fractures of the proximal humerus, humeral diaphysis, proximal femur,
and pelvis together with bimalleolar ankle fracture had a J-shaped
curve.
This was said to occur in distal humeral fractures, tibial diaphyseal
fractures, and clavicular fractures. They also described two composite
curves with either a bimodal male and unimodal female distribution or a
unimodal male and bimodal female distribution. These are equivalent to
our Type D and G curves (see Fig. 3-2). They
said that these curves described fractures of the proximal and distal
radius, femoral diaphysis, proximal tibia and fibular, and the lateral
malleolus.
 |
|
FIGURE 3-1 The overall age and gender fracture distribution curves.
|
analyzed only patients who were at least 35 years of age. They showed
that fractures of the proximal humerus, pelvis, and proximal femur all
demonstrated an osteoporotic Type F curve (see Fig. 3-2). It is interesting to note that they had a Type A curve (see Fig. 3-2)
for femoral diaphyseal fractures, but they recorded that the highest
incidence of femoral diaphyseal fractures occurred in the elderly.
Donaldson et al.12 constructed four
curves for proximal femoral, proximal humeral, distal radial and
tibial, and fibular diaphyseal fractures that were very similar to the
curves shown in Figure 3-2, although there
were fewer older females with fractures of the tibia and fibular
diaphysis than we would see now. Johansen et al.33
also constructed eight curves covering different body areas these being
the hip, spine, upper arm, pelvis, forearm and wrist, ankle, hand,
finger and thumb, and foot and toes. These are very similar to the
curves shown in Figure 3-2.
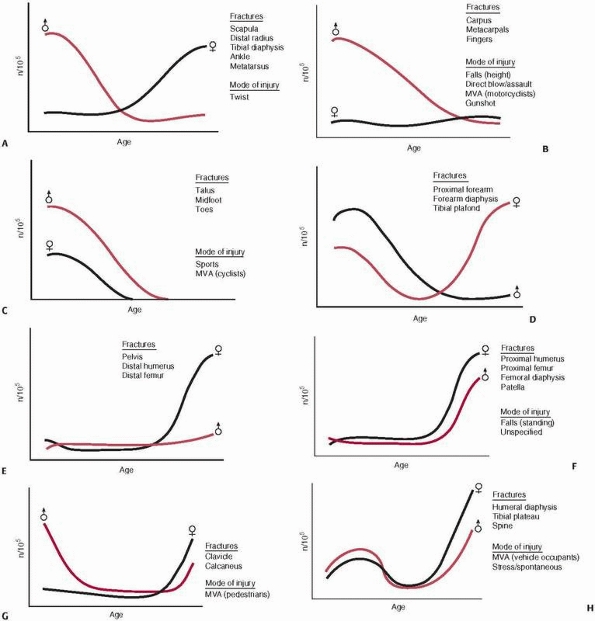
Most fractures have a unimodal distribution affecting either younger or
older patients. Some fractures, however, have a bimodal distribution
whereby younger and older patients are affected but there is a lower
incidence in middle age. If one analyzes males and females separately,
the distribution curves shown in Figure 3-2 can be constructed. The eight distribution curves define all fractures. It should be remembered that the curves shown in Figure 3-2
are diagrammatic. The relative heights of the peaks of the curves will
vary, but the overall curve patterns remain appropriate for all
fractures.
fracture curve with a unimodal distribution in younger males and in
older females. Generally, the younger male peak is higher than the
older female peak, though this is not the case in all fractures. An
example is the metatarsal fracture where the younger male peak and the
older female peak are at a similar height. Type A curves are seen in
fractures of the scapula, distal radius, femoral diaphysis, tibial
diaphysis, ankle, and metatarsus. In Type B curves, there is also a
young male unimodal distribution, but fractures in females occur in
smaller numbers throughout the decades. Type B fractures are generally
seen in the hand and affect the carpus, metacarpus, and fingers.
However, they are also characteristic of femoral head fractures and
those isolated fractures of the fibula which do not involve the ankle
joint.
unimodal distribution. These fractures are rare after middle age. These
fractures tend to occur in the foot and affect the toes, midfoot, and
talus. In Type D fractures, there is a young male unimodal distribution
but the female distribution is bimodal affecting younger and older
females. Generally the second peak starts around the time of the
menopause. Type D curves are seen in fractures of the proximal forearm,
forearm diaphysis, and tibial plafond.
 |
|
FIGURE 3-2 The eight fracture distribution curves. See Table 3-2 for list of distribution curves for different fractures.
|
They show a unimodal female distribution affecting older females with a
relatively constant, lower incidence of fractures in males throughout
the decades. The Type E pattern is seen in pelvic fractures, distal
humeral fractures, and distal femoral fractures. This may be surprising
to orthopaedic surgeons who see young male patients with these
fractures after high-energy trauma. However, if the complete
epidemiology of these fractures is analyzed across the community, it is
apparent that the high-energy fractures are relatively rare compared
with the lowerenergy fractures seen in later life.
In Type F fractures, both males and females show a unimodal
distribution affecting older patients with the incidence being higher
in females. This pattern is characteristic of fractures of the proximal
humerus, humeral diaphysis, proximal femur, femoral
diaphysis,
and patella. There is some variation regarding when the rise in
fracture incidence occurs. Generally, it is earlier in females than
males and usually occurs around the time of the menopause in proximal
humeral fracture, humeral diaphyseal fractures, and patella fractures
but later in femoral diaphyseal fractures and proximal femoral
fractures.
distribution affecting older females, and males show a bimodal
distribution affecting both younger and older males with the incidence
being higher in younger males. This distribution is seen in calcaneal
and clavicular fractures. Type H fractures are unusual in that both
males and females show a bimodal distribution. This fracture pattern is
seen in fractures of the humeral diaphysis, tibial plateau, and
cervical spine.8
shows that ankle fractures have a Type A distribution, analysis of the
different types of ankle fractures shows that only lateral malleolar
fractures have a Type A distribution. Medial malleolar fractures have a
Type D distribution, and suprasyndesmotic ankle fractures have a Type C
distribution. Both bimalleolar and trimalleolar are fragility fractures
showing a Type E distribution. Similarly, proximal forearm fractures
have a Type D distribution when they are all considered together, but
further analysis shows that radial neck fractures have a Type A
distribution, whereas radial head fractures have a Type H distribution.
Both olecranon fractures and fractures of both the proximal radius and
ulnar have a Type F distribution and should be regarded as fragility
fractures. The distribution curves for different fractures are listed
in Table 3-2.
|
TABLE 3-2 The Distribution Curves Shown in Figure 3-2 Applied to a Number of Commonly Seen Fractures
|
||||||||||||||||||||||||||||||||||||||||||||||||||||||||||||||||||||||||||||||||||||||||||||||||||||||||||||||||||||||||||||||||||||||||||||||||||||||||||||||||||||||||||||||||||||||||||||||||||||||||||||
|---|---|---|---|---|---|---|---|---|---|---|---|---|---|---|---|---|---|---|---|---|---|---|---|---|---|---|---|---|---|---|---|---|---|---|---|---|---|---|---|---|---|---|---|---|---|---|---|---|---|---|---|---|---|---|---|---|---|---|---|---|---|---|---|---|---|---|---|---|---|---|---|---|---|---|---|---|---|---|---|---|---|---|---|---|---|---|---|---|---|---|---|---|---|---|---|---|---|---|---|---|---|---|---|---|---|---|---|---|---|---|---|---|---|---|---|---|---|---|---|---|---|---|---|---|---|---|---|---|---|---|---|---|---|---|---|---|---|---|---|---|---|---|---|---|---|---|---|---|---|---|---|---|---|---|---|---|---|---|---|---|---|---|---|---|---|---|---|---|---|---|---|---|---|---|---|---|---|---|---|---|---|---|---|---|---|---|---|---|---|---|---|---|---|---|---|---|---|---|---|---|---|---|---|---|
|
||||||||||||||||||||||||||||||||||||||||||||||||||||||||||||||||||||||||||||||||||||||||||||||||||||||||||||||||||||||||||||||||||||||||||||||||||||||||||||||||||||||||||||||||||||||||||||||||||||||||||||
fracture clinics and hospitals around the world indicates that fracture
epidemiology is changing very quickly.1,16,17,19,22,24,25,26,27,37,43
It is apparent that the most obvious change is the increased numbers of
older women who now present with fractures. This not only represents an
increase in the incidence of fragility fractures, but it has also been
caused by the fact that older women now present with fractures that
50-60 years ago were usually seen in younger patients. This is best
illustrated by using the fracture distribution curves shown in Figure 3-2. Buhr and Cooke,2
in 1959, showed that fractures of the medial malleolus, metatarsus,
spine, distal humerus, tibial diaphysis, and clavicle all had a Type C
distribution curve and affected younger people. These fractures are now
Types A, D, G, or H, and a significant number of older patients,
usually female, present with them. We suspect that this is also the
case with fractures of the scapula, tibial plateau, and calcaneus,
amongst others.
examined the epidemiology of patients who were at least 35 years of age
in Dundee, Scotland, and Oxford, England, between 1954 and 1958. The
results are shown in Table 3-3, which also
shows comparative results from Minnesota, United States, and Edinburgh.
Comparison of the 1954-1958 overall results for Dundee with the
2007-2008 results from Edinburgh indicate that the overall incidence of
fractures is rising. Dundee and Edinburgh are only 60 miles apart and
are not dissimilar in their social demography. What is most interesting
is that the incidence of fractures in males aged 35 years or more has
not changed in 50 years, although it seems likely that the spectrum of
fractures has. This should be compared with females where the incidence
of fractures in this age group has almost doubled. This suggests that
while it is undoubtedly true that males are living longer, the problem
of osteoporotic fragility fractures is still mainly seen in female
patients. The figures from Minnesota31
are clearly very different from those of the United Kingdom. A review
of the methodology employed in this study indicates that the
radiographs for each fracture were reviewed and that the study does not
suffer from the deficiencies of other studies. It seems odd that there
should be such a considerable discrepancy between two not dissimilar
groups of people and we have no good explanation for the difference.
|
TABLE 3-3 A Review of Studies Employing Similar Methodologies for the Assessment of Fracture Incidence
|
||||||||||||||||||||||||||||||||||||
|---|---|---|---|---|---|---|---|---|---|---|---|---|---|---|---|---|---|---|---|---|---|---|---|---|---|---|---|---|---|---|---|---|---|---|---|---|
|
||||||||||||||||||||||||||||||||||||
and the 2007-2008 database shows that in the 8-year gap, there was an
increase in the numbers of fractures presenting to the Edinburgh
Orthopaedic Trauma Unit. In the sixth edition, the results of patients
aged 12 years or more were published, but if this database is adjusted
to be equivalent to the 2007-2008 database and to include only patients
of at least 16 years of age, it can be seen that there is an overall
increase of incidence from 107.7/104/year to 136.7/104/year.
If the data is broken down by age and gender, it can be seen that there
was no change in the incidence of fractures in females aged 16-34
years. However, the incidence of male fractures in this age group rose
from 156.4/104/year to 172.5/104/year. In patients aged 35-49 years, the incidence of fractures in females rose from 45.3/104/year to 66.4/104/year, and in males it rose from 81.4/104/year to 108.7/104/year. In the group aged 50 years or older, the incidence of fractures in females rose from 228.7/104/year to 289.4/104/year and from 80.8/104/year to 110.1/104/year
in males. The methodology used to collect and analyze the data was the
same in both years, and it would therefore seem that the incidence of
fractures has risen in a relatively short period but with the incidence
of fragility fractures in females showing the greatest increase.
present with fractures is also suggested by an analysis of the age at
which patients present with different fractures. The average age of the
patients of at least 16 years of age who presented with fractures in
2000 was 51.5 years compared with 52.9 years in 2007-2008. Of the 27
different fracture types shown in Table 3-4,
20 presented with a higher average age in 2007-2008 than in 2000. We
appreciate that this might be a fortuitous occurrence, but it does seem
likely that the average age of patients who present with fractures is
continuing to rise.
varies widely. We believe that some of the variations are accounted for
by the different methods used to collect, and in particular, to
diagnose fractures. However, despite this, there are significant
differences in the incidence of fractures in different communities.
These differences have mainly been studied in osteoporotic or fragility
fractures and the literature is consistent in pointing out that the
population of Scandinavia has the highest incidences of these fractures.1,26,27,30 The reason for this is unknown. However, there is evidence that the incidence of fractures varies with racial type,3,4,39 domicile,17,19 season of the year,22 and social deprivation.32 The literature consistently details a higher incidence of fractures in urban, rather than rural, communities,17,19,31,38
which points to the important of environmental factors. There is also
evidence that the incidence of certain fractures, such as hip
fractures, varies in different parts of the same country.19,37
fractures are most commonly seen. Surgeons often analyze their own
hospital patients to see which fractures they most commonly treat and
then extrapolate their findings to the whole population. This is
clearly inappropriate as many hospitals deal with a specific type or
complexity of fracture and the spectrum of fractures presenting to
Edinburgh and Baltimore is different in many respects.
that were seen in 2007-2008 in the Royal Infirmary of Edinburgh.
Fractures of the distal radius are by far the most common, followed by
fractures of the proximal femur, metacarpus, finger phalanges, and
ankle. Altogether, these fractures account for 57.5% of all the
fractures treated in the unit. Some fractures are relatively rare, but
because of the trouble that surgeons have in treating them, they
receive a great deal of attention in the literature. Examples of these
are fractures of the distal tibia, talus, and calcaneus which together
accounted for 2% of the fractures seen in the study year.
been arranged in order of decreasing age, with the prevalence of
fracture in patients aged over 65 and 80 years also being shown. If the
gender ratio in Table 3-4 is compared with the average age of the different fractures shown in Table 3-5, it can be seen that fractures with a high female preponderance tend to occur in patients with an older average age.
compared the absolute risk of fractures with the risk of different
cardiovascular events and breast cancer in women aged 50-79 years in
the United States. They found that the projected number of women who
would experience a fracture exceeded the combined number of women who
would experience invasive breast cancer or a range of different
cardiovascular events in all ethnic groups except black women. They
found that the annualized
incidence of fracture was greatest in white and American Indian women and lowest in black women.
|
TABLE 3-4 The Prevalence, Incidence, and Gender Ratios of Fractures Treated in Edinburgh in 2007/2008
|
|||||||||||||||||||||||||||||||||||||||||||||||||||||||||||||||||||||||||||||||||||||||||||||||||||||||||||||||||||||||||||||||||||||||||||||||||
|---|---|---|---|---|---|---|---|---|---|---|---|---|---|---|---|---|---|---|---|---|---|---|---|---|---|---|---|---|---|---|---|---|---|---|---|---|---|---|---|---|---|---|---|---|---|---|---|---|---|---|---|---|---|---|---|---|---|---|---|---|---|---|---|---|---|---|---|---|---|---|---|---|---|---|---|---|---|---|---|---|---|---|---|---|---|---|---|---|---|---|---|---|---|---|---|---|---|---|---|---|---|---|---|---|---|---|---|---|---|---|---|---|---|---|---|---|---|---|---|---|---|---|---|---|---|---|---|---|---|---|---|---|---|---|---|---|---|---|---|---|---|---|---|---|---|
|
osteoporotic fragility fractures. Traditionally, four fractures have
been regarded as osteoporotic or fragility fractures; these being
fractures of the proximal femur, proximal humerus, distal radius, and
thoracolumbar spine. However, it is self-evident that there are many
fractures that commonly occur in osteopenic or osteoporotic bone and
should also be regarded as fragility fractures. Buhr and Cooke2
indicated that humeral diaphyseal fractures, bimalleolar ankle
fractures, and pelvic fractures had a Type F distribution, and they
also demonstrated that proximal radial, femoral diaphyseal, proximal
tibial, and lateral malleolar fractures had a bimodal distribution with
a significant proportion of the fractures occurring in older patients.
Other workers have also shown that there are a considerable number of
fractures that should be regarded as fragility fractures.24,25
defined osteoporotic fractures as occurring at a site associated with a
low-bone-mineral density (BMD) and that also increased in incidence
after the age of 50 years. Based on this definition, Johnell and Kanis24
proposed that vertebral fractures, hip fractures, all other femoral
fractures, wrist and forearm fractures, humeral fractures, rib
fractures, pelvic fractures, clavicular fractures, scapular fractures,
and sternal fractures should be regarded as osteoporotic fractures.
They also suggested that fractures of the tibia and fibula should be
regarded as osteoporotic in women.
are examined, a list of the fragility fractures that may occur in
osteopenic and osteoporotic bone can be drawn up. These are shown in Table 3-6. Table 3-5
shows that there are eight fractures where patients present with an
average age of more than that of patients with distal radial fractures,
this fracture being widely accepted as a fragility fracture. If these
patients are combined with patients who present
with
fracture Types E and F and with those patients over 50 years of age who
present with fracture Types A, D, G, and H, an estimate of the true
scale of the fragility fractures in a developed country can be
obtained. It is interesting to note that all humeral and all femoral
fractures, with the exception of the very rare femoral head fracture,
should now be regarded as fragility fractures as should many long bone
metaphyseal fractures. Based on the fractures shown in Table 3-6 and the patients who presented with Type A, D, G, and H fractures and were over 50 years of age, Court-Brown and Caesar7
estimated that 30.1% of male fractures and 66.3% of female fractures
were potentially fragility fractures. They also pointed out that in a
large Orthopaedic Trauma Unit, 34.7% of outpatient fractures and 70.4%
of inpatient fractures were potentially fragility fractures. This
illustrates the scale of the current problem. It seems likely that the
problem will increase and that with increasing aging of the population
other fractures will be regarded as fragility fractures and will be
added to the list shown in Table 3-6. We
believe that this particularly applies to fractures of the proximal
tibia and scapula although all Type A, D, G, and H fractures will
present more commonly in elderly patients in the future.
|
TABLE 3-5 The Fractures Treated in Edinburgh in 2007-2008 Arranged in Order of Decreasing Average Age
|
||||||||||||||||||||||||||||||||||||||||||||||||||||||||||||||||||||||||||||||||||||||||||||||||||||||||||||||||||||||||||||||||||||||||||||||||||||||
|---|---|---|---|---|---|---|---|---|---|---|---|---|---|---|---|---|---|---|---|---|---|---|---|---|---|---|---|---|---|---|---|---|---|---|---|---|---|---|---|---|---|---|---|---|---|---|---|---|---|---|---|---|---|---|---|---|---|---|---|---|---|---|---|---|---|---|---|---|---|---|---|---|---|---|---|---|---|---|---|---|---|---|---|---|---|---|---|---|---|---|---|---|---|---|---|---|---|---|---|---|---|---|---|---|---|---|---|---|---|---|---|---|---|---|---|---|---|---|---|---|---|---|---|---|---|---|---|---|---|---|---|---|---|---|---|---|---|---|---|---|---|---|---|---|---|---|---|---|---|---|
|
||||||||||||||||||||||||||||||||||||||||||||||||||||||||||||||||||||||||||||||||||||||||||||||||||||||||||||||||||||||||||||||||||||||||||||||||||||||
|
TABLE 3-6 A List of the Fractures Which Should Be Considered as Fragility Fractures
|
||||||||||||||
|---|---|---|---|---|---|---|---|---|---|---|---|---|---|---|
|
Type III in severity. The overall incidence of open fractures in
2007-2008 was 35.4/105/year with an incidence of 53.1/105/year in males
and 19.6/105/year in females. The open fractures had a Type G
distribution curve with the expected increase in young males but also
an increased incidence in older males and females. Further analysis
shows that in patients aged 65 years or older, 48.5% of the open
fractures occurred following a fall from standing height with a further
33% being caused by a direct blow or assault. Only 3 (9.1%) open
fractures in this age group were caused by motor vehicle accidents and
all 3 patients were pedestrians. The fact that most open fractures in
the elderly are caused by low-energy trauma suggests that the aging
soft tissues have the same inherent problems as aging bone!
prevalence of open fractures occurs in tibial diaphyseal fractures. In
the sixth edition of Rockwood and Green,8
it was noted that there was a high incidence of open distal tibial
fractures in 2000. We do not know if the change in the 8-year period is
coincidental. Open fractures of the finger phalanges are relatively
common but rarely severe with the most severe open fractures generally
being seen in the pelvis and lower limb. A number of fractures, such as
those of the proximal femur, proximal humerus, and scapula, did not
present with open wounds during the study period. They may present as
open fractures, but their prevalence is low. The mode of injury also
affects the prevalence of open fractures. In motor vehicle accidents,
pedestrians and motorcyclists will present with more open fractures
than vehicle occupants and cyclists (see Table 3-12). In addition, it is worth noting the very high prevalence of open fractures which occur in the distal femoral diaphysis (see Table 3-22).
|
TABLE 3-7 The Epidemiology of Open Fractures in Edinburgh in 2007 to 2008
|
||||||||||||||||||||||||||||||||||||||||||||||||||||||||||||||||||||||||||||||||||||||||
|---|---|---|---|---|---|---|---|---|---|---|---|---|---|---|---|---|---|---|---|---|---|---|---|---|---|---|---|---|---|---|---|---|---|---|---|---|---|---|---|---|---|---|---|---|---|---|---|---|---|---|---|---|---|---|---|---|---|---|---|---|---|---|---|---|---|---|---|---|---|---|---|---|---|---|---|---|---|---|---|---|---|---|---|---|---|---|---|---|
|
fractures present as isolated injuries, patients may present with more
than one fracture and that there are certain accepted patterns, such as
the association between calcaneal and spinal fractures in a fall from a
height or the association between fractures of the proximal femur and
distal radius in the elderly who present after a fall from a standing
height. Table 3-8 lists the common associated
fractures for each index fracture. The numbers of index and associated
fractures are given as well as their ratio. The higher the ratio, the
more fractures the patient presents with. Table 3-8
shows that fractures of the feet are associated with the highest
fracture ratios, although fractures of the pelvis and scapula are also
associated with a number of other fractures.
hundred and eighty-two (2.8%) presented with multiple fractures of the
hands or feet, and 328 (5.1%) presented with more than one fracture in
different anatomical sites. Of these, 286 patients presented with 2
fractures and the rest presented with up to 7 fractures. The gender
ratio was 49/51 but the male and female patients who presented with
more than one fracture in different sites were very different. The
average age was 33.5 years in males and 50.8 years in females, and the
overall distribution was Type A. Only 20.5% of females who presented
with more than one fracture were less than 50 years of age.
nine basic modes of injury were discussed with motor vehicle injuries
being divided into four different categories: vehicle occupants,
pedestrians, motorcyclists, and cyclists. In this edition, we have
divided the basic modes of injury into eight categories and we have
combined twisting injuries with falls from a standing height as it is
often difficult for patients to separate the two. In the sixth edition,8
falls down stairs and slopes were combined, but in this edition falls
down slopes have been combined with falls from a standing height and
therefore falls down stairs are presented separately. The eight basic
modes of injury are shown in Table 3-9. Gunshot injuries are very uncommon in Scotland and there were none admitted during the study year. The “Other” mode in Table 3-9
contains the patients who could or would not remember their cause of
injury. Many of these were intoxicated at the time of presentation.
standing height. About 57% of fractures were caused by a simple fall,
with 83% of fractures in patients of at least 50 years of age being
caused by a simple fall. The other common causes of injury are sporting
activities and direct blows, assaults, or crush injuries. Sporting
injuries provide a heterogeneous collection of fractures caused by
direct blows, twisting injuries, and falls. They predominantly affect
young males. Direct blows, assaults, or crush injuries accounted for
12.5% of the fractures and these also usually occur in young males.
majority of fractures but this is not the case. In 2000, 7.2% of the
fractures admitted to the Royal Infirmary of Edinburgh followed a motor
vehicle accident, but in 2007-2008 this was reduced to 5.2%. The United
Kingdom has one of the lowest incidences of mortality from motor
vehicle accidents in the world, and it is likely that the morbidity is
also lower than in other countries. Given the fact that unlike the
United States, Germany, and other countries, the United Kingdom does
not have a formalized trauma system, this illustrates the importance of
accident prevention. In Baltimore in a very large U.S. Level I trauma
center, about 60% of fractures are caused by motor vehicle accidents
(see Table 3-33). It is possible to construct
age and gender curves for modes of injury in the same way as can be
done for individual fractures. The eight curves (see Fig. 3-2) used to describe fractures can also be used to describe their mode of injury.
little doubt that with increasing age and infirmity in the population,
fractures resulting from falls from a standing height will become even
more common in the next few decades. Table 3-9
shows that overall, 57.2% of fractures were caused by a simple fall and
that the patients had an average age of 60.2 years. Further analysis
shows that 77.8% of fractures in females followed a simple fall,
compared with 33.8% of fractures in males. The average age was 68.5
years for females and 56.4 years for males, showing that this mode of
injury is common in elderly males and females. Overall fractures caused
by a simple fall have a Type F distribution.
|
TABLE 3-8 The Number of Index Fractures, Associated Fractures, and the Ratio of the Two*
|
||||||||||||||||||||||||||||||||||||||||||||||||||||||||||||||||||||||||||||||||||||||||||||||||||||||||||||||||||||||||||||||||||||||||||||
|---|---|---|---|---|---|---|---|---|---|---|---|---|---|---|---|---|---|---|---|---|---|---|---|---|---|---|---|---|---|---|---|---|---|---|---|---|---|---|---|---|---|---|---|---|---|---|---|---|---|---|---|---|---|---|---|---|---|---|---|---|---|---|---|---|---|---|---|---|---|---|---|---|---|---|---|---|---|---|---|---|---|---|---|---|---|---|---|---|---|---|---|---|---|---|---|---|---|---|---|---|---|---|---|---|---|---|---|---|---|---|---|---|---|---|---|---|---|---|---|---|---|---|---|---|---|---|---|---|---|---|---|---|---|---|---|---|---|---|---|---|
|
||||||||||||||||||||||||||||||||||||||||||||||||||||||||||||||||||||||||||||||||||||||||||||||||||||||||||||||||||||||||||||||||||||||||||||
highest prevalence of fractures following a standing fall is in the
upper limbs. However, this underplays the importance of falls in the
elderly. Analysis of the data concerning the common fragility fractures
shows that 94.2% of proximal femoral fractures, 81.8% of proximal
humeral fractures, 81.7% of pelvic fractures, and 69.6% of distal
radial fractures are caused by simple falls. However, with the changes
in the spectrum of osteoporotic fractures that have already been
documented, it is also interesting to note that 63.2% of humeral
diaphyseal fractures, 84.8% of distal humeral fractures, 65.9% of
femoral diaphyseal fractures, and 74.3% of distal femoral fractures
were also caused by falls. The common fractures caused by falls from a
standing height at different ages are shown in Table 3-11.
|
TABLE 3-9 The Average Age, Prevalence, and Gender Ratio for the Eight Basic Modes of Injury in Edinburgh
|
||||||||||||||||||||||||||||||||||||
|---|---|---|---|---|---|---|---|---|---|---|---|---|---|---|---|---|---|---|---|---|---|---|---|---|---|---|---|---|---|---|---|---|---|---|---|---|
|
a ninth distribution curve was used to describe those fractures caused
by a fall down stairs or slopes. If the falls down slopes are removed,
it becomes apparent that falls down stairs, like falls from a standing
height, have a Type F distribution and affect older patients. Tables 3-9, 3-10 and 3-11
show that the overall distribution of fractures is very similar to
those caused by a simple fall, although the average age of the patients
is slightly younger. Table 3-9 shows that the
average age of the patients is 54.6 years, with an average age of 56.6
years in females and 50.8 years in males. The most common fracture
following a fall down stairs is a fracture of the distal radius and
ulna (20.3%), followed by ankle fractures
(18.8%) and proximal femoral fractures (7.3%). The common fractures caused by falls down stairs at different ages are shown in Table 3-11.
|
TABLE 3-10 The Prevalence of Upper Limb, Lower Limb, and Pelvic Fractures for the Eight Basic Modes of Injury in Edinburgh
|
||||||||||||||||||||||||||||||||||||
|---|---|---|---|---|---|---|---|---|---|---|---|---|---|---|---|---|---|---|---|---|---|---|---|---|---|---|---|---|---|---|---|---|---|---|---|---|
|
|
TABLE 3-11 The Prevalences of the Most Common Fractures Associated with the Different Modes of Injury
|
||||||||||||||||||||||||||||||||||||
|---|---|---|---|---|---|---|---|---|---|---|---|---|---|---|---|---|---|---|---|---|---|---|---|---|---|---|---|---|---|---|---|---|---|---|---|---|
|
shows that they are relatively uncommon and usually occur in younger
males, giving them a Type B distribution. This mode of injury is
unusual in that the average age of males and females is virtually
identical. The average for males was 38.7 years and for females 38.1
years. In younger patients, Table 3-11 shows that falls from a height are associated with a high prevalence of calcaneal fractures and pelvic fractures (also see Table 3-10).
These tend to be replaced by distal radial and ankle fractures in older
patient groups, but there is a surprisingly high prevalence of scapular
fractures in the over 60 age group. The other fracture that must be
looked for following a fall from a height is that of the thoracolumbar
spine,29 which may also be associated with a calcaneal fracture.
males and have a Type B distribution. The average age of males was 31.9
years and 40.4 years in females. In young males, direct blows are
usually punch injuries or kicks which accounts for the high prevalence
of metacarpal, finger, and toe fractures. In older patients, it tends
to be finger fractures that present more commonly than metacarpal
fractures. Altogether, 50% of all metacarpal fractures and 33.8% of all
finger phalangeal fractures were caused by a direct blow or assault.
They are a particular problem in adolescence and will be discussed
further in the section dealing with the epidemiology of adolescent
fractures. They are not infrequently associated with social deprivation.32
present after twisting injuries, falls, direct blows, motor vehicle
accidents, and cycling accidents. In addition, there is an association
between stress fractures and sporting activity. Stress fractures are
discussed further in Chapter 19. In general, sports fractures show a Type C distribution with young males and females being affected, though Table 3-9 shows that more fractures occur in males. Table 3-10 shows that most sports injuries affect the upper limb, though Table 3-11 indicates that ankle fractures are relatively common in older sportsmen and women.
fractures will vary throughout the world depending on the degree of
affluence, availability of resources, and the popularity of different
sports. Thus, an analysis of sports fractures from Edinburgh will not
include injuries from sports such as baseball, American football, ice
hockey, or cross country skiing. However, many sports are universally
popular. Examples of these are soccer, rugby, skiing, field hockey,
basketball, athletics, and horse riding. Court-Brown et al.11
examined the epidemiology of sports-related fractures in depth. They
found that in the United Kingdom, 10 sports accounted for 86.8% of the
fractures, with soccer and rugby together being responsible for 59.2%
of fractures.
Soccer
is the world’s most popular sport. It is probably the second most
common cause of tibial diaphyseal fractures after motor vehicle
accidents,10 but 47% of soccer-related fractures are in the hand and wrist, with a further 26% occurring in the foot and ankle.11
shows that this is not the case. Our results will not be equivalent to
other parts of the world, as the United Kingdom has fairly strict laws
regarding alcohol consumption and speeding. The importance of accident
prevention has already been alluded to. Overall motor vehicle accident
fractures have a Type B distribution with a unimodal peak in young
males and a constant low incidence in females. Upper limb fractures are
more commonly seen (see Table 3-10) but the spectrum of fractures varies with the type of injury. See Tables 3-34 and 3-35 for further information about motor vehicle accidents in Baltimore.
stricter seatbelt, speeding, and alcohol legislation, vehicle occupants
now have the lowest prevalence of fractures in motor vehicle accidents.
Table 3-12 shows only 11.2% of motor vehicle
accident fractures occurred in vehicle occupants. There is a Type H
distribution of fractures with a bimodal distribution being seen in
both males and females. Analysis of the fractures showed that 48.7%
occurred in the upper limb, 46.1% in the lower limb, and 5.1% were
pelvic fractures. It should be remembered that spinal fractures may
also occur in vehicle occupants.
and further analysis shows that they have Type G distribution of
fractures with bimodal peaks in younger and older males but a unimodal
peak in older women. In fact, 58.3 % of female pedestrians presenting
with fractures were over 70 years of age compared with 19% of males.
Not unexpectedly, there was a higher prevalence of lower limb fractures
in pedestrians, with 50.6% of fractures being in the lower limb
compared with 44% in the upper limb and 5.3% in the pelvis. The most
common fractures associated with pedestrian injuries are shown in Table 3-12, which also shows that 12% of the fractures were open.
|
TABLE 3-12 The Prevalence, Average Age, and Gender Ratio of Patients who Sustained Fractures in Road Traffic Accidents*
|
||||||||||||||||||||||||||||||||||||||||||
|---|---|---|---|---|---|---|---|---|---|---|---|---|---|---|---|---|---|---|---|---|---|---|---|---|---|---|---|---|---|---|---|---|---|---|---|---|---|---|---|---|---|---|
|
||||||||||||||||||||||||||||||||||||||||||
Type B distribution with most motorcycle fractures occurring in young
men. Table 3-12 shows that there are
relatively few motorcycle fractures in women. Many of the fractures
that occur in motorcyclists are severe but overall, Table 3-12
shows that metacarpal, ankle, and clavicular fractures are most
commonly seen. However, the severity of the fractures is indicated by
the fact that 13.9% were open fractures. Overall, 53% of the fractures
were in the upper limb, 43.4% were in the lower limb, and 6.6% were
pelvic fractures.
significant number of female cyclists who present with fractures.
Overall, there is a Type C distribution. These fractures show a
different distribution from other motor vehicle accident fractures as
84.2% are in the upper limb with only 15% occurring in the lower limb.
Pelvic fractures are very rare. The most common fracture types are
shown in Table 3-12, which also shows that open fractures are unusual.
spontaneous fractures are in fact insufficiency fractures occurring in
older patients. In this study, there were few fatigue fractures in
younger
patients and it seems likely that with increasing numbers of elderly in
the population more insufficiency fractures will be seen. In the sixth
edition of Rockwood and Green,8
spontaneous/stress fractures were noted to have a Type H distribution
with fatigue fractures occurring in younger patients and insufficiency
fractures in older patients. In this study, the distribution showed a
Type F curve, and it seems likely that this will continue to be the
case as there will be many more insufficiency fractures in the elderly
than fatigue fractures in the young. The distribution of fatigue
fractures is a Type C curve affecting younger males and females. Table 3-11
shows that in the over 60 age group, insufficiency fractures tend to
occur in the proximal femur, femoral diaphysis, or humeral diaphysis.
history as to how their fracture occurred. The two most common causes
of this are excessive alcohol intake or dementia. In this study, 93.4%
of patients were intoxicated on presentation. Many of the fractures
will have been sustained in falls or fights, and a review of the 16-39
year age group (see Table 3-11) shows that the
fracture distribution is similar to that seen in direct blows or
assaults. In the 40-59 year age group, we suspect that many fractures
followed falls, and it is interesting to note that distal radial
fractures were not a significant problem, suggesting that alcohol
prevented the patients from putting their hand out to stop their fall!
caused by firearms is sparse. They are relatively uncommon in Europe,
but the North American literature strongly suggests that they have a
Type B distribution and most commonly occur in young males. Gunshot
mortality and morbidity are greater in the United States, where the
large urban Level I trauma centers see a disproportionate number of
fractures caused by firearms. See Table 3-39 for information about the epidemiology of fractures caused by gunshot injuries in Baltimore.
of the clavicle account for about 4% of all fractures. Overall, they
have a Type G distribution occurring in young males but in both older
males and females. However, if they are subdivided according to their
location within the clavicle, fractures of the medial and lateral
thirds of the clavicle have a Type A distribution while the more common
middle third fracture has a Type G distribution (see Table 3-2). Table 3-13
shows that fractures of the medial third of the clavicle are rare, and
it should be remembered that in young patients they may well be physeal
fractures. The more common middle and lateral third fractures are
different with lateral third fractures tending to occur in slightly
older patients although the gender ratio is very similar. Overall, Table 3-13
shows that falls from a standing height, sporting injuries, and motor
vehicle accidents account for about 85% of clavicle fractures. However,
if one compares the mode of injury of middle and lateral third
fractures, sporting injuries cause most middle third fractures (39.7%)
and falls from a standing height cause most lateral third fractures
(58.4%). This is a reflection of the different averages ages of the
patients who present with the two fractures.
|
TABLE 3-13 The Basic Epidemiological Characteristics of Clavicle Fractures
|
|||||||||||||||||||||||||||||||||||
|---|---|---|---|---|---|---|---|---|---|---|---|---|---|---|---|---|---|---|---|---|---|---|---|---|---|---|---|---|---|---|---|---|---|---|---|
|
|||||||||||||||||||||||||||||||||||
fractures are comparatively rare, accounting for 0.7% of all the
fractures seen during the year. We believe that their epidemiology is
changing and that there are now many more elderly patients presenting
with scapular fractures. They have a Type A distribution, and Table 3-5
shows that 36.5% occur in patients aged at least 65 years. We have
subdivided the scapula into fractures of the body, neck, acromion,
coracoid, and glenoid, and the epidemiology for the different fractures
is shown in Table 3-14. This shows that the
most common scapular fractures are those in the glenoid and body.
Coracoid fractures are rare with acromion and neck fractures each
accounting for 11%-14% of scapular fractures. About 65% of glenoid
fractures were associated with shoulder dislocations. It is interesting
to note that all fracture types have a similar average age and further
analysis showed that acromion, body, neck, and glenoid fractures all
had a Type A distribution. Most fractures are caused by a simple fall.
The average age for this group was 60.4 years and 50% presented with an
associated dislocation. The average age of the patients injured in
motor vehicle accidents was 30.1 years and 85.7% were male.
F distribution and are accepted to be fragility fractures. In this
study, 81.8% resulted from a fall from a standing height and the
average age of this group was 70.7 years. The second most common cause
was motor vehicle accidents, with 4.7% of fractures being caused in
this way. The average age of this group was 42.1 years. The third most
common cause was sporting injuries, with 3.9% of fractures occurring in
patients with an average age of 39.4 years.
|
TABLE 3-14 The Basic Epidemiological Characteristics of Scapular Fractures
|
|||||||||||||||||||||||||||||||||||||||||||||
|---|---|---|---|---|---|---|---|---|---|---|---|---|---|---|---|---|---|---|---|---|---|---|---|---|---|---|---|---|---|---|---|---|---|---|---|---|---|---|---|---|---|---|---|---|---|
|
|||||||||||||||||||||||||||||||||||||||||||||
regarded as fragility fractures. The average age of the patients was
older than in those patients who presented with distal radial fractures
(see Table 3-5), and although humeral
diaphyseal fractures have a Type H distribution, we think it likely
that this will change to a Type F distribution in decades to come. Table 3-5
shows that over 38% of patients are aged at least 65 years. This
accounts for the fact that 63% of the fractures were caused by a simple
fall. A further 11.8% were sport injuries, with 37.5% of these being
caused by arm wrestling, a recognized cause of distal diaphyseal
fractures of the humerus. All 3 patients were intoxicated! In 5
patients (7.3%), the fractures were spontaneous and surgeons should be
aware of the possibility of pathological fractures following humeral
metastases.
humeral fractures are relatively uncommon, accounting for only 0.7% of
the fractures in this study. Surgeons may be surprised that overall
they have a Type E distribution as much of the literature has centered
on the complex intra-articular distal humeral fractures seen in younger
patients after high-energy trauma. However, Table 3-5
shows that about 55% of patients are at least 65 years of age on
presentation. In fact, 63% of the patients in this study presented with
extra-articular supracondylar fractures, with 28.2% presenting with
partial articular fractures and only 8.7% with complete articular
fractures. The average ages were 68.8, 51.5, and 52.7 years,
respectively, indicating that if supracondylar distal humeral fractures
were graded separately in Table 3-5, they
would be third in terms of age after proximal femoral and femoral
diaphyseal fractures. Given these average ages, it will not be
surprising that 84.8% of distal humeral fractures were caused by simple
falls with the average age of this group being 69.1 years. A further
6.5% of fractures occurred as the result of sports injuries with 6.5%
also occurring in motor vehicle accidents. These occurred in younger
patients the average ages being 26 and 30 years respectively.
Overall, they show a Type D distribution. As has already been pointed
out, however, if one analyzes the different proximal forearm fractures,
it is evident that there are a number of different fracture types. Table 3-2
shows that radial head fractures have a Type H distribution while
radial neck fractures have a Type A distribution. The two remaining
fractures of the proximal forearm, those of the olecranon and combined
fractures of the proximal radius and ulna, are both Type F fractures
and should be regarded as fragility fractures.
|
TABLE 3-15 The Basic Epidemiological Characteristics of Proximal Forearm Fractures
|
||||||||||||||||||||||||||||||||||||||||
|---|---|---|---|---|---|---|---|---|---|---|---|---|---|---|---|---|---|---|---|---|---|---|---|---|---|---|---|---|---|---|---|---|---|---|---|---|---|---|---|---|
|
||||||||||||||||||||||||||||||||||||||||
a standing height account for about 60% of proximal forearm fractures.
The average age of this group was 55 years. A further 24% of fractures
were caused in motor vehicle accidents or by sports injuries. The
average ages of these two groups were 36.2 and 29.7 years, respectively.
of the diaphyses of the radius and ulna account for 0.9% of all
fractures in this study. Overall, they have a Type D pattern that is
made up of three different patterns seen in the three different types
of forearm fractures. Isolated ulnar fractures have a Type H
distribution, whereas isolated radial fractures have a Type A
distribution. Fractures of both the ulna and radial diaphyses also have
a Type A distribution. This actually differs from the fracture
distribution noted in the sixth edition of Rockwood and Green,8 where radial and ulna fractures had a Type B distribution curve affecting young males. Table 3-16
shows that this is not the case in this study. The change may simply be
fortuitous or it may represent increasing age in patients with forearm
fractures. The most common
causes of forearm fractures are listed in Table 3-16.
The most common cause of isolated radial fractures was sports injury,
which accounted for 50% of these fractures. In isolated ulnar
fractures, the most common causes were direct blows and simple falls,
which both caused 25.6% of fractures. In radial and ulna fractures, the
most common cause was a simple fall, which caused 38.5% of fractures.
The average of age of this group was 60 years.
|
TABLE 3-16 The Basic Epidemiological Characteristics of Forearm Fractures
|
|||||||||||||||||||||||||||||||||||
|---|---|---|---|---|---|---|---|---|---|---|---|---|---|---|---|---|---|---|---|---|---|---|---|---|---|---|---|---|---|---|---|---|---|---|---|
|
|||||||||||||||||||||||||||||||||||
common fractures that orthopaedic surgeons have to treat, accounting
for about 16% of all fractures (see Table 3-4).
In this study, isolated distal ulnar fractures were included with
fractures of the distal radius and fractures of the distal radius and
ulna. There were 32 (2.8%) isolated distal ulna fractures compared with
1115 (97.2%) distal radial fractures. Both have a Type A distribution,
but there are slight epidemiological differences that are shown in Table 3-17.
This shows that about 70% of distal radial and ulna fractures are
caused by a simple fall. The average age of this group was 65.7 years
and 84.7% were female. Predictably, the average age of the patients
whose distal radial fractures and ulna fractures were caused by
sporting injuries was less at 40 years and only 28% were female.
also examined distal radial fractures in a region of Japan and showed
that between 1986 and 1995, the incidence of distal radial fracture
rose in women but not in men. Brogren et al.1
examined the incidence of distal radial fracture in Southern Sweden in
2001 in patients aged 18 or older and showed it to be 260/105/year.
They stressed that it was lower than earlier series, and they wondered
whether the incidence of distal radial fractures was declining. A
further Scandinavian study compared the incidence of distal radial
fractures in Oslo, Norway, in 1978 and 1998 and found no difference.
They observed that Oslo had the highest rates of hip and distal radial
fractures in the world but that the risk was lower in immigrant Asians
than in ethnic Norwegians.
The most common carpal bone to be fractured in the scaphoid (carpal
navicular), but in this study, there were also fractures in the
capitate, hamate, lunate, pisiform, trapezium, trapezoid, and
triquetrum. Most of these fractures were very unusual, but there were
sufficient fractures of the triquetrum, hamate, and trapezium to
warrant further analysis. Table 3-18 shows the
epidemiology of the four most commonly fractured carpal bones. Although
the carpal bones have a Type A distribution curve overall, fractures of
the scaphoid, hamate, and trapezium tend to occur in young males. They
all have Type B distribution curves whereas the triquetrum has a Type A
distribution (see Table 3-2). The average age is particularly young in hamate and trapezium fractures. Table 3-18
also shows that over 80% of carpal fractures are caused by simple
falls, sports injuries, or direct blows or assaults. As might be
guessed from the gender ratio and average age, 80% of trapezium
fractures and 54% of hamate fractures were caused by direct blows
compared with 11% of scaphoid fractures. Most scaphoid fractures
(40.7%) were caused by simple falls onto the wrist although 32.8%
followed sporting injuries.
|
TABLE 3-17 The Basic Epidemiological Characteristics of Fractures of the Distal Radius and Ulna
|
||||||||||||||||||||||||||||||
|---|---|---|---|---|---|---|---|---|---|---|---|---|---|---|---|---|---|---|---|---|---|---|---|---|---|---|---|---|---|---|
|
||||||||||||||||||||||||||||||
|
TABLE 3-18 The Basic Epidemiological Characteristics of Carpal Fractures
|
||||||||||||||||||||||||||||||||||||||||
|---|---|---|---|---|---|---|---|---|---|---|---|---|---|---|---|---|---|---|---|---|---|---|---|---|---|---|---|---|---|---|---|---|---|---|---|---|---|---|---|---|
|
||||||||||||||||||||||||||||||||||||||||
fractures are the third most common fractures seen by orthopaedic
surgeons, comprising about 10% of all fractures. They are common in
young males and have a Type B distribution. In this study, there were
738 separate metacarpal fractures, with 86.2% presenting as a single
metacarpal fracture. The remaining 13.8% presented as fractures of two,
three, or four metacarpals with fractures of three and four metacarpals
being rare (Table 3-19). If one considers just
the single metacarpal fractures, 52.6% were fractures of the fifth
metacarpal and 15% involved the fourth metacarpal. Table 3-19
shows that the average age of patients who present with metacarpal
fractures is very similar no matter which metacarpal is fractured and
all have Type B distributions.
direct blow or assault, with 54.1% of the patients admitting to this.
It is likely that not all patients were honest and the figure may be
higher! In fifth metacarpal fractures, 64.2% were caused by a direct
blow or assault compared with 17.8% of first metacarpal fractures,
51.4% of second metacarpal fracture, 30.9% of third metacarpal
fractures, and 52.3% of fourth metacarpal fractures. Unsurprisingly,
the gender ratio for metacarpal fractures caused by an assault was
90:10 (male:female).
|
TABLE 3-19 The Basic Epidemiological Characteristics of Metacarpal Fractures
|
||||||||||||||||||||||||||||||||||||||||||||||||||||||||||||
|---|---|---|---|---|---|---|---|---|---|---|---|---|---|---|---|---|---|---|---|---|---|---|---|---|---|---|---|---|---|---|---|---|---|---|---|---|---|---|---|---|---|---|---|---|---|---|---|---|---|---|---|---|---|---|---|---|---|---|---|---|
|
||||||||||||||||||||||||||||||||||||||||||||||||||||||||||||
fractures, the most common combination was fractures of the fourth and
fifth metacarpals (56.4%), followed by fractures of the third and
fourth metacarpals (30.8%). As with single metacarpal fractures, direct
blows or assaults were the most common cause of two metacarpal
fractures, with 46.1% being so caused compared with 17.9% following a
sports injury or a simple fall.
too dissimilar to that of metacarpal fractures. They account for about
10% of all fractures (see Table 3-4) and, like metacarpal fractures, they tend to occur in young males and have a Type B distribution. Table 3-20
shows an analysis of the epidemiology of the individual fingers. As
with metacarpal fractures, the index and middle fingers are least
affected, and it is the little finger that is most affected. However,
unlike metacarpal fractures, the thumb phalanges are more commonly
affected than those of the ring finger. The average age and gender
ratio of fractures of the individual fingers is very similar and all
have a Type B distribution. Fractures of more than one finger are
relatively rare but, as with patients who have fractures of two or more
metacarpals (see Table 3-19), it is
interesting to note that the higher average age and the different
gender ratio suggest that multiple fractures of the fingers tend to
occur in older patients.
|
TABLE 3-20 The Basic Epidemiological Characteristics of Finger Phalangeal Fractures
|
|||||||||||||||||||||||||||||||||||||||||||||||||||||||
|---|---|---|---|---|---|---|---|---|---|---|---|---|---|---|---|---|---|---|---|---|---|---|---|---|---|---|---|---|---|---|---|---|---|---|---|---|---|---|---|---|---|---|---|---|---|---|---|---|---|---|---|---|---|---|---|
|
|||||||||||||||||||||||||||||||||||||||||||||||||||||||
of metacarpal fractures. Direct blows or assaults accounted for 35.2%
of fractures. If this combined with fractures caused by sporting
injuries and falls from a standing height, it is apparent that 87.2% of
finger fractures are caused by these three modes of injury. Analysis of
the modes of injuries of individual finger fractures does show some
differences from metacarpal fractures. The two fingers most commonly
fractured by direct blows or assaults are the middle (46.9%) and ring
(45.0%) fingers, whereas it is the thumb (35.2%) and index finger
(35.4%), that are most commonly affected in sporting injuries. Falls
from a standing height most commonly cause fractures of the ring
(27.0%) and little fingers (27.8%).
Not only are proximal femoral fractures the most common fracture to be
operatively treated, but the high average age of patients who present
with these fractures means that the patients are often very frail and
have extensive medical comorbidities. Thus, all health systems incur
considerable expense in looking after these patients.
year. A comparison with data from the Edinburgh Trauma Unit from 1998,
10 years earlier, shows that the overall incidence for hip fractures
was the same in 1998 but that the overall incidence of hip fractures in
males of all ages was 70.5/105/year and 240.1/105/year
for females. This indicates a change in the incidence of hip fractures
such that the incidence in males is rising while it appears to be
falling in females.
studied hip fractures in Switzerland between 1991 and 2000. In patients
aged at least 50 years, the incidence of hip fractures in males was
153/105/year and 455/105/year
in females. Overall, the incidence in females fell over the study
period but rose slightly in males. In Australia, Chang et al.4 observed a decreased incidence of hip fractures in both males and females between 1989 and 2000. Kannus et al.26
studied the incidence of hip fractures in older adults in Finland
between 1970 and 2004. They showed that the number of hip fractures in
Finns aged at least 50 years rose between 1970 and 1997 but that the
rise then levelled off in both sexes although the decline was greater
in women. They postulated that the reasons for the decline might be a
cohort effect towards healthier elderly populations in the developed
countries, but they also suggested that it might relate to increased
bone mass, improved functional ability, and campaigns to treat
osteoporosis.
varies throughout the world for reasons discussed earlier in this
chapter. However, in developed countries it seems that the high rise in
the incidence of hip fractures noted after the second World War is
gradually levelling off. This has been well documented in Finland,26 and presumably other countries will show the same epidemiological changes in years to come.
Femoral head fractures are extremely rare even in Level I Trauma
Centers. The unit actually treated two during the study year, but they
were both from outside the study area and were not included in the
study. A review of a recent paper dealing with the management of
femoral head fractures indicates that they are a Type B fracture
occurring mainly in young males.21
In this study, intracapsular fractures were more commonly seen than
extracapsular fractures, but both are very common and both have a Type
F distribution. Their descriptive criteria are very similar and
virtually all are caused by falls from a standing height.
such a major change in their epidemiology in the last 20-30 years. The
femoral diaphyseal fracture was essentially the fracture that caused
many surgeons to change from operative to nonoperative management in
the 1970s. It was associated with young patients and high-energy
trauma, but it is educational to review the papers of Buhr and Cooke2 and Knowelden et al.28
who recognized that, even in the 1950s, femoral diaphyseal fractures
had a bimodal distribution and often occurred in older patients. The
change in their epidemiology is highlighted by the fact that in 1990,
the average age of patients presenting to the Edinburgh Orthopaedic
Trauma Unit with femoral diaphyseal fractures was 44 years. Table 3-5 shows that in 2007-2008, the average age was 69.5 years. However, they have a Type A distribution (see Table 3-2).
A review of the database in the Edinburgh Orthopaedic Trauma Unit shows
that there was a decline in the incidence of femoral diaphyseal
fracture throughout the 1990s, but we think it possible that the
incidence is rising again mainly because of the increasing numbers of
periprosthetic fractures that orthopaedic surgeons are seeing.
|
TABLE 3-21 The Basic Epidemiological Characteristics of Proximal Femoral Fractures
|
|||||||||||||||||||||||||||||||||||
|---|---|---|---|---|---|---|---|---|---|---|---|---|---|---|---|---|---|---|---|---|---|---|---|---|---|---|---|---|---|---|---|---|---|---|---|
|
|||||||||||||||||||||||||||||||||||
|
TABLE 3-22 The Basic Epidemiological Characteristics of Femoral Diaphyseal Fractures
|
||||||||||||||||||||||||||||||||||||||||||||||||||||||
|---|---|---|---|---|---|---|---|---|---|---|---|---|---|---|---|---|---|---|---|---|---|---|---|---|---|---|---|---|---|---|---|---|---|---|---|---|---|---|---|---|---|---|---|---|---|---|---|---|---|---|---|---|---|---|
|
||||||||||||||||||||||||||||||||||||||||||||||||||||||
diaphyseal fractures have been divided in two ways. We have divided
them according to their location within the diaphysis but also by
whether they were periprosthetic fractures or not. Table 3-22
shows that subtrochanteric fractures have a similar age to those of the
proximal femur, and it is interesting to observe that 58.7% of the
femoral fractures were subtrochanteric. In previous years, there were
higher rates of middle and distal third fractures. Table 3-22
also shows that fractures of the distal femoral diaphysis tend to be
more severe, with 22.2% being open. In this group, 44.4% of the
fractures were caused by a simple fall, but 27.7% resulted from a motor
vehicle accident. In middle third fractures, 55% resulted from a simple
fall, 20% were sports injuries, and 5% followed a motor vehicle
accident.
the femoral fractures were periprosthetic. These have a Type F
distribution. It is clear that the prevalence of periprosthetic
fractures is rising. In 2000, 29.1% of our femoral fractures were
periprosthetic and, in years to come, it is likely that their
prevalence will continue to rise. More detailed analysis of the
periprosthetic fractures shows that 82.5% of these fractures were
related to hip and knee implants and 17.2% to implants used to treat
previous fractures.
accounting for only 0.6% of the fractures seen in 2007-2008. As with
all femoral fractures, with the exception of the rare femoral head
fracture, they should now be regarded as fragility fractures as Table 3-5 shows the average age for patients was 63.3 years. They have a Type E distribution (see Table 3-2).
As with femoral diaphyseal fractures, there is an increased prevalence
of periprosthetic fractures of the distal femur and 15.4% of distal
femoral fractures were periprosthetic. Table 3-23
shows the epidemiology of both periprosthetic and nonperiprosthetic
distal femoral fractures. It also indicates that most distal femoral
fractures, whether or not they are related to a prosthesis, are
low-energy injuries in older patients. As with femoral diaphyseal
fractures, the majority (83.3%) of periprosthetic distal femoral
fractures were related to prostheses rather than to trauma implants.
|
TABLE 3-23 The Basic Epidemiological Characteristics of Distal Femoral Fractures
|
||||||||||||||||||||||||||||||||||||
|---|---|---|---|---|---|---|---|---|---|---|---|---|---|---|---|---|---|---|---|---|---|---|---|---|---|---|---|---|---|---|---|---|---|---|---|---|
|
||||||||||||||||||||||||||||||||||||
this study. They should be regarded as fragility fractures, and they
have a Type F distribution. Most are caused by a fall from a standing
height (73.2%), although 8.9% were caused by motor vehicle accidents
and 7.1% by falls down stairs.
all fractures. They have a Type H distribution with bimodal peaks in
both males and females. However, it is likely that in years to come
they will be regarded as fragility fractures as the proportions of
older and younger patients change. Analysis of the proximal tibia
fractures shows that 22.5% were extra-articular fractures, 57.5% were
partial articular fractures, and the remaining 10% were complete
articular fractures. The most common cause of a proximal tibia fracture
was a fall from a standing height (51.2%), followed by motor vehicle
accidents (23.7%) and sports injuries (7.5%). The average ages of these
patients were 66.0, 45.2, and 36.2 years, respectively.
fractures is declining presumably as the result of improved road safety
measures. Analysis of tibial diaphyseal fractures between 1988 and 1990
in our unit showed that 37.5% of fractures followed motor vehicle
accidents, 30.9% were caused by sports injuries, and a further 17.8%
were caused by falls from a standing height.10
Almost 20 years later, 27.4% of our tibial diaphyseal fractures
followed sports injuries, 20.5% occurred as a result of a motor vehicle
accident, and 32.8% followed a fall from a standing height. This
emphasizes the significant changes in the epidemiology of this fracture.
in 2004. They had a lower prevalence of open fractures with an overall
rate of 12%, but they also found that the rate decreased through their
study period. They found that 48% of their fractures were caused by a
fall from a standing height, with only 21% being caused by a motor
vehicle accident. Sweden is an affluent country and it is likely that
other countries will have the same changes in epidemiology in the
future. Our results clearly suggest that it is occurring in the United
Kingdom.
We had a higher rate of open fractures than seen in the Swedish study,
but the epidemiology of both closed and open fractures were very
similar. The average ages for the closed and open fracture groups were
38.9 and 43.1 years, respectively, with gender ratios of 79/21 and
75/25 (male/female). In the open fracture group, 62.5% were caused by
motor vehicle accidents with 80% of these fractures being Gustilo18
Type III in severity. In the closed fracture group, 36.8% followed a
simple fall, 35.1% occurred in sports accidents, and only 8.8% were
caused by motor vehicle accidents.
fractures: those with an intact fibula. These comprised 21.9% of the
tibial fracture group. Their epidemiological characteristics are
different in that the average age was 29.1 years and the gender ratio
was 88/12 (male/female). This group of fractures has a Type B
distribution.
orthopaedic literature is the isolated fibular fracture which is not
related to an ankle fracture or a tibial diaphyseal fracture. These are
rare injuries, and Table 3-4 shows that they
accounted for only 0.3% of the fractures seen in the study year. The
average age of the patients was 40.6 years, and the fracture has a Type
B distribution. There are two basic types of fibular fracture with
57.7% occurring in the fibular diaphysis and 42.3% in the proximal
fibula. The average ages and gender ratios were 38.4 years for males
and 42.2 years for females and 87/13 and 64/36, respectively. Most of
the fractures (34.6%) followed sport injuries, with 26.9% occurring as
a result of a motor vehicle accident and 19.2% as a result of a fall
from a standing height.
comparatively uncommon, accounting for only 0.7% of all fractures. They
have a Type D distribution occurring in younger and older males but
also in older females. We were surprised by the low rate of open distal
tibial fractures (see Table 3-7) compared with 2000,8
when 16.6% of distal tibial fractures were open. This suggests that
there are fewer fractures being caused by high-energy injuries when
compared with 8 years ago. The most common cause of distal tibial
fractures in 2007-2008 was falls from a standing height (32.6%),
followed by falls from a height (26.9%) and sporting injuries (21.1%).
The average ages of these groups was 61.1, 34.1, and 35.4 years,
respectively, showing the increasing incidence of these fractures in
the elderly.
Overall, they have a Type A distribution. If they are classified
according to the location of the fracture, it is apparent that lateral
malleolar fractures have a Type A distribution whereas medial malleolar
fractures have a Type D distribution. Suprasyndesmotic fractures have a
Type C distribution and both bimalleolar and trimalleolar fractures
have a Type E distribution and should be regarded as fragility
fractures. This should not be a surprise as 50 years ago, Buhr and Cooke2
drew attention to the numbers of elderly patients who presented with bimalleolar fractures.
have drawn attention to the increased incidence of ankle fractures in
patients aged at least 60 years since the early 1970s. Like hip
fractures, a review of the Finnish hospital register has shown that the
incidence of elderly ankle fractures stabilized in Finland in the
1990s. The authors recorded an overall incidence of 57/105/year in 1970, compared with 169/105/year in 1997. Since then, the incidence has declined. In women, it has declined from 199/105/year in 1997 to 173/105/year in 2006, and in men, the equivalent values were 123/105/year and 100/105/year. In 2007-2008, our incidence in women aged 60 years or more was 214.1/105/year with 95.5/105/year being recorded in males. Thus, the incidence in the United Kingdom appears to be somewhat more than in Finland.
It shows that ankle fractures tend to occur as a result of low-energy
trauma as might be expected from the average ages and gender ratios.
Suprasyndesmotic fractures are less commonly caused by simple falls
(50.6%). They are more commonly caused by sports injuries (20.7%) and
motor vehicle accidents (7.8%).
account for 0.5% of fractures and have a Type C distribution, being
commonly seen in young males and females. For the purposes of
describing their basic epidemiology, Table 3-25
shows talar fractures divided into head, neck, and body fractures. Head
fractures are very rare and only one was treated in the study year. The
other talar fractures were fairly evenly divided between talar body and
talar neck fractures. Those fractures caused by a simple fall tend to
be minor avulsion fractures of the neck, occurring in the few elderly
patients who presented with talar fractures. The average age of this
group was 56.1 years compared with 26.0 years for the sports injury
group and 23.2 years for the patients injured in motor vehicle
accidents.
for 0.8% of fractures. They have a different distribution from talar
fractures, and they have a Type G distribution curve with an increasing
number of elderly females presenting with calcaneal fractures.
Conventionally, calcaneal fractures are separated into intra-articular
fractures, involving the posterior facet, extra-articular fractures,
and fractures of the processes or tuberosities. In Table 3-26,
the latter two fracture types have been combined and the
epidemiological characteristics of intra-articular posterior facet
fractures and extra-articular fractures are presented. Intra-articular
fractures have a Type B distribution and tend to affect younger men.
Extra-articular fractures have a Type G distribution curve, and there
are a number of older men and women who present with these fractures.
The most common mode of injury is a fall from a height, and if the
intra-articular group is examined, it can be seen that 70.6% of these
fractures were caused by a fall from a height.
|
TABLE 3-24 The Basic Epidemiological Characteristics of Ankle Fractures
|
|||||||||||||||||||||||||||||||||||
|---|---|---|---|---|---|---|---|---|---|---|---|---|---|---|---|---|---|---|---|---|---|---|---|---|---|---|---|---|---|---|---|---|---|---|---|
|
|||||||||||||||||||||||||||||||||||
|
TABLE 3-25 The Basic Epidemiological Characteristics of Talar Fractures
|
|||||||||||||||||||||||||||||||||||
|---|---|---|---|---|---|---|---|---|---|---|---|---|---|---|---|---|---|---|---|---|---|---|---|---|---|---|---|---|---|---|---|---|---|---|---|
|
|||||||||||||||||||||||||||||||||||
are unusual and together they comprise 0.5% of fractures. They have a
Type C distribution mainly affecting younger males and females. Table 3-27
shows the epidemiological characteristics for fractures of the cuboid,
navicular, and cuneiform. It shows that fractures of the cuboid are the
most common midfoot fractures. Fractures of the cuneiform most commonly
affect the medial cuneiform, with 80% of the cuneiform fractures being
located in the medial cuneiform. In 20% of patients with cuneiform
fractures, more than one cuneiform was fractured.
there were only 359 isolated metatarsal fractures with a further 40
patients presenting with multiple fractures having fractured between
two and five metatarsals. Overall, patients who present with metatarsal
fractures have a Type A distribution. The basic epidemiology of the
different isolated metatarsals and the multiple group is shown in Table 3-28.
Fractures of the fifth metatarsal are by far the most common, and they
have a slightly different epidemiological profile from other isolated
metatarsal fractures. They more commonly occur in women, and patients
with fractures of the fourth and fifth metatarsals tend to have a
higher average age than patients with fractures of the first, second,
and third metatarsals. The most common combination of multiple
metatarsal fractures are fractures of the second and third metatarsals,
which accounted for 32.5% of the multiple fractures. The most common
combination of three metatarsal fractures was seen in the second,
third, and fourth metatarsals, which made up 40% of the multiple
fracture group. Ten percent of patients with multiple metatarsal
fractures presented with fractures of the second, third, fourth, and
fifth metatarsals. As with metacarpal and finger phalangeal fractures,
it is interesting to observe that patients who present with multiple
metatarsal fractures tend to be older. In fractures of the fifth
metatarsal, 78.4% resulted from a simple fall, 8.6% from a sports
injury, and 2.1% from a fall from a height.
|
TABLE 3-26 The Basic Characteristics of Calcaneal Fractures
|
||||||||||||||||||||||||||||||
|---|---|---|---|---|---|---|---|---|---|---|---|---|---|---|---|---|---|---|---|---|---|---|---|---|---|---|---|---|---|---|
|
||||||||||||||||||||||||||||||
|
TABLE 3-27 The Basic Epidemiological Characteristics of Midfoot Fractures
|
|||||||||||||||||||||||||||||||||||
|---|---|---|---|---|---|---|---|---|---|---|---|---|---|---|---|---|---|---|---|---|---|---|---|---|---|---|---|---|---|---|---|---|---|---|---|
|
|||||||||||||||||||||||||||||||||||
|
TABLE 3-28 The Basic Epidemiological Characteristics of Metatarsal Fractures
|
||||||||||||||||||||||||||||||||||||||||||||||||||
|---|---|---|---|---|---|---|---|---|---|---|---|---|---|---|---|---|---|---|---|---|---|---|---|---|---|---|---|---|---|---|---|---|---|---|---|---|---|---|---|---|---|---|---|---|---|---|---|---|---|---|
|
||||||||||||||||||||||||||||||||||||||||||||||||||
all fractures. They have a Type C distribution affecting young males
and females, and unsurprisingly, 53.7% were caused by direct blows.
There has been considerable interest in their management over the last
20-25 years, and the implication is that they occur as the result of
high-energy trauma. Some clearly do but the vast majority of pelvic
fractures are simple pubic rami fractures occurring in the frail
elderly. There is a marked female preponderance and overall they have a
Type E distribution. In Table 3-29, pelvic
fractures have been divided into pelvic and acetabular fractures to
permit a more detailed analysis. If acetabular fractures are considered
separately, it is apparent that they have a Type G distribution with
younger and older males and older females presenting with these
injuries. Pelvic fractures have a Type E distribution. A review of the
common causes indicates that the majority of patients are injured in a
simple fall and the average age of this group is 82.6 years. This is
the highest average age for a particular fracture caused by an
individual mode of injury in the study and suggests that the patients
who present with pubic rami fractures following a simple fall are very
frail indeed. Patients who sustain a pelvic fracture as a result of a
fall from a height have an average age of 38.6 years, and those who
sustain a pelvic fracture as a result of a motor vehicle accident have
an average age of 47.2 years.
of the difficulty in retrieving them and the impossibility of producing
accurate figures. In 2000,8 we documented the prevalence of spinal fractures to be 0.7% and the incidence to be 7.5/105/year
but of course the correct figures must be much higher. Most
thoracolumbar fractures are fragility fractures occurring in older
patients and the majority are not admitted to hospital. We assessed
thoracolumbar fractures that were admitted to hospital as having a Type
B distribution, but we felt that the correct distribution was Type A
when the osteoporotic fractures were
included.
One could even argue that there are so many osteoporotic thoracolumbar
fractures in elderly women that the correct distribution curve is in
fact Type E. We documented that cervical fractures had a Type H
distribution. See Table 3-40 for the epidemiological characteristics of traumatic spine fractures admitted to Baltimore in 2007.
|
TABLE 3-29 The Basic Epidemiological Characteristics of Pelvic Fractures
|
|||||||||||||||||||||||||||||
|---|---|---|---|---|---|---|---|---|---|---|---|---|---|---|---|---|---|---|---|---|---|---|---|---|---|---|---|---|---|
|
|||||||||||||||||||||||||||||
analyzed the prevalence of vertebral fractures in elderly French women.
They found that 22.8% of women with an average age of 80.1 years had a
vertebral fracture. The prevalence and the number of fractures
increased with age such that 41.4% of women aged at least 85 years had
vertebral fractures.
adolescent fractures. This is because epidemiological studies tend to
concentrate on adult or pediatric fractures with a dividing age of 14,
16, or 18 years. Unfortunately, adolescent fractures are lost in the
division. They are an important group because fractures in adolescent
males in particular are common and the curves shown in Figure 3-2 do not emphasize this. To study adolescent fracture epidemiology, the epidemiological data from the year 2000,8 which was presented in the sixth edition of Rockwood and Green, was combined with the pediatric data from the same year.35 Adolescent fractures were defined as being between 10-19 years.
gender distribution curves for the adolescent population. It can be see
that there is a significant rise in the incidence of adolescent male
fractures from 10-13 years. In fact, male adolescents had a fracture
incidence of 38.3/103/year, which was second only to the incidence of fractures in females over 80 years of age which, in 2000, was 45.5/103/year.
There was a progressive decrease in fracture incidence in boys after 13
years and in girls after 11 years, and at 19 years of age, the fracture
incidence in males was 3.6 times that in females. The overall incidence
in adolescents was 24.3/103/year and the gender ratio was 72/28 (male/female).
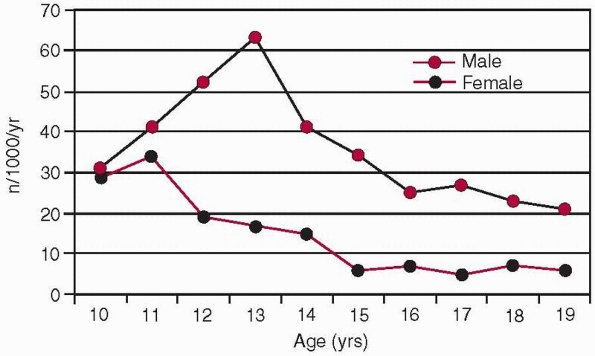 |
|
FIGURE 3-3 The age and gender specific fracture distribution curves for adolescents. Data from Menon et al.32
|
of the different fractures seen in children, adolescents, and adults in
2000. What is striking is the very high incidence of fractures of the
distal radius, finger phalanges, metacarpus, clavicle, metatarsus, and
ankle in adolescents. Some fractures have a lower incidence in
adolescents and these tend to be the fragility fractures, although
calcaneal fractures are rare in the adolescent period. In other
fractures, such as distal humerus fractures, the adolescent group is
clearly midway between the high incidence in childhood and the lower
incidence in adulthood. Menon et al.32
divided the adolescents into male and female junior and senior
adolescents of 10-14 years and 15-19 years. They examined the influence
of social deprivation in these groups and showed a correlation between
social deprivation and fracture incidence in senior male and female
adolescents and junior male adolescents. They also found that social
deprivation was an independent predictor of fractures of the hand in
senior adolescent males, fractures of the upper limb in junior
adolescent males, and in fractures of the upper limb and distal radius
in senior adolescent females.
previously been analyzed are those patients aged 90 years or more, the
90+ group. Nonogenarians and centenarians are becoming an increasingly
important part of society, and the National Office of Statistics in the
United Kingdom has shown that they are the age group that is increasing
most quickly.34 In the last United States census,41
it was estimated that 90+ patients comprised 0.65% of the population,
the equivalent figure in the United Kingdom being 0.58%. In 2025, it is
estimated that the 90+ group will represent 1.2% of the population of
the United Kingdom. Thus, the orthopaedic surgeons of the future will
have to treat more fractures in this difficult group of patients.
being matched by better health in most countries. In 2008, the National
Office of Statistics in the United Kingdom33
stated that while the population had been living longer in the previous
23 years, the time that both sexes could be in poorer health or have a
limiting illness or disability had risen between 1981 and 2004. There
was a slight improvement after 2004, which may tally with the decline
in osteoporotic fractures in Finland26,27
that has already been discussed, but it seems likely that increasing
longevity is going to be paired with increasing morbidity and
hospitalization for a range of different conditions including
orthopaedic trauma. The data from the Edinburgh Orthopaedic Trauma Unit
in 2000 suggests that this is already occurring in orthopaedic trauma.
Court-Brown and Clement9
showed that in 2000, 0.58% of the population aged 90 years or more
accounted for 3.02% of the fractures, 8.7% of the inpatient admissions,
and 7.6% of the orthopaedic trauma surgery.
|
TABLE 3-30 Fracture-Specific Incidences in Adolescents, Children, and Adults
|
||||||||||||||||||||||||||||||||||||||||||||||||||||||||||||||||||||||||||||||||||||||||||||||||||||||||||||||||||||
|---|---|---|---|---|---|---|---|---|---|---|---|---|---|---|---|---|---|---|---|---|---|---|---|---|---|---|---|---|---|---|---|---|---|---|---|---|---|---|---|---|---|---|---|---|---|---|---|---|---|---|---|---|---|---|---|---|---|---|---|---|---|---|---|---|---|---|---|---|---|---|---|---|---|---|---|---|---|---|---|---|---|---|---|---|---|---|---|---|---|---|---|---|---|---|---|---|---|---|---|---|---|---|---|---|---|---|---|---|---|---|---|---|---|---|---|---|
|
||||||||||||||||||||||||||||||||||||||||||||||||||||||||||||||||||||||||||||||||||||||||||||||||||||||||||||||||||||
epidemiology of fractures in the 90+ group in 2007-2008. Altogether,
they accounted for 4.4% of all fractures, which represents an increase
compared with 2000. The prevalence of male fractures was 1.8% compared
with 6.8% in females. The over all incidence was 7707.7/105/year with the male incidence being 6568.5/105/year and the female incidence 8032.3/105/year.
The high incidence relates to the relatively low numbers of 90+
patients in the population, with 22.2% of the group being male and
77.8% being female. As expected, proximal femoral fractures are by far
the most common fractures seen by orthopaedic surgeons, but 12.1% of
fractures were other lower limb fractures, 30.9% were upper limb
fractures, and 7.2% were pelvic fractures. Fractures of the proximal
femur, distal radius and ulna, proximal humerus, pelvis, and femoral
diaphysis account for 83.1% of all the fractures. The ankle fractures
were all transsyndesmotic fractures and the proximal forearm fractures
were either olecranon fractures or fractures of the proximal radius and
ulna, both of which have a Type F distribution. Fractures of the foot
and hand are extremely rare in this group, there being only 1 (0.1%)
foot fracture and 6 (0.4%) hand fractures. As might be predicted, 95.4%
of the 90+ group sustained their fractures as a result of a fall from a
standing height. A further 2.3% had a fall down stairs and only 2
(0.7%) patients were involved in a motor vehicle accident. Both were
pedestrians. Only 5 (1.6%) of the fractures were open.
|
TABLE 3-31 The Prevalence, Incidence, and Gender Ratios of Fractures in the 90 + Group in 2007-2008
|
|||||||||||||||||||||||||||||||||||||||||||||||||||||||||||||||||||||||||||||||||||||||||||||||||||||||||
|---|---|---|---|---|---|---|---|---|---|---|---|---|---|---|---|---|---|---|---|---|---|---|---|---|---|---|---|---|---|---|---|---|---|---|---|---|---|---|---|---|---|---|---|---|---|---|---|---|---|---|---|---|---|---|---|---|---|---|---|---|---|---|---|---|---|---|---|---|---|---|---|---|---|---|---|---|---|---|---|---|---|---|---|---|---|---|---|---|---|---|---|---|---|---|---|---|---|---|---|---|---|---|---|---|---|
|
Shock Trauma Center in Baltimore in 2007 showed that there were 2325
patients who presented with 4744 fractures. The gender ratio was 71/29
(male/female), and 70% of the patients were admitted directly from the
accident with a further 30% being transferred from another hospital.
The average age of the patients was 41.7 years, with the average age of
males and females being 39.3 years and 47.6 years, respectively. The
average Injury Severity Score (ISS) was 17, with a range of 1-75 and a
mode of 9. There was a diverse racial mix of patients with 65.9% being
Caucasian. A further 25.8% were Black, 4.2% were Hispanic, and 1.2%
were Asian. The remaining 2.1% of patients were from other races. The
relative severity of injury in patients admitted to Baltimore is
highlighted by the fact that 16.5% of the fractures were open and the
hospital mortality was 4.2%.
illustrating the differences between Baltimore and Edinburgh. In
Baltimore, 32.5% of all the fractures involved the spine and pelvis,
whereas in Edinburgh 28.1% of fractures involved the distal radius and
ulna and the proximal femur. This difference encapsulates the different
populations treated by Baltimore and Edinburgh. Another significant
difference is the high prevalence of diaphyseal fractures in Baltimore.
Fractures of the forearm, femoral, and tibial diaphyses constitute
18.3% of the Baltimore fractures compared with 3.2% of the Edinburgh
fractures. However, the prevalence of humeral diaphyseal fractures was
similar, although many more humeral diaphyseal fractures were open in
Baltimore. Predictably, the prevalence of lower energy metaphyseal
fractures, such as those of the proximal femur, proximal humerus,
proximal forearm, and distal radius, was much less in Baltimore as were
fractures of the hand and forefoot.
shows a significant difference in the numbers of open fractures in
Baltimore compared with Edinburgh. In Baltimore, 16.5% of fractures
were open compared with 2.6% in Edinburgh. In Baltimore, 60% of the
open fractures were in the lower limb or pelvis with the largest
number, as in Edinburgh, being in the tibial diaphysis. However, the
highest prevalence of all open fractures was in the distal humerus
where 55% were open and 20% were caused by gunshot wounds. In the
pelvis, the overall figure of 5.2% open fractures was made up of 23
(8.7%) open pelvic fractures and 5 (1.9%) open acetabular fractures,
but it is interesting to note that all 5 open acetabular fractures were
caused by gunshot wounds (see Table 3-39).
only 23.5% of patients presented with an isolated injury with a further
22.4% presenting with two fractures, 16.1% with three fractures, and
12.9% with four fractures. The remaining 25.1% presented with between 5
and 15 fractures, with 3.1% of patients presenting with at least 10
fractures.
|
TABLE 3-32 The Numbers and Prevalence of Fractures Admitted to Baltimore in 2007*
|
|||||||||||||||||||||||||||||||||||||||||||||||||||||||||||||||||||||||||||||||||||||||||||||||||||||||||||||||||||||||||||||||||||||||||||||||||
|---|---|---|---|---|---|---|---|---|---|---|---|---|---|---|---|---|---|---|---|---|---|---|---|---|---|---|---|---|---|---|---|---|---|---|---|---|---|---|---|---|---|---|---|---|---|---|---|---|---|---|---|---|---|---|---|---|---|---|---|---|---|---|---|---|---|---|---|---|---|---|---|---|---|---|---|---|---|---|---|---|---|---|---|---|---|---|---|---|---|---|---|---|---|---|---|---|---|---|---|---|---|---|---|---|---|---|---|---|---|---|---|---|---|---|---|---|---|---|---|---|---|---|---|---|---|---|---|---|---|---|---|---|---|---|---|---|---|---|---|---|---|---|---|---|---|
|
|||||||||||||||||||||||||||||||||||||||||||||||||||||||||||||||||||||||||||||||||||||||||||||||||||||||||||||||||||||||||||||||||||||||||||||||||
from the Baltimore data because there is no knowledge as to the size of
the captive population. However, Figure 3-4
shows age and gender specific frequency curves of the fractures
presenting to Baltimore in 2007. It can be seen that there is a slight
increase in fractures in older females, and, if one takes into account
the fact that there is a markedly reduced number of older females in
the population, it is likely that in fact the overall distribution of
the fractures in Baltimore is a Type A distribution with a unimodal
distribution in younger men and in older females. This is also
suggested by a review of the frequency curves of other Level I Trauma
Centers.40 It should be noted that
in a number of the fractures in Baltimore, there is a dip in frequency
between the ages of 30 and 45, particularly in males. This is shown in Figure 3-4.
This shows that about 60% of the fractures treated in Baltimore
occurred as the result of motor vehicle accidents with a further 12.3%
occurring as the result of a fall from a height and 7.5% following a
fall from a standing height. Sports injuries are relatively rare as
they are usually low-energy injuries and are treated elsewhere. In
Baltimore, 51.8% of the sports injuries were caused by horse riding
accidents and were associated with more severe fractures.
the result of motor vehicle accidents. The other major difference is
that 6.5% of fractures are caused by gunshot wounds. In fact, the only
similarity between the two hospitals is in the prevalence of fractures
caused by falls down stairs, although there was a similar number of
fractures for which there was no information about the mode of injury.
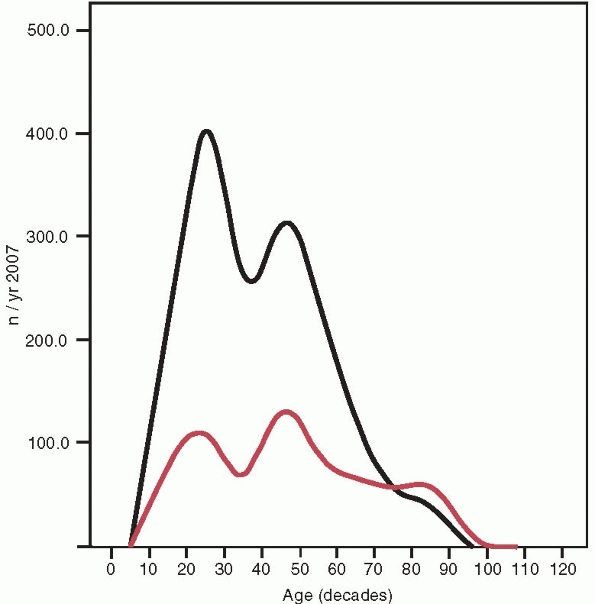 |
|
FIGURE 3-4
The age and gender frequency curves from Baltimore. These are not incidence curves and given the increase in frequency in older females and the relatively small number of older females in the population, it is likely that this is a Type A curve (see Figure 3-2) although the younger male peak is greater than the older female peak. |
vehicle accidents are responsible for the majority of fractures
admitted to Baltimore. Again, there are considerable differences from
the Edinburgh data. Table 3-34 shows that in
Baltimore, vehicle occupants were most commonly admitted after motor
vehicle accidents with 64% of the patients being either vehicle drivers
or passengers. A further 19.7% of patients were motorcyclists, with
13.3% being pedestrians and only 3.1% being cyclists. Table 3-34
shows the average ISS for each type of patient. This indicates that the
pedestrians were the most seriously injured followed by vehicle
occupants and motor cyclists. These figures are considerably different
from the Edinburgh figures shown in Table 3-12,
and they suggest that there may be considerable differences in the type
of transport used in Edinburgh and Baltimore. It is interesting to note
that the prevalence of fractures in pedestrians is not dissimilar
between the two hospitals, but a comparison of the numbers of fractures
in other patients suggests that there are relatively more cyclists and
motorcyclists in Edinburgh than in Baltimore. The Edinburgh figures for
the prevalence of open fracture in pedestrians also indicate the
severity of injury in this group of patients.
|
TABLE 3-33 The Numbers and Prevalences of Fractures for the Eight Basic Modes of Injury in Baltimore
|
|||||||||||||||||||||||||||
|---|---|---|---|---|---|---|---|---|---|---|---|---|---|---|---|---|---|---|---|---|---|---|---|---|---|---|---|
|
of protective equipment for vehicle occupants and motorcyclists
involved in motor vehicle accidents. Unrestrained drivers with no air
bags fitted in their cars had an average ISS of 22.3. This dropped to
17.4 if a seatbelt was used and, interestingly, it dropped to 15.4 if a
seatbelt was not used but the air bag deployed in the accident. If both
a seatbelt was used and an air bag deployed in the accident the average
ISS was lower at 14.5. These figures emphasize the importance of both
seatbelts and air bags in preventing injuries. The relative figures
were the same for vehicle occupants. Almost 20% of motorcyclists were
not wearing protective headgear when they were involved in the motor
vehicle accident. These motorcyclists had a higher ISS than those
wearing headgear.
shows that the most common fracture seen in vehicle occupants,
pedestrians, and motorcyclists was a tibial diaphyseal fracture, while Table 3-32 shows the prevalence of open fractures indicating
that the fractures admitted to Baltimore were usually very severe. The contrast with the Edinburgh data shown in Tables 3-7 and 3-12
is remarkable, but it is difficult to know whether the contrast is
because of a different spectrum of injury in Baltimore or because the
less severely injured patients go to other hospitals. However, it is
likely that both vehicle occupants and motorcyclists make more use of
protective equipment in Edinburgh than in Baltimore, and this may well
account for some of the differences in the spectrum of injuries between
the two hospitals.
|
TABLE 3-34 The Epidemiology of Patients Involved in Motor Vehicle Accidents in Baltimore in 2007*
|
||||||||||||||||||||||||||||||||||||||||||
|---|---|---|---|---|---|---|---|---|---|---|---|---|---|---|---|---|---|---|---|---|---|---|---|---|---|---|---|---|---|---|---|---|---|---|---|---|---|---|---|---|---|---|
|
||||||||||||||||||||||||||||||||||||||||||
Baltimore in 2007 shows that they accounted for 6.5% of all fractures.
Gunshot fractures had a Type B distribution; the patients having an
average age of 28 years and 93% of them being male. There were racial
differences with 83% of the patients being Black and 15% being
Caucasian. The average ISS was 16 and the mortality was 5%. There were
fewer injuries to other body systems than seen with blunt trauma (Tables 3-34, 3-36, 3-37, and 3-38).
Overall, 7% of patients had an injury to the central nervous system,
30% had thoracic injuries, 33% had abdominal injuries, and 22% had
associated spinal injuries. Table 3-39 shows the fractures were caused by gunshot injuries. The most common fractures were in the tibia and fibula, pelvis, and hand.
|
TABLE 3-35 The Use of Protective Equipment in Baltimore in 2007
|
||||||||||||||||||||||||||||||||||||||||||||||||
|---|---|---|---|---|---|---|---|---|---|---|---|---|---|---|---|---|---|---|---|---|---|---|---|---|---|---|---|---|---|---|---|---|---|---|---|---|---|---|---|---|---|---|---|---|---|---|---|---|
|
||||||||||||||||||||||||||||||||||||||||||||||||
also noted a Type B distribution. They also recorded that, in 1994, 56%
of the males were unemployed, 79% were uninsured, 68% were documented
substance abusers, and 65% of the injuries were probably related to
illicit drug activity. The situation is probably not dissimilar now.
admitted to Baltimore during 2007. The epidemiological characteristics
of the commonest four upper limb fractures are shown in Table 3-36.
clavicle which interestingly had a similar prevalence and average age
to those seen in Edinburgh (see Tables 3-4 and 3-5). The gender ratio is also similar, but there was a slightly higher prevalence
of open fractures. Given the high-energy nature of the fractures
admitted to Baltimore and the subcutaneous location of the clavicle, a
rate of 3% open clavicle fractures is surprisingly low. The mean ISS
for patients who had clavicle fractures was 21, and Table 3-36
shows that motor vehicle accidents account for the majority of clavicle
fractures. It also shows that there was a high rate of associated chest
and lower limb injuries and that 20% of the patients who presented with
clavicle fractures actually had a floating shoulder because of an
associated scapular fracture. The other commonly associated fractures
were pelvic and spinal. It is difficult to assess the overall
distribution curve because of the impossibility of calculating
incidence in the Baltimore population. However, there was a unimodal
distribution affecting younger and middle-aged males and a bimodal
distribution affecting younger and older females suggesting that the
clavicle fracture in Baltimore had a Type D distribution. It is worth
noting, however, that there was a dip in the frequency of clavicle
fractures between the ages of 20 and 50 in males.
|
TABLE 3-36 The Epidemiology of the Four Most Common Upper Limb Fractures That Presented to Baltimore in 2007
|
||||||||||||||||||||||||||||||||||||||||||||||||||||||||||||||||||||||||||||||||||||||||||
|---|---|---|---|---|---|---|---|---|---|---|---|---|---|---|---|---|---|---|---|---|---|---|---|---|---|---|---|---|---|---|---|---|---|---|---|---|---|---|---|---|---|---|---|---|---|---|---|---|---|---|---|---|---|---|---|---|---|---|---|---|---|---|---|---|---|---|---|---|---|---|---|---|---|---|---|---|---|---|---|---|---|---|---|---|---|---|---|---|---|---|
|
||||||||||||||||||||||||||||||||||||||||||||||||||||||||||||||||||||||||||||||||||||||||||
|
TABLE 3-37 The Epidemiology of the Four Most Common Lower Limb Fractures That Presented to Baltimore in 2007
|
||||||||||||||||||||||||||||||||||||||||||||||||||||||||||||||||||||||||||||||||||||||||||
|---|---|---|---|---|---|---|---|---|---|---|---|---|---|---|---|---|---|---|---|---|---|---|---|---|---|---|---|---|---|---|---|---|---|---|---|---|---|---|---|---|---|---|---|---|---|---|---|---|---|---|---|---|---|---|---|---|---|---|---|---|---|---|---|---|---|---|---|---|---|---|---|---|---|---|---|---|---|---|---|---|---|---|---|---|---|---|---|---|---|---|
|
||||||||||||||||||||||||||||||||||||||||||||||||||||||||||||||||||||||||||||||||||||||||||
|
TABLE 3-38 The Epidemiology of Pelvic and Acetabular Fractures in Baltimore in 2007
|
||||||||||||||||||||||||||||||||||||||||||||||||||||||
|---|---|---|---|---|---|---|---|---|---|---|---|---|---|---|---|---|---|---|---|---|---|---|---|---|---|---|---|---|---|---|---|---|---|---|---|---|---|---|---|---|---|---|---|---|---|---|---|---|---|---|---|---|---|---|
|
||||||||||||||||||||||||||||||||||||||||||||||||||||||
in the prevalence and spectrum of scapular fractures in Baltimore and
Edinburgh. In Edinburgh, it is apparent that the scapula is becoming
much more common in older patients, but in Baltimore it remains a
high-energy injury predominantly seen in younger males. The average age
of patients who presented with scapular fractures was 42 years and the
gender ratio was 83/17 (male/female). The severity of injury associated
with scapular fractures is highlighted in Table 3-36 by the comparatively high average ISS of 24 and the very high prevalence of open fractures. Table 3-36
also shows that the majority of scapular fractures occur as a result of
motor vehicle accidents, although it is apparent that a number were
caused by falls from a height. There was also a high rate of associated
injuries to the central nervous system, chest, and lower limb in
particular. The high male prevalence and the relatively low average age
suggests that the distribution curve for scapular fractures in
Baltimore is Type B.
epidemiology to that seen in Edinburgh. They occur in 3.9% of patients
in Baltimore, and the average age is 44 years. There was a high
prevalence of open fractures, but Table 3-36
shows that the average ISS of the patients who presented with distal
radial fractures was lower than in other upper limb fractures. The
majority of patients were injured in a fall, but the high-energy nature
of these fractures, when compared to Edinburgh, is highlighted by the
numbers of patients who were injured in motor vehicle accidents. Table 3-36
shows that the patients had fewer associated injuries than patients
with clavicle or scapular fractures. The distribution curve is
essentially a Type D curve with a bimodal distribution in younger men
and women, accentuating the high-energy nature of this fracture in
Baltimore.
in Edinburgh but otherwise the epidemiology was very different. The
average age was only 38 years, and there was a marked preponderance of
males, unlike in Edinburgh where humeral diaphyseal fractures showed
all the characteristics of a fragility fracture. In Baltimore, 20% of
the humeral diaphyseal fractures were open and a considerable number
were caused by motor vehicle accidents. The relative severity of these
injuries was highlighted by the number that had associated proximal
humeral or spinal fractures. In Baltimore, the distribution curve for
humeral diaphyseal fractures was Type B.
|
TABLE 3-39 The Epidemiology of Fractures Caused by Gunshot Wounds in Baltimore in 2007
|
|||||||||||||||||||||||||||||||||||||||||||||||||||||||||||||||||||||||||||
|---|---|---|---|---|---|---|---|---|---|---|---|---|---|---|---|---|---|---|---|---|---|---|---|---|---|---|---|---|---|---|---|---|---|---|---|---|---|---|---|---|---|---|---|---|---|---|---|---|---|---|---|---|---|---|---|---|---|---|---|---|---|---|---|---|---|---|---|---|---|---|---|---|---|---|---|
|
fractures treated in Baltimore in 2007. The epidemiological features of
the four most common lower limb fractures are shown in Table 3-37.
long bone fracture to be treated in Baltimore and accounted for 6.6% of
all fractures. The average age and gender ratio were virtually
identical to Edinburgh but otherwise the epidemiological
characteristics were very different. In both hospitals, tibial
diaphyseal fractures were associated with the highest rate of open
injuries. In Baltimore, 49.5% of tibial diaphyseal fractures were open
compared with 21.9% in Edinburgh (see Table 3-7). The average ISS of the patients who presented with a tibial diaphyseal fracture was 18, and Table 3-37
shows that the patients often had other associated lower limb or pelvic
fractures and that 42% of the patients presented with an associated
upper limb fracture. Table 3-37 also shows
that the majority of fractures were caused by motor vehicle accidents.
As one might expect, the overall distribution for tibial fractures in
Baltimore was a Type C curve.
diaphyseal fracture in Baltimore are very different from Edinburgh. As
one would expect in a Level I Trauma Center, the patients tend to be
young and predominantly male. However, there are a number of younger
females who present with femoral diaphyseal fractures in Baltimore.
Overall, femoral fractures in Baltimore show a Type C distribution. As
with tibial diaphyseal fractures, Table 3-37
shows that there is a high prevalence of open fractures (23.6%), and
the average ISS was higher than seen with tibial diaphyseal fractures.
Many patients were injured in motor vehicle accidents, and there was a
high rate of pelvic fractures and other lower limb injuries.
Baltimore than in Edinburgh with 2% of the fractures involving the
calcaneus. The average age was lower than in Edinburgh (see Table 3-5),
but the gender ratio was very similar. As in Edinburgh, the majority of
patients were injured in a fall from a height, although there was a
greater association with motor vehicle accidents in Baltimore. Overall,
the patients were less significantly injured when compared with
patients who presented with other lower limb injuries. However, not
unexpectedly, there was a high rate of associated lower limb fractures,
and 41% of patients presented with associated upper limb fractures (see
Table 3-37). Relatively, more females presented
with calcaneal fractures in Baltimore. Overall, the distribution showed
a Type C curve, but there was a dip in frequency in both males and
females between the ages of 30 and 45 years.
Baltimore was very different to that seen in Edinburgh, although it was
the only fracture dealt with in Baltimore that had a true Type A
distribution with a late peak in elderly females suggesting that these
very difficult fractures may be transferred to the major Trauma Center
from other hospitals in the area. The late female increase in frequency
of distal femoral fractures accounts for the higher average age of 47
years, and Table 3-37 shows that 45% of the
fractures occurred in females. A large number were caused by simple
falls, but in younger patients, the fractures were often associated
with motor vehicle accidents. Any associated injury was usually either
spinal or another lower limb fracture. However, 53% of the patients
presented with other upper limb fractures.
shows that there was an equal distribution between pelvic and
acetabular fractures and, in fact, the epidemiological characteristics
for both fractures were very similar with similar average ages, gender
ratios, and average ISS. The only significant difference in the basic
epidemiological criteria was that open pelvic fractures were much more
common than open acetabular fractures. However, further analysis of
Table
3-38
shows that there are other differences with more acetabular fractures
occurring in vehicle drivers. The overall distribution curves for both
pelvic and acetabular fractures in Baltimore are similar with both
showing a Type C distribution although, as with other fracture in
Baltimore, the pelvic distribution curve shows a drop in incidence
between 30 and 45 years. This is not apparent in the acetabular group.
shows the epidemiological characteristics of the fractures with
particular reference to their location in the spine. It shows that the
highest prevalence of fractures was in the cervical spine and that
20.1% of cervical spine fractures were associated with a dislocation.
The epidemiological characteristics of thoracic and lumbar fractures
are very similar, although there is a higher rate of dislocation in the
thoracic spine. The mode of injury was very similar for all spinal
fractures, but unsurprisingly there were different associated injuries
depending on the location of the fracture.
analyzed 562 patients with a traumatic spine fracture. They found that
39% were associated with a high-energy fall, and 25.6% were caused by a
motor vehicle accident. They showed that while fall-related spinal
fractures were evenly distributed throughout the spine, motor
vehicle-related fractures were more commonly seen in the cervical and
thoracic spines. Overall, they found that L1 was most commonly affected
(28.5%), followed by T12 (14.1%), and L2 (12.1%). The lowest prevalence
of fractures were in T1 (0.4%) and T2 (0.2%). They also found that
54.8% of patients sustained a compression fracture, while 16.9%
sustained a distraction fracture and 18.5% a rotation fracture.
|
TABLE 3-40 The Epidemiology of the Spinal Fractures That Presented to Baltimore in 2007
|
||||||||||||||||||||||||||||||||||||||||||||||||||||||||||||||||
|---|---|---|---|---|---|---|---|---|---|---|---|---|---|---|---|---|---|---|---|---|---|---|---|---|---|---|---|---|---|---|---|---|---|---|---|---|---|---|---|---|---|---|---|---|---|---|---|---|---|---|---|---|---|---|---|---|---|---|---|---|---|---|---|---|
|
||||||||||||||||||||||||||||||||||||||||||||||||||||||||||||||||
population will continue to change fairly quickly, mainly as a result
of aging in the population although improved road safety measures,
industrial legislation, and osteoporosis treatment will also play a
part. In developed countries, there is evidence that the increasing
incidence of a number of fractures that has been apparent in the last
50 years or so is now tailing off, but it is likely that other
fractures will continue to increase in incidence. Some of the fractures
listed in Table 3-5 are likely to be
associated with a higher average age in the future and quite a few
fractures will convert from a Type A, D, G, or H distribution to a Type
E or F distribution and will become fragility fractures. Indeed, a
comparison of the Edinburgh 2000 data base detailed in the sixth
edition of Rockwood and Green8 with
the 2007-2008 database used in this chapter shows increasing patient
age and a tendency for the frequency of high-energy fractures to
decrease. There is also evidence of an increasing incidence of a number
of the fragility fractures listed in Table 3-6.
the epidemiology of fractures is changing. The prime example of change
is the femoral diaphyseal fracture which is commonly assumed to affect
young patients involved in motor vehicle accidents. This is clearly
still the case in fractures admitted to Level I Trauma Centers such as
Baltimore, but if the whole population is considered, it is obvious
that the epidemiology of this fracture has changed markedly in the last
30-40 years so that the average age of patients with femoral diaphyseal
fractures is now about 70 and almost 40% are presenting with
periprosthetic femoral diaphyseal fractures, which usually occur after
low-energy trauma.
treating more elderly patients in the future. There is already a Type A
distribution in the fractures that are treated and, while there will
always be a significant number of young people who will require
treatment mainly because of injuries in motor vehicle
accidents,
it does seem likely that specialist Trauma Units will be called on to
treat the increasingly difficult fractures caused by osteopenia and
osteoporosis in elderly patients. We believe that the Type A
distribution of distal femoral fractures in Baltimore suggests that
this is already happening.
E, Petranek M, Atroshi I. Incidence and characteristics of distal
radius fractures in a southern Swedish region. BMC Musculoskelet Disord
2007;8:48.
JA, Wampler NS, Barnhart JN, et al. Incidence of fractures compared to
cardiovascular disease and breast cancer: the Women’s Health Initiative
observational study. Osteoporos Int 2008:19(12);1717-1723.
KP, Center JR, Nguyen TV, et al. Incidence of hip and other
osteoporotic fractures in elderly men and women: Dubbo osteoporosis
epidemiology study. J Bone Min Res 2004;19(4):532-536.
T, Guilley E, Herrmann FR, et al. Incidence of hip fracture over a
10-year period (1991-2000): reversal of a secular trend. Bone
2007;40(5):1284-1289.
C, Atkinson EJ, O’Fallon WM et al. Incidence of clinically diagnosed
vertebral fractures: a population-based study in Rochester, Minnesota,
1985-1989. J Bone Miner Res 1992;7(2): 221-227.
CM, Caesar B. The epidemiology of fractures. In Heckman JD, Bucholz RW,
Court-Brown C, eds. Rockwood and Green’s Fractures in Adults. 6th ed.
Philadelphia: Lippincott Williams & Wilkins; 2006:95-113.
CM, Clement N. Four score years and ten. An analysis of the
epidemiology of fractures in the very elderly. Inj J Care Injured 2009;
Jul 9 (Epub).
LJ, Cook A, Thomson RG. Incidence of fractures in a geographically
defined population. J Epidemiol Community Health 1990;44(3):241-245.
LJ, Reckless IP, Scholes S, et al. The epidemiology of fractures in
England. J Epidemiol Community Health 2008;62(2):174-180.
Register Office for Scotland. 2001 Census. Available at:
http://www.groscotland.gov.uk/census/censushm/index/html. Accessed June
4, 2009.
F, Marcelli C, Dargent-Molina P, et al. Prevalence of vertebral
fractures in French women older than 75 years from the EPIDOS study.
Bone 2004;34(2):362-367.
E, Chevalley F, Herrmann D, et al. Reversal of the hip fracture secular
trend is related to a decrease in the incidence in institution-dwelling
elderly women. Osteoporos Int 2008:19(12);1741-1748.
RB, Mendoza RM, Williams DM. Problems in the management of type III
(severe) open fractures. A new classification of type III open
fractures. J Trauma 1984;24(8);742-746.
H, Yamamoto K, Ohshiro H, et al. Changing incidence of hip, distal
radius, and proximal humerus fractures in Tottori Prefecture, Japan.
Bone 1999;24(3):265-270.
R, Nussman D, Gorman RA, et al. Gunshot fractures: a medical, social,
and economic analysis. Orthopaedics 1994;17(6):519-523.
SJ, Goldberg J, Miles TP, et al. Seasonal variation in the incidence of
hip fracture among white persons aged 65 years or older in the United
States, 1984-1987. Am J Epidemiol 1991;133(10):996-1004.
A, Evans RJ, Stone MD, et al. Fracture incidence in England and Wales:
a study based on the population of Cardiff. Injury
1997;28(9-10):655-660.
J, Oden A, Johnell O, et al The burden of osteoporotic fractures: a
method for setting intervention thresholds. Osteoporos Int
2001;12(5):417-427.
P, Niemi S, Palvanen M, et al. Stabilizing influence of low-trauma
ankle fractures in elderly people Finnish statistics for 1970 to 2006
and prediction for the future. Bone 2008;43(2):340-342.
CM, Frihagen F, Meyer HE, et al. Epidemiology of distal forearm
fractures in Oslo, Norway. Osteoporos Int 2008;19(6):781-786.
LJ 3rd, Crowson CS, O’Fallon WM. Fracture incidence in Olmstesd County,
Minnesota: comparison of urban with rural rates and changes in urban
rates over time. Osteoporos Int 1999;9(1):29-37.
MRG, Walker JL, Court-Brown CM. The epidemiology of fractures in
adolescents with reference to social deprivation. J Bone Joinr Surg Br
2008:90B:1482-1486.
Statistics. Centenarians: the fastest increasing age group. Available
at: http://www.statistics.gov.uk/cci/nugget_print.asp?ID=1875. Accessed
June 4, 2009.
Statistics. Health expectancy: live longer, more years in poor health.
Available at: http://www.statistics.gov.uk/cci/nugget_print.asp?ID=934.
Accessed June 4, 2009.
M, Endo N, Oinuma T, et al. Incidence and outcome of osteoporotic
fractures in 2004 in Sado City, Niigata Prefecture, Japan. J Bone Miner
Metab 2008;26(4):373-378.
KM, Nicholson GC, Ugoni AM, et al. Fracture rates lower in rural than
urban communities: the Geelong osteoporosis study. J Epidemiol
Community Health 2002:56(6);466-470.
JK, Meyer WA, Flores RH, et al. Racial differences in rate of decline
in bone mass in older men: the Baltimore men’s osteoporosis study. J
Bone Min Res 2005;20(7):1228-1234.
DM, Edwards ER, Graves SE, et al. Characterisation of orthopaedic
trauma admitted to adult Level 1 Trauma Centres. Int J Care Injured
2006:37(2);120-127.
RJ, Montgomery SM, Ehlin A, et al. Decreasing incidence of tibial shaft
fractures between 1998 and 2004: information based on 10,627 Swedish
patients. Acta Orthop 2008;79(4):526-533.