
Editors: Berquist, Thomas H.
Title: Musculoskeletal Imaging Companion, 2nd Edition
Copyright ©2007 Lippincott Williams & Wilkins
> Table of Contents > Chapter 3 – Spine
Chapter 3
Spine
Thomas H. Berquist
Douglas S. Fenton
Protocols
Key Facts
P.32
|
|
| Trauma/routine | Anteroposterior (AP), lateral, AP odontoid, both obliques (must see C7–T1) |
| Special | Swimmer’s view for cervicothoracic junction Flexion/extension for instability |
| Thoracic spine | AP and lateral views |
|
|
| Routine | |
| AP, lateral, coned-down lateral | |
| Additional views | Both obliques (pars defects) |
| Flexion-extension | For instability and motion |
| Lateral bending | Motion, curve flexibility in scoliosis |
|
|
| Coils | Phased array, multicoil arrays |
| Field of view (FOV) | 16 to 24 cm |
| Matrix | 256 × 256 or 192 × 256 |
| Acquisitions | 1 |
| Pulse sequences | Section Thickness/Skip | FOV | Matrix | Acquisitions |
|---|---|---|---|---|
| Cervical spine—routine | ||||
| Sagittal spin echo (SE) 400/16 | 3.5/0.5 mm | 22-cm FOV | 256 × 192 | 3 |
| Sagittal fast-spin echo (FSE) 3275/105 | 3.5/0.5 mm | 22-cm FOV | 256 × 256 | 4 |
| Axial gradient-recalled echo 400/7, 20 degrees | 4 mm | 20-cm FOV | 256 × 192 | 2 |
| Thoracic spine | ||||
| Sagittal SE 475/16 | 3.5/0.5 mm | 28-cm FOV | 256 × 256 | 2 |
| Sagittal FSE 2800/105 | 3.5/0.5 mm | 28-cm FOV | 256 × 256 | 4 |
| Axial gradient-recalled echo 350/17, 20 degrees | 4 mm | 20-cm FOV | 256 × 192 | 4 |
| Lumbar spine | ||||
| Sagittal SE 475/16 | 4/1 mm | 28-cm FOV | 256 × 256 | 2 |
| Sagittal FSE 2800/102 | 4/1 mm | 28-cm FOV | 256 × 256 | 4 |
| Axial SE 470/17 | 5 mm | 18-cm FOV | 256 × 192 | 2 |
| Axial FSE 2800/105 | 5 mm | 18-cm FOV | 256 × 256 | 3 |
| Multilevel | ||||
| Sagittal SE 500/16 | 3.5/0.5 | 48-cm FOV | 512 × 512 | 2 |
| Sagittal FSE 3000/105 | 3.5/0.5 | 22-cm FOV | 256 × 256 | 2 |
Suggested Reading
Daffner RH. Cervical radiography for trauma patients. A time effective technique. AJR Am J Roentgenol 2000;175:1309–1311.
Wintermark
M, Moushine E, Theumann N, et al. Thoracolumbar spine fractures in
patients who have sustained severe trauma: Depiction with multidetector
row CT. Radiology 2003;227:681–689.
M, Moushine E, Theumann N, et al. Thoracolumbar spine fractures in
patients who have sustained severe trauma: Depiction with multidetector
row CT. Radiology 2003;227:681–689.
Witte RJ, Lane JI, Miller GM, et al. Spine. In: Berquist TH, ed. MRI of the musculoskeletal system, 5th ed. Philadelphia: Lippincott Williams & Wilkins; 2006:121–202.
P.33
Trauma: Cervical Spine—Basic Concepts
Key Facts
-
Approximately 65% of spinal injuries involve the cervical spine. The average number of injuries per patient is 2.2.
-
The incidence of cervical spine injury after blunt trauma is 2% to 6%.
-
The cervical spine should remain
immobilized until the patient has been cleared (no injury) or until the
extent of injury has been determined. -
Ninety percent of significant injuries are detectable on the lateral view.
-
Patients with altered mental status,
posterior midline tenderness, or neurologic deficit undergo CT in
addition to radiographs. CT has approximately a 100% sensitivity for
detection of fractures compared with 65% for radiographs. -
Understanding the mechanism of injury is helpful for evaluating images and determining prognosis (Table 3-1).
-
Stability of injuries is important to
assess. This usually can be accomplished on the lateral view or
reformatted CT images, although all images should be assessed.TABLE 3-1 CERVICAL SPINE TRAUMA: MECHANISMS OF INJURYType of Injury Radiographic Features Comments Hyperflexion Most common Disruptive hyperflexion Sprain, transient dislocation
Locked facets
Spinous process fracturesCompressive hyperflexion Vertebral wedge fractures
Teardrop fractures
Fracture/dislocationsShearing injuries Anteriorly displaced odontoid fractures Hyperextension Findings may be subtle Disruptive hyperextension Hangman’s fractures
Hyperextension sprain
Anterior inferior body fracturesCompressive hyperextension Posterior arch fractures
Hyperextension fracture/dislocationShearing Posteriorly displaced odontoid fractures Axial compression Jefferson fractures
Burst fracturesFlexion-rotation Rotary fixation of C1 on C2
Unilateral locked/perched facetsLateral flexion Uncinate process fractures
Transverse process fractures
Lateral wedge fractures -
Indicators of instability include
-
More than one column involved (Fig. 3-7)
-
Subluxation greater than 3 mm
-
Increased interspinous distance
-
Facet joint widening
-
Narrowed disc or widened space
-
Vertebral compression greater than 25%
-
P.34
 |
|
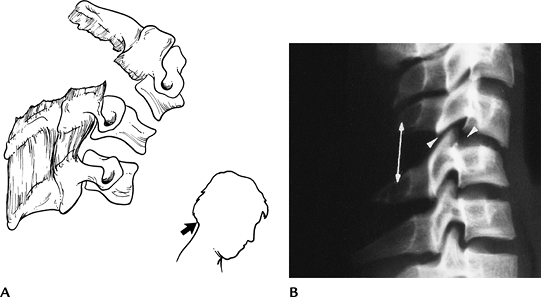
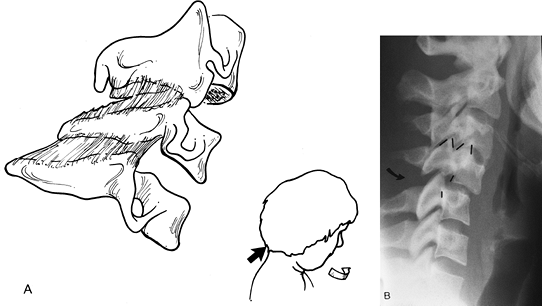
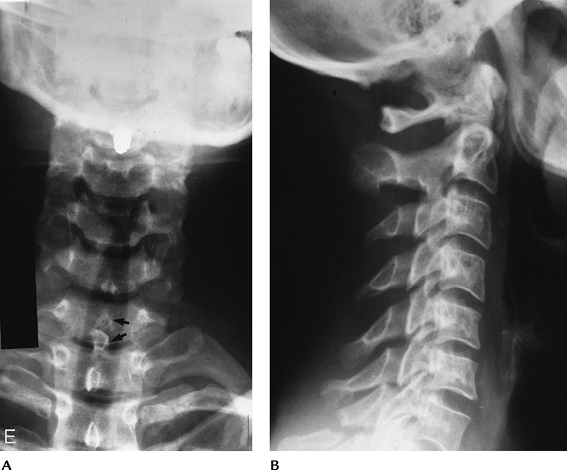
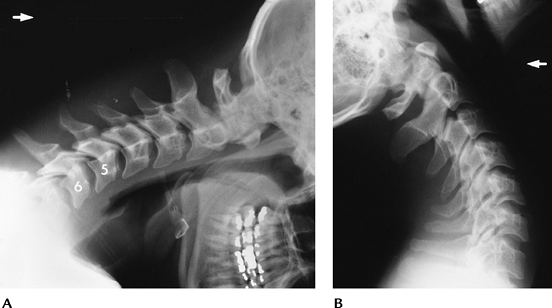
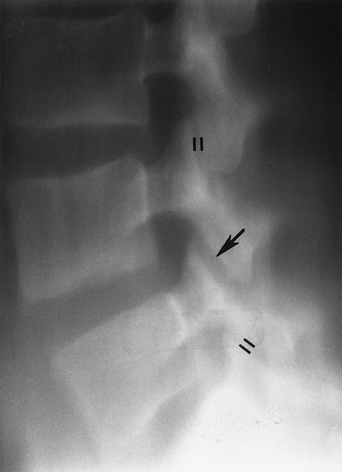
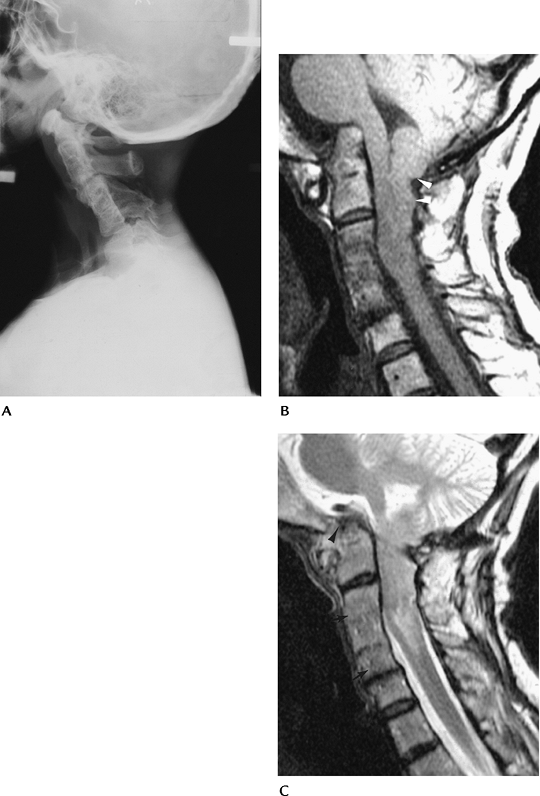
FIGURE 3-1 Disruptive hyperflexion injuries. (A) Mechanism (blow to the occipital region) that causes more posterior soft tissue injury compared with anterior compression. (B) Lateral radiograph shows widened interspinous distance (double arrow), subluxation of the facets (posterior arrowhead) and slight subluxation, and disc space widening (anterior arrowhead).
|
P.35
 |
|
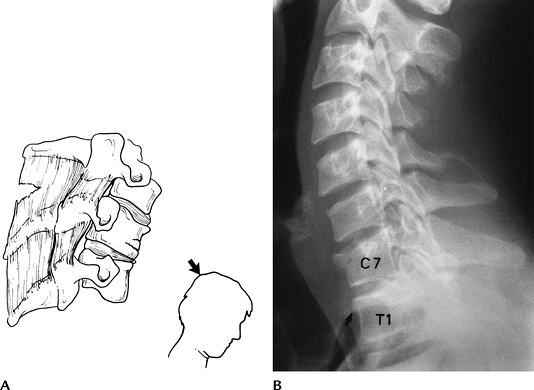
FIGURE 3-2 Compressive hyperflexion injuries. (A) Mechanism of injury with force transmitted to the anterior vertebral body. (B) Lateral radiograph demonstrates compression of C7 and T1 (arrow).
|
 |
|
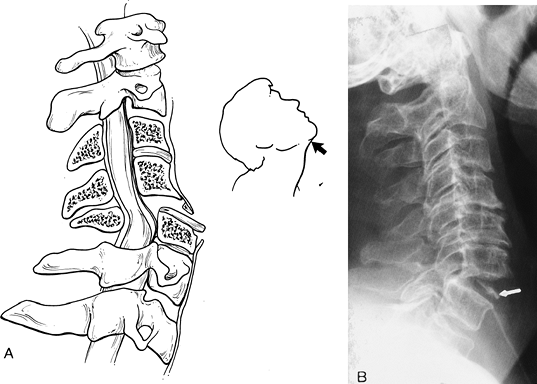
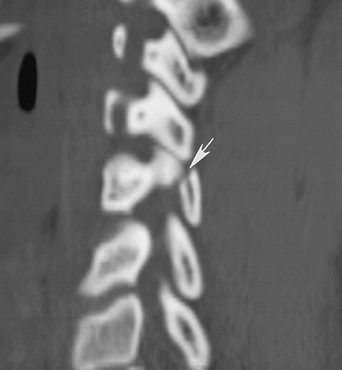
FIGURE 3-3 Disruptive hyperextension injuries. (A) Disruptive hyperextension injury with anterior distraction. The cord may be compressed. (B) Lateral radiograph shows anterior disc space widening and vertebral chip fracture (arrow).
|
P.36
 |
|
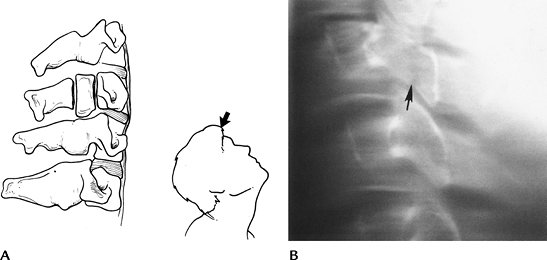
FIGURE 3-4 Compressive hyperextension injuries. (A) Mechanism resulting in posterior compression and less anterior distraction. (B) Lateral radiograph demonstrating a vertical posterior arch fracture (arrow).
|
 |
|
FIGURE 3-5 Flexion-rotation injuries. (A) Mechanism of injury. (B) Lateral radiograph shows a unilateral locked facet with subluxation and “bow-tie” configuration (lines) of the facets.
|
P.37
 |
|
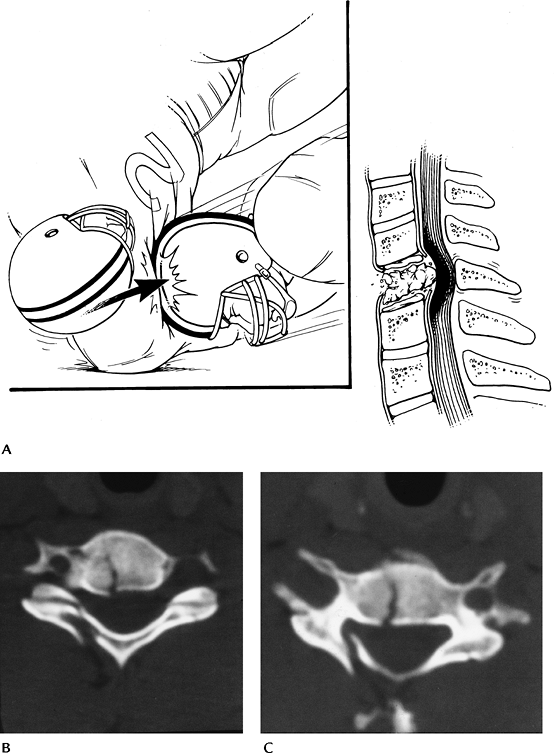
FIGURE 3-6 Vertical compression injuries. (A) Mechanism of injury. (B,C) Axial CT images of a burst fracture.
|
P.38
 |
|
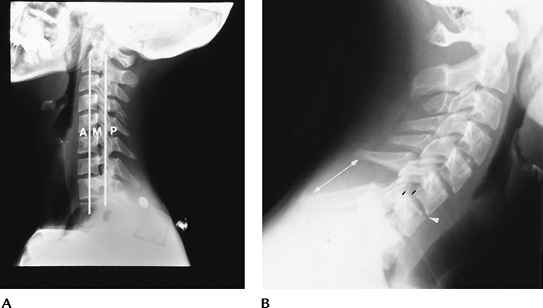
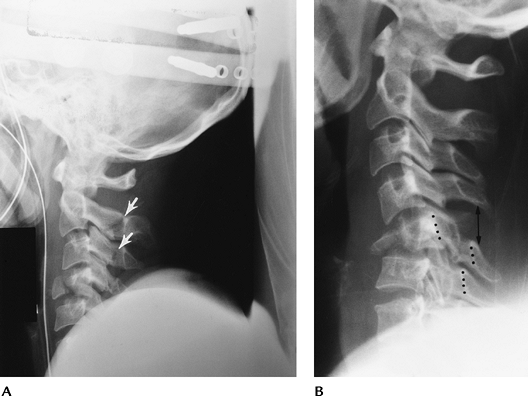
FIGURE 3-7 Instability. (A)
Lateral radiograph demonstrating the anterior (anterior longitudinal ligament, body, and disc), middle (posterior body and disc and posterior longitudinal ligament), and posterior (facet joints and posterior ligaments) columns. When two columns are involved the injury should be considered unstable. (B) Lateral view showing multiple column involvement with widened interspinous distance (double arrow), subluxation (black lines), and anterior disc space narrowing (arrowhead) caused by a disruptive hyperflexion injury. |
Suggested Reading
Denis F. Spinal instability as defined by the three column spine concept in acute spinal trauma. Clin Orthop 1984;189:65–76.
Gehweiler JA, Osborne RL, Becker RF. The radiology of the vertebral trauma. Philadelphia: WB Saunders; 1980.
Griffen
MM, Frykberg ER, Kerwin AJ, et al. Radiographic clearance of blunt
cervical spine injury: Plain radiograph or computed tomography scans. J Trauma 2003;55:222–227.
MM, Frykberg ER, Kerwin AJ, et al. Radiographic clearance of blunt
cervical spine injury: Plain radiograph or computed tomography scans. J Trauma 2003;55:222–227.
Sliker
CW, Mirvis SE, Shanmuganathan K. Assessing cervical spine stability in
obtunded blunt trauma patients: Review of the medical literature. Radiology 2005;234:733–739.
CW, Mirvis SE, Shanmuganathan K. Assessing cervical spine stability in
obtunded blunt trauma patients: Review of the medical literature. Radiology 2005;234:733–739.
P.39
Trauma: Cervical Spine—Atlanto-Occipital Fracture Dislocations
Key Facts
-
Atlanto-occipital dislocations usually are fatal; therefore, imaging is rarely performed.
-
The injury results from high-velocity shearing forces dislocating the head from C1.
-
In children, the condyles are less well developed, making patients more susceptible to injury.
-
If the patient survives the injury, treatment is occipital-C2 fusion.
 |
|
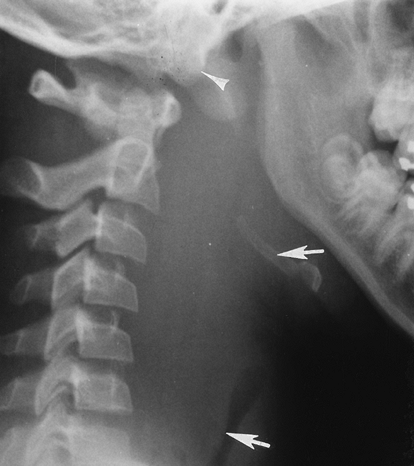
FIGURE 3-8 Atlanto-occipital dislocation. Lateral radiograph shows a huge prevertebral hematoma (arrows) with anterior dislocation of the occipital condyles (arrowhead). The patient did not survive.
|
Suggested Reading
Deliganis AV, Baxter AB, Hanson JA, et al. Radiologic spectrum of craniocervical distraction injuries. Radiographics 2000;20:S237–S250.
Hosalkar HS, Cain EL, Chin KR, et al. Traumatic atlanto-occipital dislocation in children. J Bone Joint Surg 2005;87A:2480–2488.
P.40
Trauma: Cervical Spine—C1 Fractures
Key Facts
-
Fractures of the atlas (C1) account for approximately 4% to 10% of all spinal injuries.
-
Five types of fracture typically occur.
-
Anterior arch—hyperextension
-
Posterior arch (67%)—hyperextension
-
Lateral mass—vertical compression
-
Transverse process—lateral flexion
-
Jefferson fracture—vertical compression
-
-
Associated injuries include
-
Hangman’s fractures (15%)
-
C7 spinous process fractures (26%)
-
Other lower cervical fractures (22%)
-
-
Neurologic injury is unusual, because the anatomy and mechanism of injury force the fragments away from the spinal canal.
-
Imaging is accomplished with lateral and open-mouth odontoid views. CT is preferred for complete evaluation.
P.41
 |
|
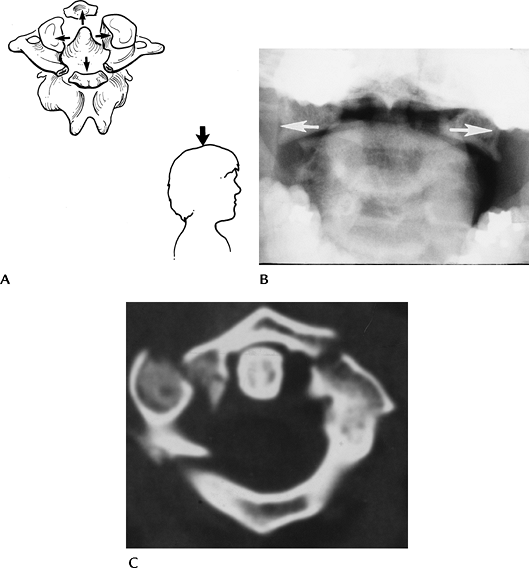
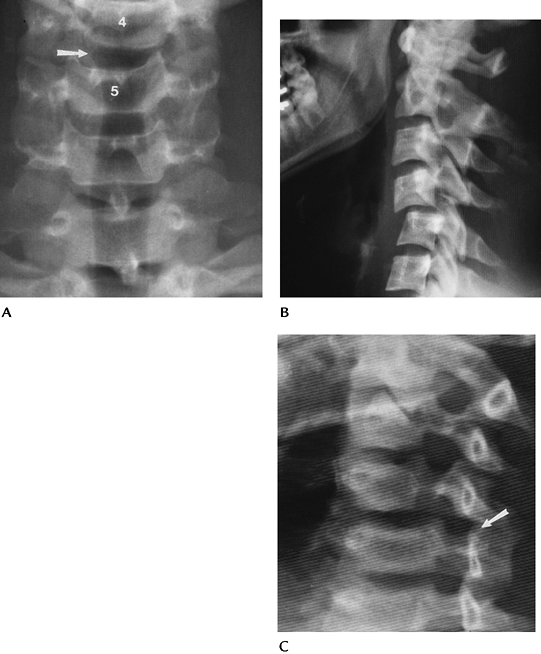
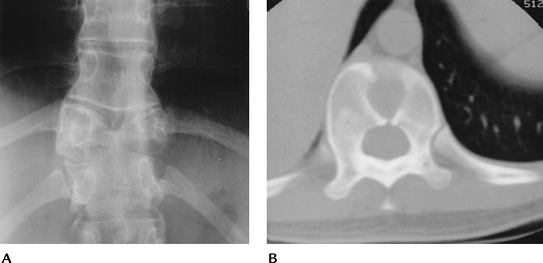
FIGURE 3-9 Jefferson fracture. (A) Mechanism of injury for Jefferson fractures. (B) AP open-mouth odontoid view shows displacement of the lateral masses outward (arrows). (C) The extent of injury is best appreciated on the axial CT image.
|
P.42
 |
|
FIGURE 3-10
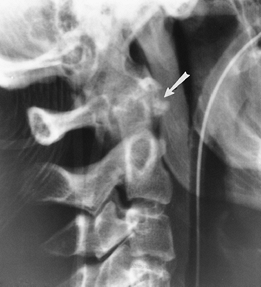
Hyperextension injury C1. Lateral radiograph of the upper cervical spine demonstrates an avulsion fracture of the anterior arch of C1 (arrow). |
Suggested Reading
Harris JH, Mirvis SE. The radiology of acute cervical spine trauma. 3rd ed. Baltimore: Williams and Wilkins; 1996:340–366.
Jackson RS, Banit DM, Rhyne AL, et al. Upper cervical spine injuries. J Am Acad Orthop Surg 2002;10:271–280.
P.43
Trauma: Cervical Spine—Atlantoaxial Dislocations
Key Facts
-
Traumatic dislocations of the atlantoaxial axis are rare.
-
The transverse ligament assists in
maintaining the normal C1–2 relationship. Subluxations may occur with
conditions that affect the normal osseous or ligamentous integrity
(rheumatoid arthritis, retropharyngeal infection, congenital
abnormalities, trauma). -
Traumatic subluxation/dislocation may be anterior, posterior, or rotary in nature.
-
Normally, the space between the odontoid and lower anterior arch of C1 is 2 mm in adults and 4 mm in children.
-
Imaging can be accomplished with lateral
and open-mouth odontoid views. However, thin-section CT with
reformatting or three-dimensional reconstruction is most accurate for
detection and classification.
P.44
 |
|
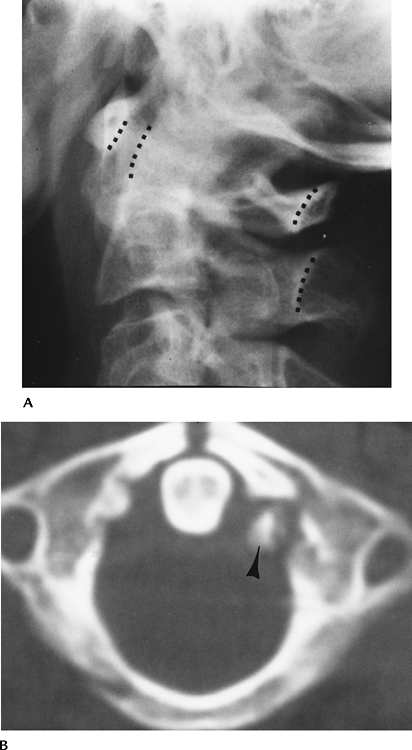
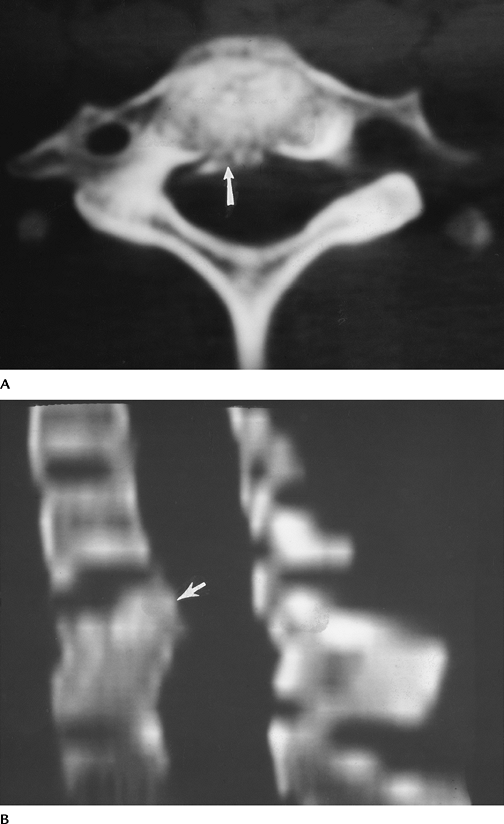
FIGURE 3-11 (A)
Lateral radiograph of the upper cervical spine demonstrates anterior subluxation of C1 on C2. Odontoid-C1 and posterior arch relationships (dotted lines). (B) Axial CT image demonstrates an anterior arch fracture (arrow) and avulsion (arrowhead) of the transverse ligament. |
P.45
 |
|
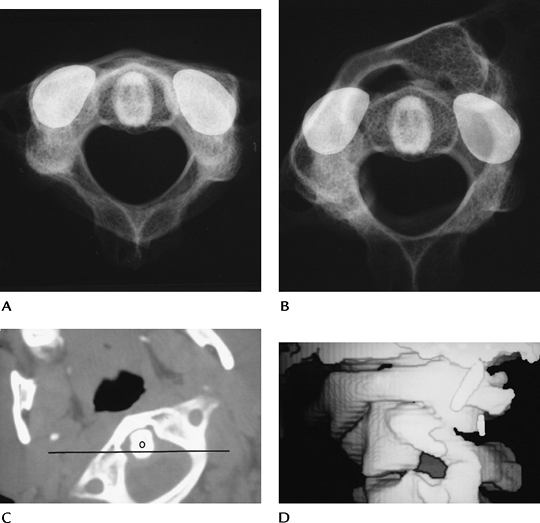
FIGURE 3-12 Rotary subluxation/fixation. Skeletal specimens with metal markers on the C2 facet demonstrating normal (A) and rotary fixation (B) of C1 on C2. Axial (C) and three-dimensional reconstruction images (D) show rotary fixation. The position of C2 (line). O, odontoid.
|
Suggested Reading
Fielding JW, Hawkins RJ. Atlantoaxial rotary fixation. J Bone Joint Surg 1977;57A:37–44.
Neumann U, Urbanski H, Riedel K. Posterior atlantoaxial dislocation without fracture of the odontoid. J Bone Joint Surg 2003;85A:1343–1346.
P.46
Trauma: Cervical Spine—Axis (C2)
Key Facts
-
Fractures of C2 are common, accounting for 15% to 27% of cervical spine injuries (Table 3-2).
Up to 25% have associated lower cervical fractures. Odontoid fractures
account for 75% of cervical spine injuries in children. -
Fractures of the odontoid and neural arch (hangman’s fracture) account for 80% of C2 fractures.
-
Odontoid fractures may be subtle, and up
to 25% of fractures can be missed unless reformatted (coronal and
sagittal) CT images are obtained. -
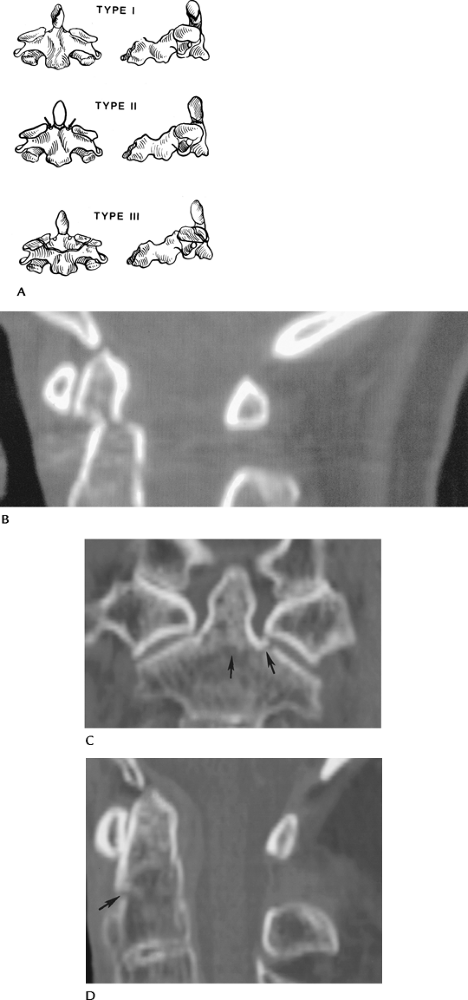
Odontoid fractures are classified by location (Table 3-3). Fractures of the base of the odontoid (Type II) have a high incidence of nonunion (54%–67%) and instability.
-
Hangman’s fractures (neural arch) are hyperextension injuries. Ten percent experience transient neurologic deficits.
-
Fractures of the body, lamina, and spinous processes of C2 occur less frequently.
-
Lateral radiographs usually identify the
abnormality, with the exception of undisplaced odontoid fractures. CT
with reformatted sagittal images is essential in these patients.
|
TABLE 3-2 AXIS (C2) FRACTURES
|
||||||||||
|---|---|---|---|---|---|---|---|---|---|---|
|
|
TABLE 3-3 ODONTOID FRACTURE CLASSIFICATION
|
||||||||||||
|---|---|---|---|---|---|---|---|---|---|---|---|---|
|
P.47
P.48
 |
|
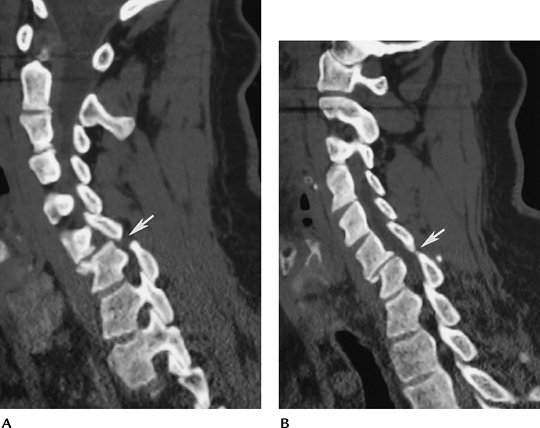
FIGURE 3-13 (A) Odontoid fracture classification: Type I—odontoid tip; Type II—odontoid base, above accessory ligament and vascular supply (arrows); and Type III—extend into body below vascular supply. (B) Sagittal reformatted CT image of a Type II odontoid fracture not evident on radiographs. Coronal (C) and sagittal (D) reformatted CT images of a Type III odontoid fracture (arrows).
|
 |
|
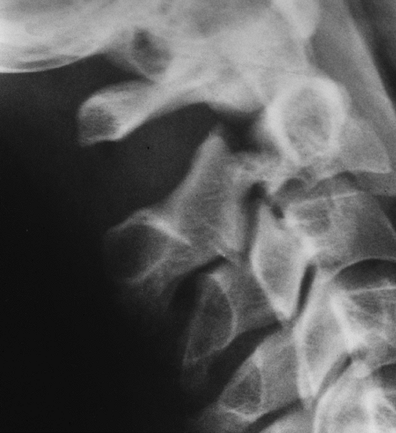
FIGURE 3-14 Hangman’s fracture with displacement of C2 on C3.
|
P.49
 |
|
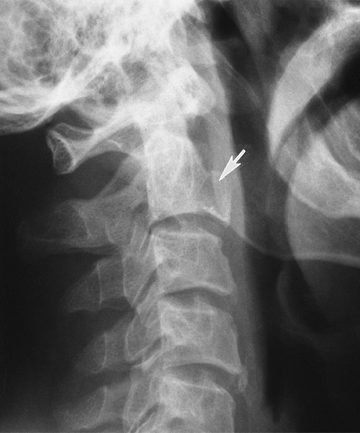
FIGURE 3-15 Anterior inferior body fracture of C2 (arrow).
|
Suggested Reading
Berquist TH. Imaging of orthopedic trauma. 2nd ed. New York: Raven Press; 1992:93–206.
Jackson RS, Banit DM, Rhyne AL, et al. Upper cervical spine injuries. J Acad Orthop Surg 2002;10:271–280.
P.50
Trauma: Cervical Spine—Lower Cervical Spine: Vertebral Arch Fractures
Key Facts
-
Vertebral arch fractures most frequently
are the result of hyperextension or lateral flexion injuries. Common
sites and incidences in our experience are as follows:• Lamina 28% • Pedicle 25% • Spinous process 22% • Pillar 16% • Facets 9% • Transverse process 2% • (Multiple injuries result in total >100%) -
Laminar fractures are commonly associated with spinous process fractures. The majority occur from C5–7.
-
Pedicle fractures may occur at C2
(hangman’s) or in the lower cervical spine. If undisplaced, they may be
easily overlooked on routine radiographs. -
Spinous process fractures are most common
from C5–T1. Injury may be the result of direct trauma, hyperextension,
or hyperflexion. -
Pillar fractures without displacement may be overlooked on radiographs. They are most common at C6.
-
Facet fractures are the result of flexion-rotation or hyperflexion injuries.
-
Transverse process fractures occur with direct trauma or lateral flexion.
P.51
 |
|
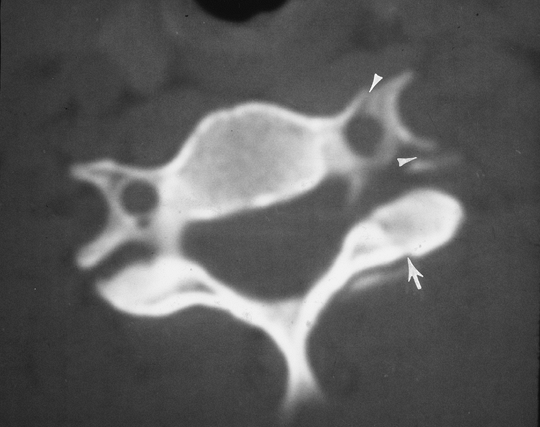
FIGURE 3-16 CT image of a facet fracture (arrow). There is also a fracture through the foramen transversarium (arrowheads).
|
P.52
 |
|
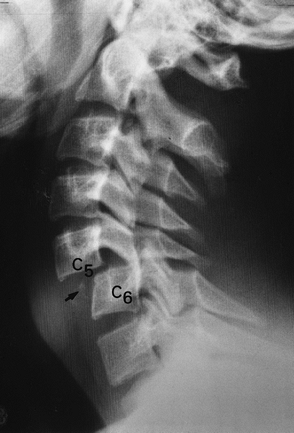
FIGURE 3-17 Sagittal CT image of a C5 facet fracture (arrow).
|
P.53
 |
|
FIGURE 3-18 Spinous process fracture at C7 (Clay shoveler’s fracture). (A) AP view shows a double spinous process (arrows). This is a helpful sign as the lower cervical spine is often difficult to visualize on the lateral view. (B) Lateral view shows the C7 spinous process fracture clearly in this case.
|
Suggested Reading
Berquist TH. Imaging of adult cervical spine trauma. Radiographics 1988;8:667–694.
Harris JH, Mirvis SE. The radiology of acute cervical spine trauma. 3rd ed. Baltimore: Williams and Wilkins; 1996:408–419.
P.54
Trauma: Cervical Spine—Lower Cervical Spine: Vertebral Body Fractures
Key Facts
-
More than 31% of cervical spine injuries involve the vertebral body. Seventy-five percent of fractures occur from C5–7.
-
Routine radiographs have 65% to 90%
sensitivity for fracture detection. However, CT is required for the
evaluation of subtle injuries, the spinal canal, and the fragment
position. -
Table 3-4 summarizes vertebral body fractures.
|
TABLE 3-4 VERTEBRAL BODY FRACTURES
|
|||||||||||||||||||||||
|---|---|---|---|---|---|---|---|---|---|---|---|---|---|---|---|---|---|---|---|---|---|---|---|
|
|||||||||||||||||||||||
P.55
 |
|
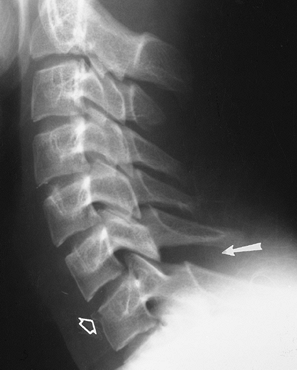
FIGURE 3-19 Flexion compression injury with compression of C7 and an anterior chip fracture (open arrow). There is widening of the interspinous distance (arrow) indicating posterior ligament injury and instability.
|
P.56
 |
|
FIGURE 3-20 Teardrop fractures. (A) Hyperextension teardrop of C4. Note the posterior arch fractures of C2 and C3 (arrows) indicating the mechanism of injury. (B) Hyperflexion teardrop fracture of C5 with compromise of the spinal canal (dotted lines) and posterior ligament tears (double arrow).
|
P.57
 |
|
FIGURE 3-21 Burst fracture. Axial (A) and reformatted sagittal (B) CT images show the fragments (arrow) and narrowing of the spinal canal.
|
P.58
Suggested Reading
Berquist TH. Imaging of orthopedic trauma. 2nd ed. New York: Raven Press; 1992:93–206.
Sanchez
B, Waxmann K, Jones T, et al. Cervical spine clearance in blunt trauma:
Evaluation of a computed tomography-based protocol. J Trauma 2005;59:179–183.
B, Waxmann K, Jones T, et al. Cervical spine clearance in blunt trauma:
Evaluation of a computed tomography-based protocol. J Trauma 2005;59:179–183.
P.59
Trauma: Cervical Spine—Lower Cervical Spine: Subluxation, Fracture/Dislocation
Key Facts
-
Most significant ligament injuries
involve the posterior column. Seventy-three percent occur at the C5–7
levels. Anterior ligament injuries are most common at C2–4 and C6–7.
Ligament injuries may occur alone or with fractures. -
The spectrum of injuries may be subtle,
without obvious abnormality and normal bony alignment, or injuries may
be grossly obvious, such as bilateral locked facets. -
Unilateral facet locking or perching may
present with subtle radiographic findings. This flexion-rotation injury
accounts for 12% of cervical injuries. Reformatted CT imaging is often
required for detection and complete evaluation of these injuries. -
Imaging of subluxation can be
accomplished with routine radiographs and CT. Flexion and extension
views can be performed to assess stability, but they should be
monitored fluoroscopically. In the acute setting, false-negative
results are not unusual the result of muscle splinting.
 |
|
FIGURE 3-22 Flexion distraction injury with posterior ligament tear at C5–C6. Flexion (A) and extension (B)
views show subluxation and widening of the interspinous distance and facet joints with flexion that reduces with extension. Treatment-posterior fusion. |
P.60
 |
|
FIGURE 3-23 Unilateral locked facet. (A) AP radiograph shows disc space asymmetry (arrow) at C4–C5 and rotation of the spinous process. (B) Lateral view shows subluxation, and the C4 facets form the “bow-tie” sign. (C) Oblique view shows the facet overlap (arrow).
|
P.61
 |
|
FIGURE 3-24 Sagittally reformatted CT images of locked (A) and perched (B) facets (arrow).
|
P.62
 |
|
FIGURE 3-25 Lateral radiograph demonstrates bilateral locked facets at C5–C6 with a chip fracture (arrow)
of C6. Subluxation with bilateral locked facets must be equal or greater than 50%. Quadriplegia occurs in 72% of patients with this injury. |
Suggested Reading
Harris JH, Mirvis SE. The radiology of acute cervical spine trauma. 3rd ed. Baltimore: Williams and Wilkins; 1996:270–276, 291–304.
Scher AT. Anterior cervical subluxation. An unstable position. AJR Am J Roentgenol 1979;133:275–280.
P.63
Trauma: Thoracolumbar Spine—Basic Concepts
Key Facts
-
Cervical spine injuries (cervical
spine—Basic Concepts) are more common because there are more
surrounding supporting structures for the thoracic and lumbar spine. -
Because of differences in range of
motion, transition in the facet joints, and other anatomic factors, the
thoracolumbar junction is most susceptible to injury (66% of injuries
occur between T12 and L2). -
Mechanism of injury
-
Hyperflexion (most common)
-
Flexion-compression
-
Flexion-distraction
-
Flexion-rotation
-
Lateral flexion
-
-
Vertical compression
-
Hyperextension
-
Shearing/rotation forces
-
-
Complete evaluation of bone and soft
tissue structures is essential to assess stability. Thoracolumbar spine
injuries are classified on the basis of radiographic and CT features.-
Instability: Three-column approach of Denis is most useful. If two columns (Fig. 3-26) are involved, the injury is unstable.
-
Image evaluation: Routine radiographs
remain the primary screening tool for thoracolumbar fractures. However,
new CT protocols are 78.1% sensitive for fracture detection compared
with 32% for radiographs or computed radiography images. CT is useful
to fully evaluate fragment position and spinal canal compromise.
Magnetic resonance imaging (MRI) is useful in selected cases to
evaluate the cord, nerve roots, and soft tissue injuries. Unsuspected
posterior ligament injuries are evident on MRI when not seen on
radiographs or CT.
-
P.64
 |
|
FIGURE 3-26 (A)
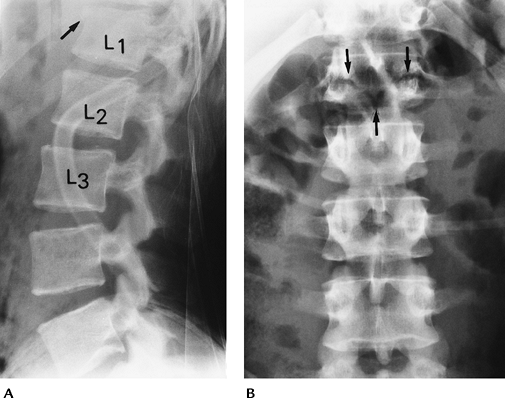
Lateral radiographs demonstrating the three columns proposed by Denis. Anterior-anterior longitudinal ligament, anterior disc, and vertebral body. Middle-posterior disc, body, and posterior longitudinal ligament. Posterior-facet joints, ligamentum flavum, interspinous, and supraspinous ligaments. (B) Lateral radiograph shows mild compression of L1 (arrow) with splitting of the neural arch (curved arrow) caused by hyperflexion distraction injury. Unstable with three-column involvement. |
Suggested Reading
Denis F. The three-column spine and its significance in classification of thoraco-lumbar spinal injuries. Spine 1983;8:817–831.
Lee
HM, Kim HS, Suk KS, et al. Reliability of magnetic resonance imaging in
detecting posterior ligament complex injuries in thoracolumbar spinal
fractures. Spine 2000;25:2079–2084.
HM, Kim HS, Suk KS, et al. Reliability of magnetic resonance imaging in
detecting posterior ligament complex injuries in thoracolumbar spinal
fractures. Spine 2000;25:2079–2084.
Wintermark
M, Moushine E, Theumann N, et al. Thoracolumbar spine fractures in
patients who have sustained severe trauma: Depiction with multidector
row CT. Radiology 2003;227:681–689.
M, Moushine E, Theumann N, et al. Thoracolumbar spine fractures in
patients who have sustained severe trauma: Depiction with multidector
row CT. Radiology 2003;227:681–689.
P.65
Trauma: Thoracolumbar Spine—Hyperflexion Injuries
Key Facts
-
Hyperflexion injuries are most common in the thoracolumbar spine.
-
The axis of force centers in the middle
of the intervertebral disc. Therefore, the appearance of injury may
vary at different levels of the spine. The discs are larger in the
lower thoracic and lumbar spine, so endplate fractures are more common.
When the force continues, anterior compression is more likely. -
Types of fracture:
-
Anterior wedge fracture:Almost always visible on AP and lateral radiographs.
Evaluate degree of compression and disc space narrowing (poorer
prognosis) on the lateral view and paraspinal soft tissue swelling on
the AP view. -
Lateral wedge fracture:Caused by lateral compression. Best seen on AP radiograph. Typically a stable lesion.
-
Flexion-distraction injury:The majority are located at the thoracolumbar junction.
Neurologic complications occur in 70%. When the posterior arch and
ligaments are disrupted, the lesion is unstable. Radiographs may show
minimal compression on the lateral view. The posterior arch injury may
be seen more easily in the AP view. CT with reformatting is important
for complete assessment. Seat-belt injuries occur less frequently today
but present with the pattern described earlier. Neurologic injury
occurs in 4%. Abdominal injuries are common, occurring in 80% of
patients.
-
P.66
P.67
 |
|
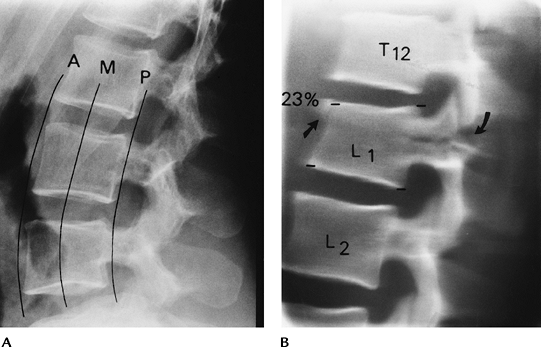
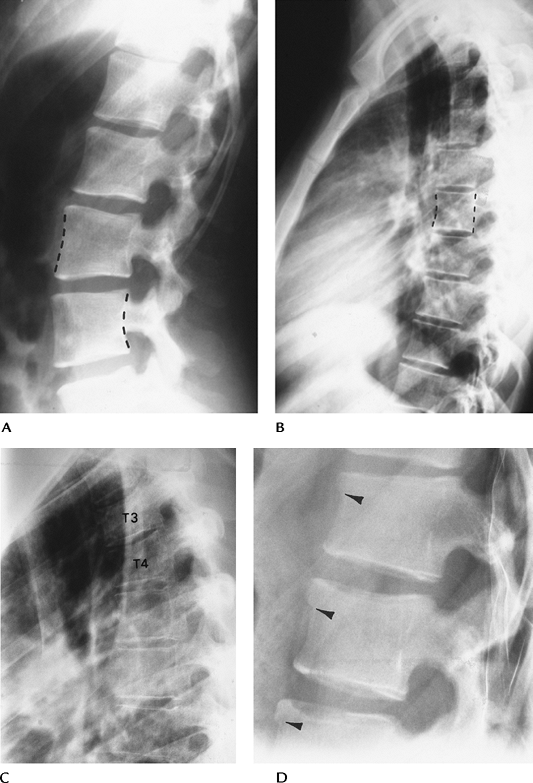
FIGURE 3-27 Anterior wedge fractures. Normal anterior and posterior cortical lines of the lumbar (A) and thoracic (B)
vertebral bodies. The lumbar vertebral body is concave anteriorly and posteriorly, and the thoracic vertebral body is concave anteriorly and straight posteriorly. Lateral radiographs of mild anterior wedge fractures of T3 and T4 (C) and T12–L2 (D). Note the anterior buckling of the cortex in (D) (arrowheads). |
 |
|
FIGURE 3-28 Lateral wedge fractures. Asymmetric compression of L3 (A) (arrow) and T5 (B) (broken lines).
|
P.68
 |
|
FIGURE 3-29 (A) Lateral radiograph demonstrating a Chance fracture (flexion-distraction injury). There is only mild compression (arrow) of L1. (B) AP radiograph clearly demonstrates the fracture through the posterior elements (arrows).
|
Suggested Reading
Rogers LF. The roentgenographic appearance of transverse or chance fractures of the spine. The seat belt fracture. AJR Am J Roentgenol 1971;111:844–849.
Vialle LR, Vialle E. Thoracic spine fractures. Injury 2005;36:S-B65–S-B72.
Wood
KB, Khanne G, Vaccaro AR, et al. Assessment of two thoracolumbar
fracture classification systems used by multiple surgeons. J Bone Joint Surg 2005;87A:1423–1429.
KB, Khanne G, Vaccaro AR, et al. Assessment of two thoracolumbar
fracture classification systems used by multiple surgeons. J Bone Joint Surg 2005;87A:1423–1429.
P.69
Trauma: Thoracolumbar Spine—Flexion-Rotation Injuries
Key Facts
-
Flexion-rotation injuries are relatively uncommon (10% of thoracolumbar injuries) but among the most unstable.
-
The injury typically occurs at the thoracolumbar junction. Neurologic injury occurs in 70%.
-
Radiographic features may be subtle or
similar to those described with this injury in the cervical spine. CT
is essential to confirm the extent of injury and to plan reduction.
 |
|
FIGURE 3-30 Lateral radiograph demonstrating separation of the L4–L5 facet joint (arrow) secondary to a flexion-rotation injury.
|
P.70
 |
|
FIGURE 3-31 CT image demonstrating facet separation and neural arch fractures.
|
Suggested Reading
Manaster BJ, Osborne AG. CT patterns of facet dislocation at the thoracolumbar junction. AJR Am J Roentgenol 1987;148:335–340.
P.71
Trauma: Thoracolumbar Spine—Vertical Compression Injuries
Key Facts
-
Vertical compression injuries result in axial compression with burst fractures.
-
Disc herniation into vertebral endplates and displaced fragments into the spinal canal occur to varying degrees.
-
The injury accounts for 1.5% of spinal injuries and is most common from T12–L2.
-
Burst fractures can be identified on AP
and lateral radiographs. There is increased interpedicular distance and
paraspinal swelling seen on AP radiographs. In the lateral view, the
vertebral body is compressed to a variable degree and the posterior
cortical line is convex instead of concave. CT is essential to assess
the spinal canal and fragment position. The entire spine should be
studied because separate injuries occur in 40%. MRI using T2-weighted
images may demonstrate posterior ligament injury not evident on CT or
radiographs.
 |
|
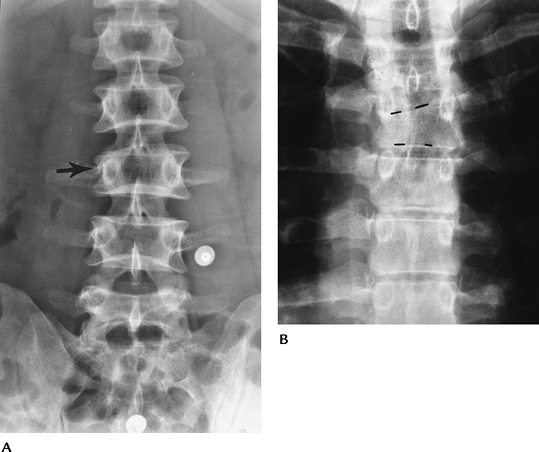
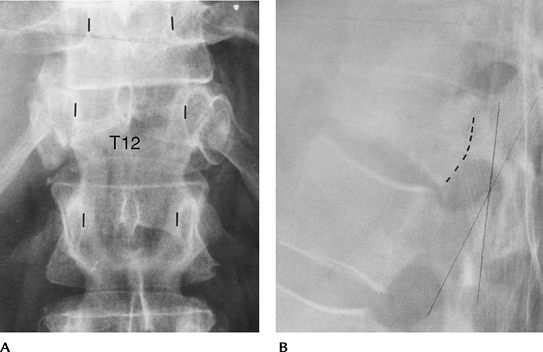
FIGURE 3-32 T12 burst fracture. (A) AP radiograph demonstrates widening of the interpedicular distance (lines mark pedicles T11 to L1). (B) Lateral radiograph shows vertebral compression and posterior cortical convexity (broken lines).
|
P.72
P.73
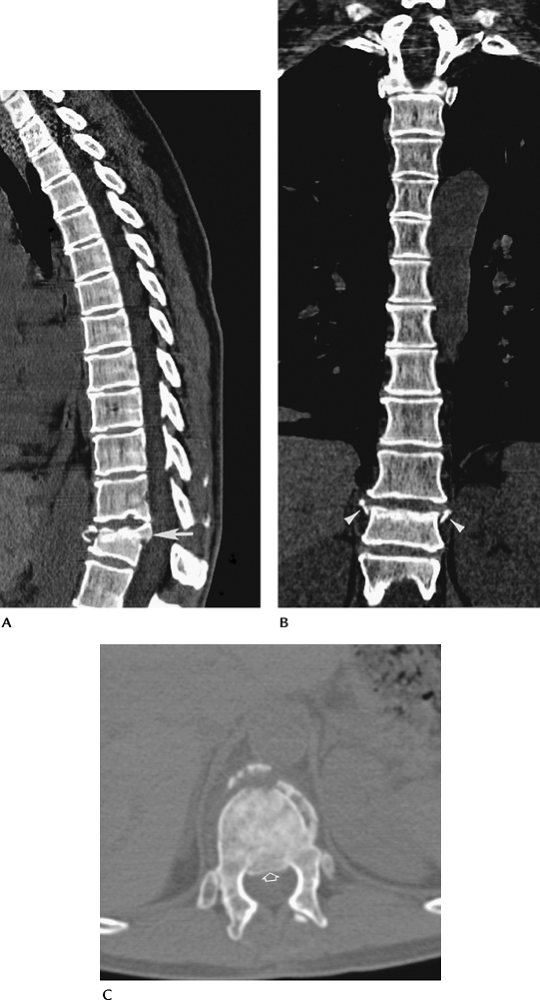 |
|
FIGURE 3-33 Lower thoracic burst fracture. Reformatted sagittal (A) and coronal (B) CT images demonstrate vertebral compression with outward displacement of fragments on the coronal image (arrowheads) and posterior displaced fragments on the sagittal image (arrow). Axial image demonstrates displaced anterior fragments and posterior extension into the spinal canal (open arrow).
|
Suggested Reading
Atlas SW, Regenbogen V, Rogers LF, et al. The radiographic characterization of burst fractures of the spine. AJR Am J Roentgenol 1986;147:575–582.
Petersilge CA, Pathria MN, Emery SE, et al. Thoracolumbar burst fractures: Evaluation with MR imaging. Radiology 1995;194:49–54.
P.74
Trauma: Thoracolumbar Spine—Hyperextension Injuries
Key Facts
-
Hyperextension injuries in the thoracolumbar spine are rare.
-
Posterior arch fractures are a hallmark
of this injury, but the strong, broad anterior longitudinal ligament is
difficult to disrupt in the lumbar spine compared with the cervical
spine. -
Features of hyperextension injuries are
similar to those in the cervical spine and best demonstrated on lateral
radiographs. CT should be performed with coronal and sagittal
reformatting for complete evaluation.
 |
|
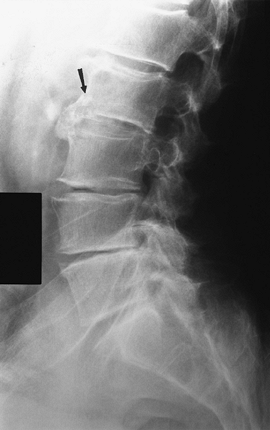
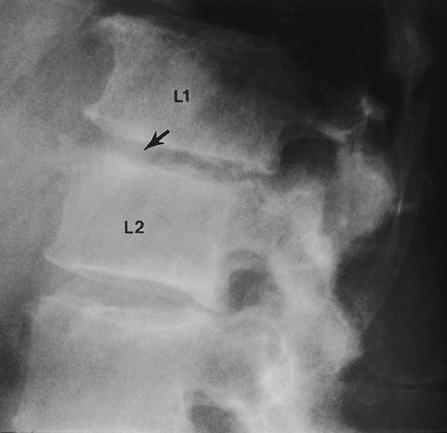
FIGURE 3-34 Lateral radiograph demonstrating an anterior-inferior fracture of L2 (arrow) caused by hyperextension injury.
|
Suggested Reading
Berquist TH. Imaging of orthopedic trauma. 2nd ed. New York: Raven Press; 1992:93–206.
Roaf A. A study of the mechanism of spinal injuries. J Bone Joint Surg 1960;42B:810–823.
P.75
Trauma: Thoracolumbar Spine—Shearing Injuries
Key Facts
-
Shearing forces may cause dislocation
(usually anterior displacement of the vertebra onto the vertebra below)
in an AP or transverse direction. -
In our experience, this injury is most common in the thoracic spine.
-
Lesions usually are unstable, with significant cord injury.
-
Routine radiographs (AP and lateral) are
adequate for detection. When possible, examination with CT, or MRI in
selected cases, is useful for planning spinal instrumentation.
 |
|
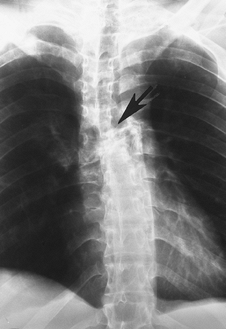
FIGURE 3-35 AP radiograph of a transverse shearing fracture dislocation (arrow) of the thoracic spine.
|
P.76
P.77
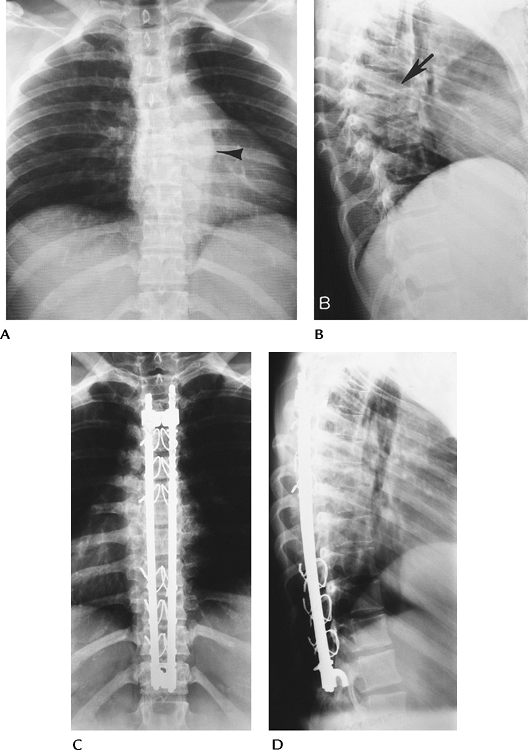 |
|
FIGURE 3-36 Posterior dislocation. (A) AP radiographs demonstrating prominent paraspinal soft tissue swelling (arrowhead). (B) Lateral radiograph showing posterior dislocation (arrow) in the midthoracic spine. AP (C) and lateral (D) radiographs after Harrington rod instrumentation with sublaminar wire augmentation.
|
Suggested Reading
Berquist TH. Imaging atlas of orthopedic appliances and prostheses. New York: Raven Press; 1995:109–215.
Holdsworth F. Fracture and fracture-dislocations of the spine. J Bone Joint Surg 1970;52A:1534–1551.
P.78
Trauma: Thoracolumbar Spine—Minor Fractures
Key Facts
-
Minor fractures include isolated neural
arch fractures, spinous process fractures, facet fractures, and
transverse process fractures. -
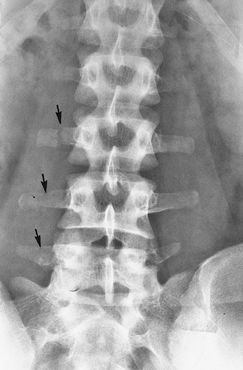
Spinous process fractures occur most frequently in the upper thoracic spine and are rare in the lumbar spine.
-
Transverse process fractures usually are
the result of direct trauma. They are not significant in and of
themselves, but may be associated with retroperitoneal hematoma or
renal injury.
 |
|
FIGURE 3-37 AP radiograph of the lumbar spine demonstrating multiple transverse process fractures (arrows).
|
Suggested Reading
Berquist TH. Imaging of orthopedic trauma, 2nd ed. New York: Raven Press; 1992:93–206.
P.79
Spondylolysis/Spondylolisthesis
Key Facts
-
Spondylolisthesis is anterior subluxation
of a vertebral body on the vertebral body below it. Wiltse classified
this disorder into five categories:-
Congenital
-
Fractures (stress, elongation of the pars, acute fracture)
-
Degenerative
-
Trauma to neural arch other than the pars
-
Pathologic bone diseaseRepetitive trauma and degenerative disease are the most common. Patients present with chronic or intermittent low-back pain.
-
-
Spondylolysis is a pars interarticularis
defect that occurs in 2.3% to 7.2% of patients; 67% occur at L5 and 10%
at L4. The condition is bilateral in 74%. The cause is unclear, but
both inheritance and acquired risk factors are implicated. The
condition increases with age and is more common in whites than African
Americans. -
Spondylolisthesis caused by bilateral
pars defects is most common at L5–S1. Degenerative spondylolisthesis is
most common at L4–5. -
Treatment depends on symptoms and the
degree of subluxation and instability. Surgical intervention is most
commonly required for higher grades of subluxation. -
Image features
-
Radiographic features: Subluxation is
easily appreciated on lateral radiographs. Flexion and extension
studies are useful to evaluate stability. Oblique views may be
necessary to define pars defects. -
CT: Axial and coronal and sagittal
reformatted CT images are useful for defining pars defects and the
extent of fragmentation and neuroforaminal evaluation. -
Radionuclide scans: Single-photon emission CT is useful for identification of stress injuries.
-
MRI: Sagittal and axial magnetic
resonance (MR) images are useful for neural involvement. Bone changes
are more easily assessed with CT, although reactive marrow changes,
edema, and synovitis are best appreciated with fat-saturated
T2-weighted MR images.
-
P.80
 |
|
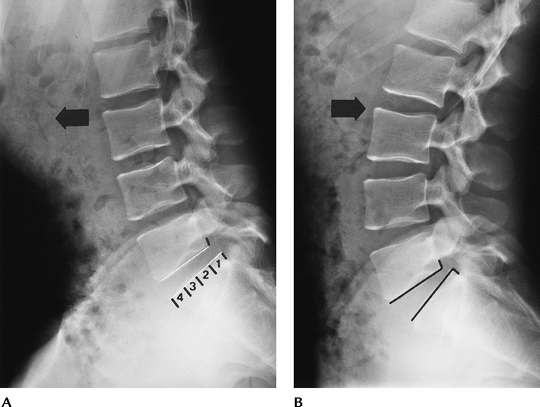
FIGURE 3-38 Flexion (A) and extension (B)
radiographs demonstrating anterior subluxation of L5 on S1. The degree of subluxation is determined by dividing the lower vertebral endplate into four equal segments. Subluxation is graded 1 to 4. In this case, it is Grade 1 and reduces slightly with extension. |
P.81
 |
|
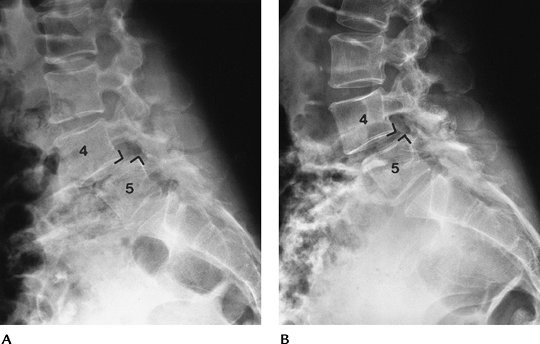
FIGURE 3-39 Flexion (A) and extension (B)
radiographs of Grade 1–2 spondylolisthesis that increases with flexion. At this level, the subluxation is most commonly the result of facet degenerative disease. |
 |
|
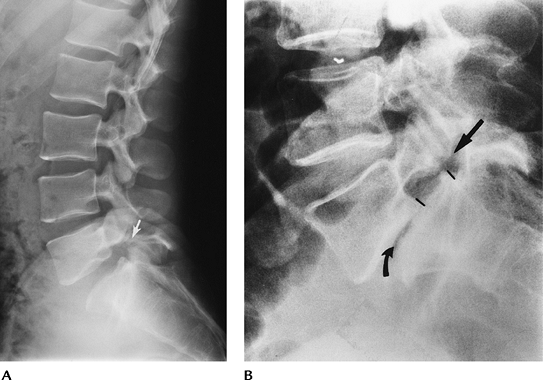
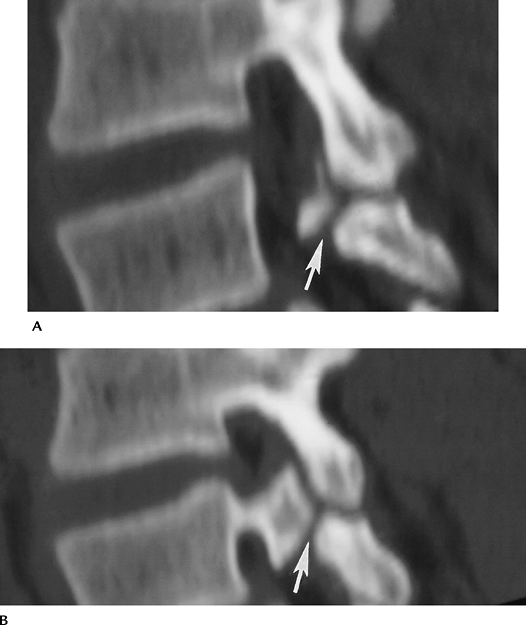
FIGURE 3-40 (A) Lateral radiograph demonstrating a pars defect at L5 (arrow) with slight subluxation of L5 on S1. (B) Lateral radiograph shows Grade 2–3 subluxation caused by a pars defect (arrow). There is associated degenerative disc disease (curved arrow).
|
P.82
 |
|
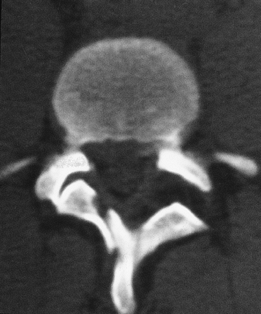
FIGURE 3-41 Sagittal reformatted CT images (A, B) of bilateral pars defects (arrow).
|
Suggested Reading
Horowitch A, Peck RD, Thomas JC, et al. The Wiltse pedicle screw fixation system. Spine 1989;14:461–467.
McTimoney CA, Micheli LJ. Current evaluation and management of spondylosis and spondylolisthesis. Curr Sports Med Rep 2003;2:41–46.
Wiltse LL, Neuman DH, MacNab I. Classification of spondylosis and spondylolisthesis. Clin Orthop 1976;117:23–29.
P.83
Scoliosis: Basic Concepts
Key Facts
-
Scoliosis may be idiopathic, congenital, or acquired (Table 3-5).
-
Idiopathic scoliosis may be infantile (≤3 years), juvenile (3 years to puberty), or adolescent (puberty and older).
Infantile Occurs in males more than females
Left thoracic curve most common
Curves less than 30 degrees may resolveJuvenile Occurs in females more than males
Right thoracic curve most common
Progression of curves more common than in infantile typeAdolescent Frequently detected on school physical examination
Occurs in females more than males
Curves tend to progress during growth spurts
Curves less than 30 degrees tend not to progress at skeletal maturityP.84TABLE 3-5 SCOLIOSISIdiopathic
Infantile
Juvenile
Adolescent
Congenital
Hemivertebrae
Wedge vertebrae
Unilateral bar
Bilateral bar (block vertebrae)
Neuromuscular development
Myelodysplasia
Diastematomyelia
Meningocele
Extraskeletal development
Rib fusions
Myositis ossificans progressiva
Neuromuscular
Syringomyelia
Myopathies
Skeletal dysplasia
Trauma
Metabolic bone disease
Neoplasms -
Congenital scoliosis is commonly the result of vertebral anomalies. Other organ anomalies are common as well.
Scoliosis: Imaging
Key Facts
-
Routine radiographs: Imaging of scoliosis
is accomplished primarily with radiographs. Standing full-length spine
AP and lateral views are needed for curve evaluation and measurement.
Lateral bending views are used to evaluate flexibility of curves.
Flexible (nonstructural) curves correct with bending to the convex
side. Structural curves do not correct. -
CT or MRI may be needed to evaluate certain neural or osseous anomalies.
-
Curve measurement: Lippman-Cobb method.
The upper and lower end vertebrae are selected. These are the upper and
lower vertebrae that are directed maximally to the concavity of the
curve. Lines are drawn along the endplates or pedicles if the endplate
is indistinct. With larger curves, the points where the lines cross
measure the angle L. For smaller curves, perpendicular lines are drawn to the end lines and the angle s is formed by these lines (Fig. 3-42). Regardless of which method is used to calculate the angle, angle L = angle s. -
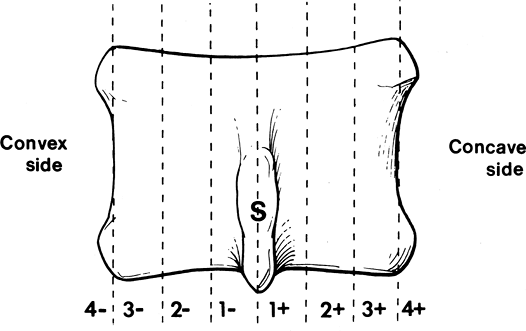
Rotation: The degree of rotation is
important for selecting the type and length of spinal instrumentation.
The apex vertebra is selected, and the position of the spinous process
is used to grade rotation from 1 to 4 (+ concave side, convex side). -
Treatment: Treatment varies with the
extent of curve, degree of rotation, and surgical preference. Anterior,
posterior, or combined instrumentation may be required. Treatment goals
include (1) achieve solid fusion, (2) prevent curve progression, (3)
improve cosmetic appearance, and (4) reduce or prevent back pain and
functional impairment. -
Complications of instrumentation
-
Loss of correction
-
Rod fracture
-
Cable rupture
-
Hook displacement
-
Screw pullout
-
Pseudoarthrosis
-
Neurologic
-
Infection
-
Local pain
-
P.85
 |
|
FIGURE 3-42
Lippman-Cobb measurement. Lines are configured along the endplate or pedicles of the upper and lower vertebrae maximally directed to the concave side. Where these cross measures angles for large curves (L). Perpendicular lines are drawn to the endplate lines for smaller curves(s). Angle L = angles. |
 |
|
FIGURE 3-43
Rotational measurement. Neutral is spinous process midline (S). Positive is rotation of the spinous process to the concave side and negative to the convex side graded 1 to 4. |
P.86
 |
|
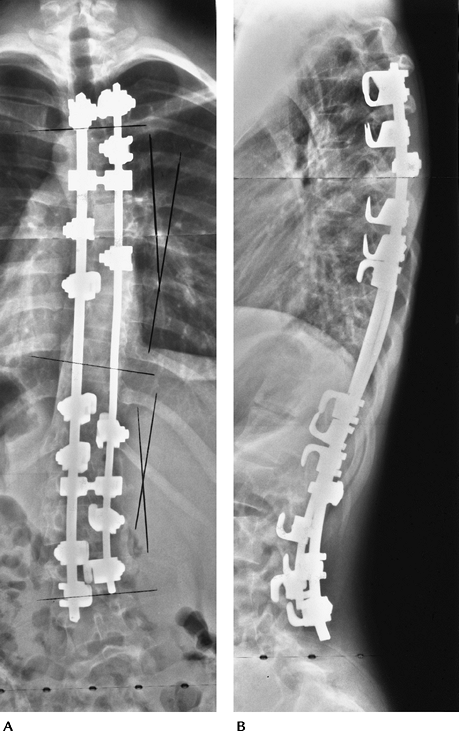
FIGURE 3-44 Standing AP (A) and lateral (B) radiographs after reduction with rods and hooks.
|
P.87
 |
|
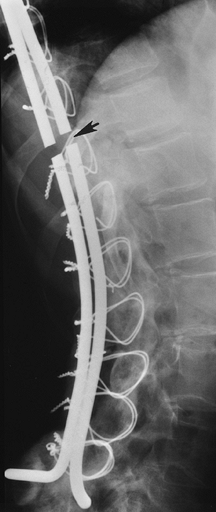
FIGURE 3-45 Lateral radiograph with fractured Luque rods (arrow) after treatment with rods and sublaminar wires.
|
Suggested Reading
Busch CH, Kalen V. Three-dimensional computed tomography in assessment of congenital scoliosis. Skel Radiol 1999;28:632–637.
Helenius I, Remes V, Yrjonen T, et al. Harrington and Cotrel-Dubousset instrumentation in adolescent idiopathic scoliosis. J Bone Joint Surg 2003;85A:2303–2309.
McAlister WH, Shackelford GD. Measurement of spinal curvatures. Radiol Clin North Am 1975;13:113–121.
P.88
Degenerative Disc Disease
Key Facts
-
Disc degeneration (intervertebral osteochondrosis) is a normal sequela of aging.
-
Loss of disc height (water and
elasticity) or extension of disc material into adjacent vertebral
endplates or through the annulus fibrosis may occur. -
Traction on the vertebral margins results in osteophyte formation.
-
Biomechanical changes cause associated
facet degeneration in many patients. The combination of disc and facet
disease may lead to spinal canal narrowing (spinal stenosis), neural
foraminal narrowing, and/or lateral recess narrowing. -
Disc degeneration at multiple levels may be the result of calcium pyrophosphate dihydrate deposition or ochronosis.
-
Image features
-
Radiographic: Loss of disc space height,
asymmetric in many cases. Calcification or vacuum disc phenomenon,
osteophyte formation, loss of normal lordosis, subluxation if facet
degeneration present. -
MRI: Loss of disc height and abnormal signal intensity caused by decreased water and cellularity.
-
Endplate changes:
-
Type I ↓ Signal intensity on T1-weighted sequences and ↑ signal intensity on T2-weighted sequences.
-
Type II Increased signal on T1-weighted
sequences compared with normal marrow and slight increase on isointense
with marrow on T2-weighted sequences. -
Type III End-stage degenerative disease with decreased signal on T1- and T2-weighted sequences.
-
-
 |
|
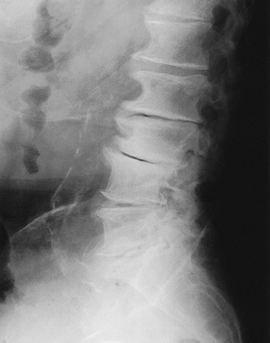
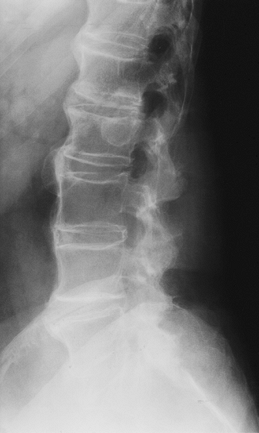
FIGURE 3-46
Lateral radiograph of the lumbar spine demonstrates prominent osteophytes and vacuum disc phenomenon at L2–L5 levels. There is loss of the lumbar lordotic curve. |
P.89
 |
|
FIGURE 3-47 Type I endplate changes. Sagittal T1-weighted (A) and T2-weighted (B) images demonstrate decreased signal relative to marrow on T1-weighted (A) and increased signal on T2-weighted (B) images.
|
P.90
P.91
 |
|
FIGURE 3-48 Type II endplate changes. Sagittal T1-weighted (A) and T2-weighted (B) images demonstrate increased signal relative to marrow on both T1- and T2-weighted sequences.
|
P.92
 |
|
FIGURE 3-49 Type III endplate changes. Decreased signal (arrows) seen on both T1-weighted (A) and T2-weighted (B) images.
|
Suggested Reading
Modic MT, Steinberg PM, Ross JS, et al. Degenerative disc disease: Assessment of changes in vertebral marrow with MR imaging. Radiology 1988;166:193–199.
P.93
Disc Herniation
Key Facts
-
Disc herniations may occur in the lumbar,
thoracic, and cervical regions. They result from annular defects with
herniation of disc material. -
Disc herniation may be central or to the
right or left of midline. Herniations to the right or left frequently
compress the traversing and/or exiting nerve roots. -
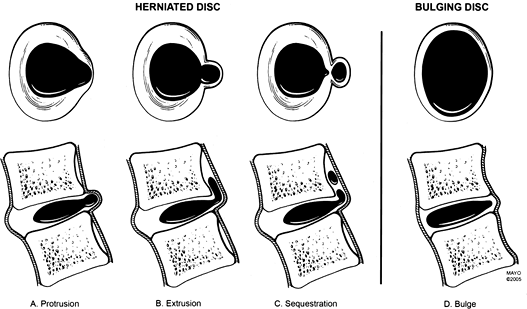
Terminology (Fig. 3-50)
-
Disc bulge: Broad-based expansion of the
circumference of the disc do to loss of interspace height with
extension beyond the confines of the adjacent vertebral body secondary
to laxity of the annular fibers without evidence of concentric tear. -
Disc protrusion: Focal broad-based
expansion of disc material that is confined by the outer annular
layers. On sagittal and axial images, it is seen only at the disc level. -
Disc extrusion: Herniation of nucleus
pulposus through all layers of the annulus. A small extrusion can be
difficult to distinguish from a disc protrusion. The disc extrusion
appears as a focal soft tissue mass that may displace the thecal sac or
traversing and exiting nerve roots. -
Disc sequestration: Disc material that
has herniated through all layers of the annulus and is no longer
connected to the parent disc. The sequestered fragment can migrate
several disc levels superiorly or inferiorly.
-
-
Not all disc herniations are symptomatic or surgical lesions.
-
Imaging today usually is accomplished
with axial and sagittal MR images. Myelography or CT myelography also
may be used for disc herniation.
 |
|
FIGURE 3-50 Disc bulge, protrusion, extrusion, and sequestration based on consensus terminology. (From
Witte RJ, Lane JI, Miller GM, et al. Spine. In: Berquist TH, ed. MRI of the musculoskeletal system. 5th ed. Philadelphia: Lippincott Williams & Wilkins; 2006:121–202.)
|
P.94
 |
|
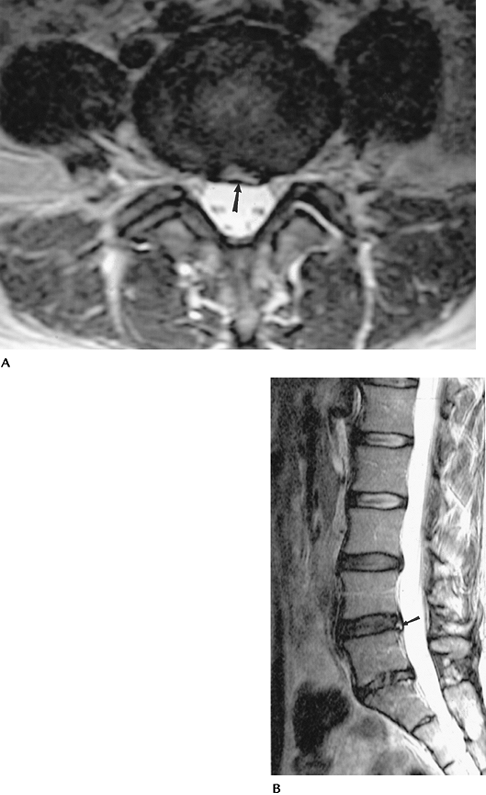
FIGURE 3-51 Lumbar disc bulge at L3–4. Sagittal T1-weighted (A) and axial (B) T2-weighted images demonstrate broad-based bulging of the posterior annulus (arrowhead). The normal disc contour at L3–4 would be slightly concave.
|
P.95
 |
|
FIGURE 3-52 Lumbar disc protrusion at L4–5. Axial (A)
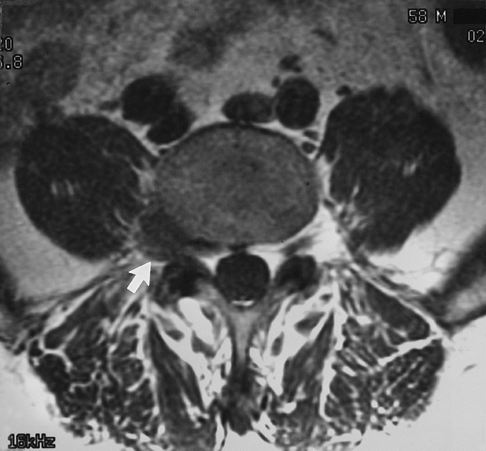
T2-weighted image demonstrates a focal left posterolateral disc protrusion flattening the left ventral lateral aspect of the thecal sac (arrow). On the sagittal image (B) there is a focus of increased T2 signal intensity in the posterior annulus (arrow) compatible with an annular tear. |
P.96
 |
|
FIGURE 3-53 Lumbar disc extrusion. T1-weighted image showing a lateral fragment (arrow) displacing the exiting L4 nerve root and probably contacting the L5 nerve root.
|
P.97
 |
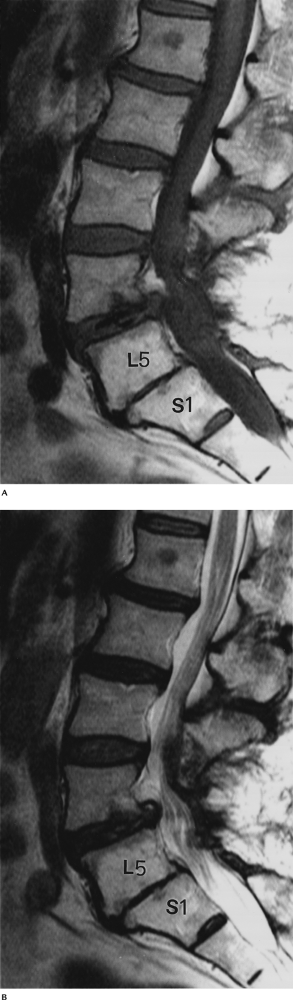
|
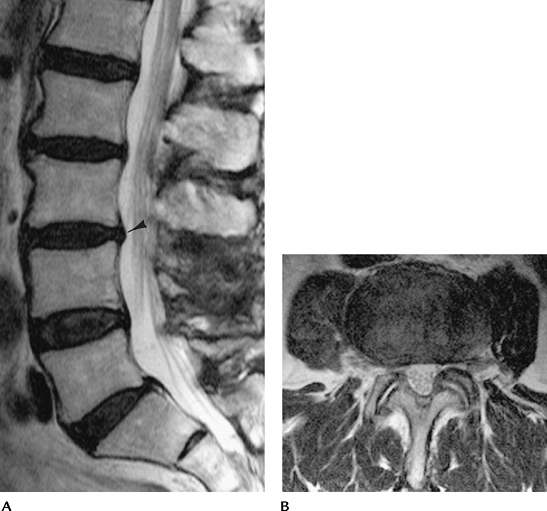
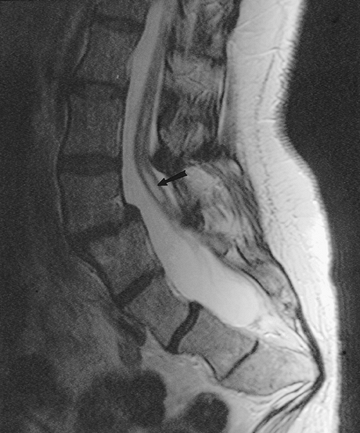
FIGURE 3-54 Lumbar disc sequestration. Sagittal T2-weighted (A) image demonstrates a rounded focal 1-cm region of soft tissue signal intensity posterior to the upper L5 vertebral body (arrows) separate from the parent disc. Axial T1-weighted (B) image demonstrates disc material in the left lateral recess of L5 (arrows).
|
Suggested Reading
Jenkins
JR, Whittemore AR, Bradley WE. Anatomic basis of vertebrogenic pain and
autonomic syndrome associated with lumbar disc extrusion. AJNR Am J Neuroradiol 1989;10:219–231.
JR, Whittemore AR, Bradley WE. Anatomic basis of vertebrogenic pain and
autonomic syndrome associated with lumbar disc extrusion. AJNR Am J Neuroradiol 1989;10:219–231.
Weishaupt
D, Zanetti M, Hodler J, et al. MR imaging of the lumbar spine.
Prevalence of intervertebral disc extrusion and sequestration, nerve
root compression, end plate abnormalities and osteoarthritis of the
facet joints in asymptomatic volunteers. Radiology 1998;209:661–666.
D, Zanetti M, Hodler J, et al. MR imaging of the lumbar spine.
Prevalence of intervertebral disc extrusion and sequestration, nerve
root compression, end plate abnormalities and osteoarthritis of the
facet joints in asymptomatic volunteers. Radiology 1998;209:661–666.
P.98
Synovial Cysts
Key Facts
-
Synovial cysts typically arise from the facet joints and are associated with degenerative disease.
-
Patients present with compressive symptoms similar to disc herniation or spinal stenosis.
-
Simple cysts are well defined, with low
signal intensity on T1-weighted and high signal intensity on
T2-weighted sequences. Signal intensity may vary if calcification,
hemorrhage, or air is present in the cyst. -
Cysts are most common in the lumbar spine at L4–5 and L5–S1, but also may occur at the cervicothoracic junction.
-
Cysts occur more commonly on the right.
 |
|
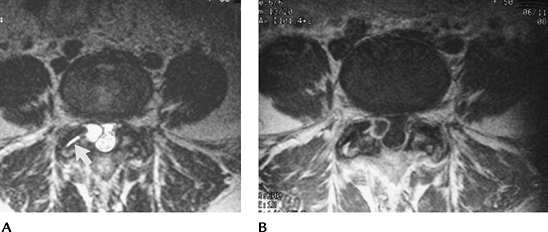
FIGURE 3-55 Synovial cyst. Axial T2-weighted (A) and postcontrast-enhanced T1-weighted (B) images showing a cyst extending from the L4 facet compressing the dural sac. Note the wall of the cyst enhances with contrast (B). (From
Witte RH, Miller GM. Spine. In: Berquist TH, ed. MRI of the musculoskeletal system. 4th ed. Philadelphia: Lippincott Williams & Wilkins; 2001:105–194.
) |
Suggested Reading
Krauss WE, Atkinson JLD, Miller GM. Juxtafacet cysts of the cervical spine. Neurosurgery 1998;43:1363–1368.
Silbergleit
R, Geborski S, Brunberg J, et al. Lumbar synovial cysts. Correlation of
myelographic CT, MR, and pathologic finding. AJNR Am J Neuroradiol 1990;11:777–779.
R, Geborski S, Brunberg J, et al. Lumbar synovial cysts. Correlation of
myelographic CT, MR, and pathologic finding. AJNR Am J Neuroradiol 1990;11:777–779.
P.99
Infection (Infectious Spondylitis)
Key Facts
-
Spinal infections may occur by
hematogenous spread, usually arterial, although the Batson venous
plexus can be a route. Infectious spondylitis accounts for 4% to 7% of
all cases of osteomyelitis. -
The source of infection often is unknown,
although common sources include cutaneous, genitourinary, and
respiratory systems. Infection also can be transmitted during
intervention or by spread from adjacent soft tissues. -
Disc space or vertebral osteomyelitis is most common in men 50 to 70 years old. The lumbar spine is involved most often.
-
Patients present with pain and history of recent primary infection or surgical procedure. Staphylococcus aureus is the most common organism.
-
Tuberculous spondylitis most often
involves the thoracic spine. Disc spaces are preserved for a longer
time compared with pyogenic infections. Paraspinal abscesses are common. -
Image features
-
Routine radiographs: Progressive loss of
disc height with endplate irregularity. Later, bone sclerosis may occur
with pyogenic or tuberculous infections. It is uncommon for infection
to occur in a vacuum disc. Soft tissue swelling. -
CT: Defines bone loss earlier and provides method to monitor needle aspiration to isolate organisms.
-
MRI: Abnormal signal intensity in
vertebra and disc (↓ T1-weighted image, ↑ T2-weighted image) with an
indistinct vertebral endplate. Epidural and paraspinal extension are
easily identified. The abnormal disc usually enhances.
-
P.100
 |
|
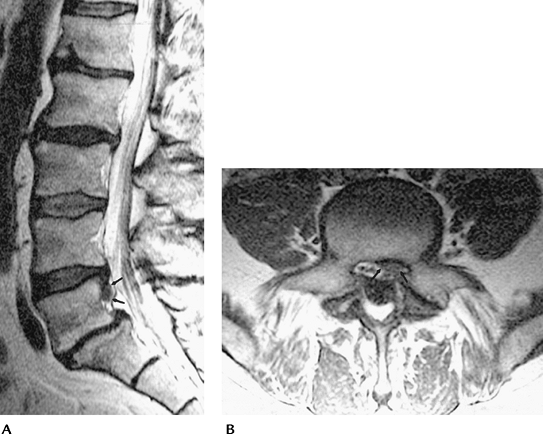
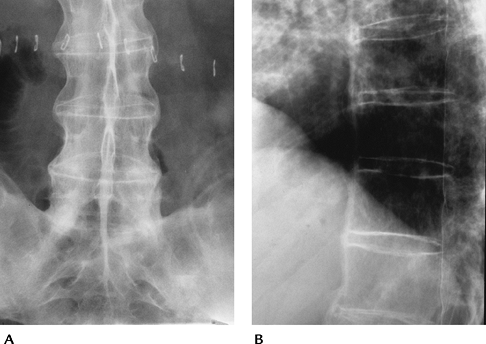
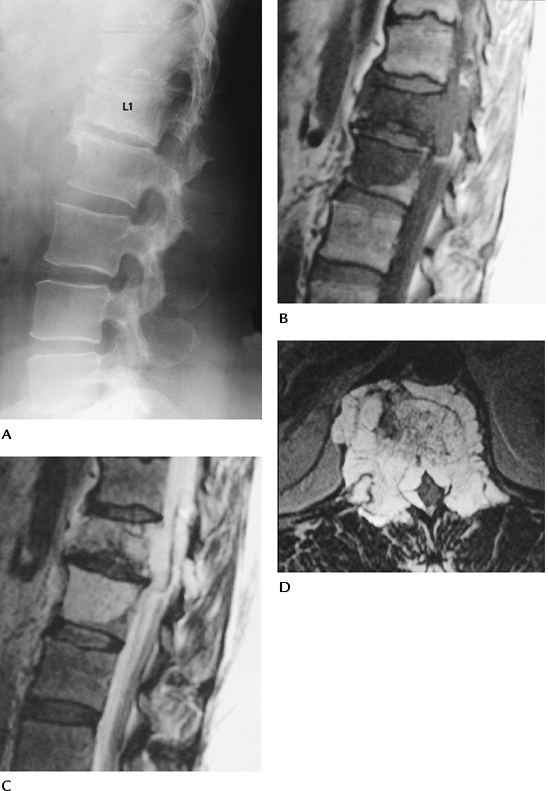
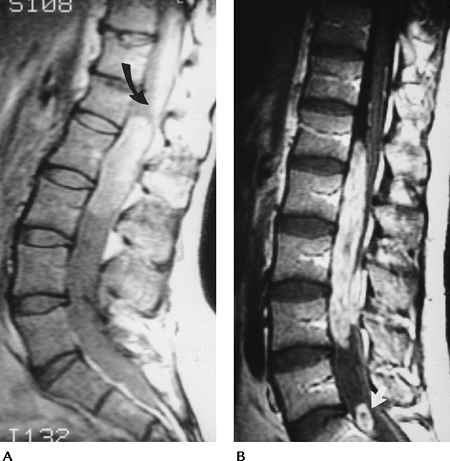
FIGURE 3-56 Discitis. Lateral radiograph shows loss of disc height and early endplate irregularity at L1–2 (arrow). Note the normal disc below.
|
P.101
 |
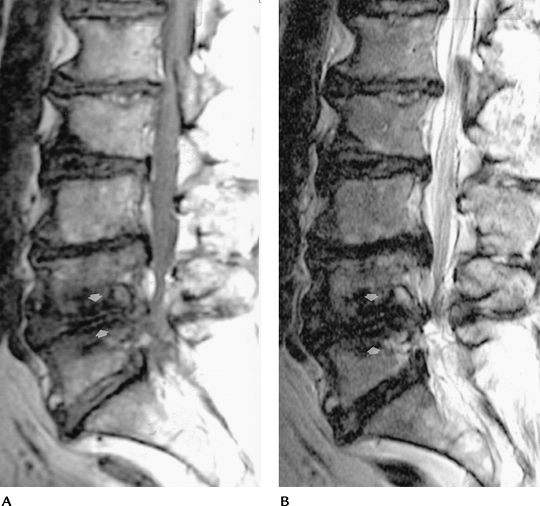
|
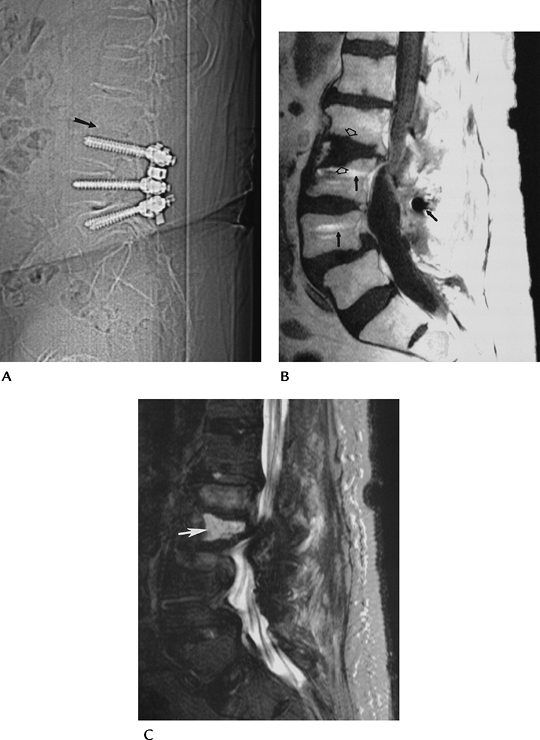
FIGURE 3-57 Postoperative lumbar disc space infection and osteomyelitis. (A) Sagittal CT scout image shows rod and pedicle screw instrumentation L3–L5. The L2–L3 endplates (arrow) are indistinct. Sagittal T1-weighted (B) and T2-weighted (C) images demonstrate loss of the endplates (open arrows) and increased signal intensity (white arrow) in the disc on the T2-weighted image (C). Note the minimal metal artifact (black arrows).
|
P.102
 |
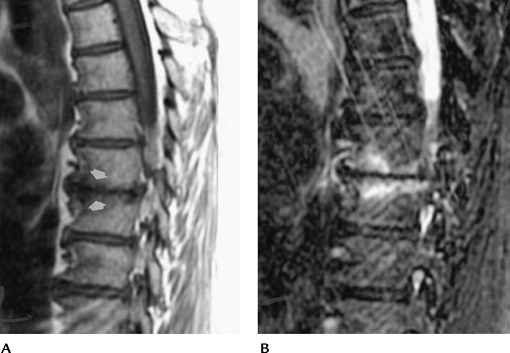
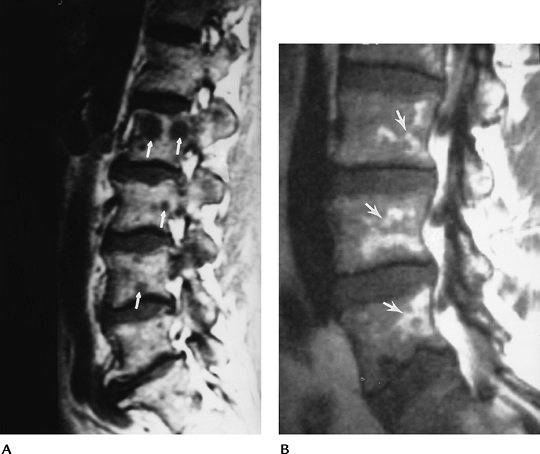
|
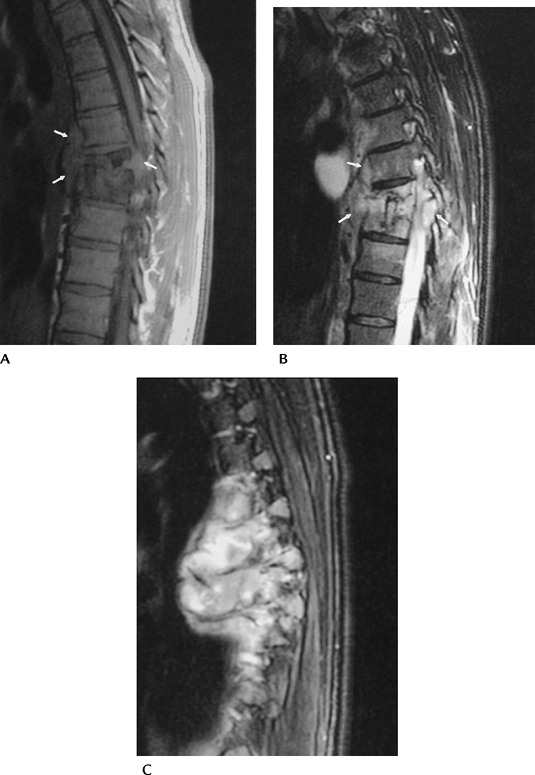
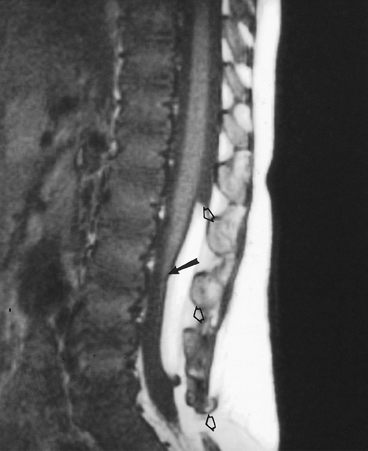
FIGURE 3-58 Tuberculous spondylitis in the thoracic spine. Sagittal T1-weighted (A) and T2-weighted (B) images demonstrate disc space loss and vertebral compression with paravertebral soft tissue extension (arrows). Off-axis sagittal image (C) shows a large multiloculated paraspinal abscess.
|
P.103
Suggested Reading
Jung NY, Jee WH, Ha KY, et al. Discrimination of tuberculous spondylitis from pyogenic spondylitis on MRI. AJR Am J Roentgenol 2004;182:1405–1410.
Stabler A, Reiser MF. Imaging of spinal infections. Radiol Clin North Am 2001;39:115–135.
P.104
Arthropathies
Key Facts
-
Arthropathies in the spine involve the vertebral bodies, facet joints, and disc spaces.
-
Arthropathies cause four types of “phytes.”
-
Syndesmophyte: Vertical ossification
bridging the vertebrae. Seen with ankylosing spondylitis, Reiter
disease, psoriatic arthritis, and inflammatory bowel disease. -
Marginal osteophyte: Horizontal bone extending from the vertebral endplate. Seen with trauma and degenerative disc disease.
-
Nonmarginal osteophyte: Bone extension that is several millimeters away from the endplate
-
Paraspinal osteophyte: Ossification of
the soft tissues surrounding the vertebrae. Seen with diffuse
idiopathic skeletal hyperostosis (DISH).
-
-
Small marginal or nonmarginal osteophytes with normal disc spaces are seen with spondylosis deformans.
-
Ankylosing spondylitis results in ankylosis with smooth symmetric syndesmophytes.
-
Reiter disease and psoriatic spondylitis
cause asymmetric prominent syndesmophytes. Psoriatic spine involvement
is more common than Reiter disease. -
DISH has normal disc spaces with ligament
and tendon ossification. Diagnosis is made when four or more contiguous
vertebrae are involved. -
Rheumatoid arthritis most commonly
involves the upper cervical spine. Inflammation may erode the odontoid
(14%–35%). Instability at C1–2 may cause cord compression and basilar
invagination.
P.105
 |
|
FIGURE 3-59 Ankylosing spondylitis. (A) AP radiograph or the lumbar spine and sacroiliac joints. Note the smooth symmetric syndesmophytes (arrows). (B) Lateral radiograph of the lower thoracic spine shows smooth ossification of the anterior longitudinal ligament.
|
 |
|
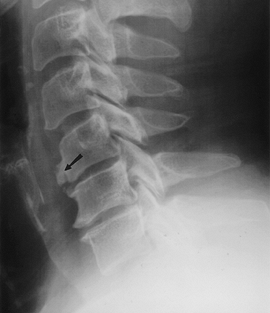
FIGURE 3-60 Lateral radiograph of the cervical spine demonstrating marginal osteophytes at C6–7 and a nonmarginal osteophyte at C5 (arrow).
|
P.106
 |
|
FIGURE 3-61
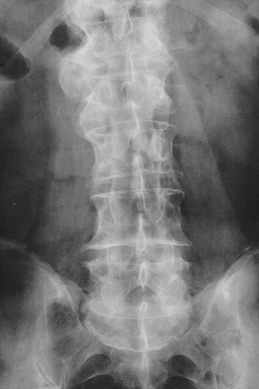
Psoriatic arthritis. AP radiograph of the lumbar spine demonstrating prominent asymmetric upper lumbar osteophytes. There is also asymmetric sacroiliac joint involvement. |
 |
|
FIGURE 3-62 DISH. Lateral view of the lumbar spine with prominent contiguous osteophytes and normal disc spaces.
|
P.107
 |
|
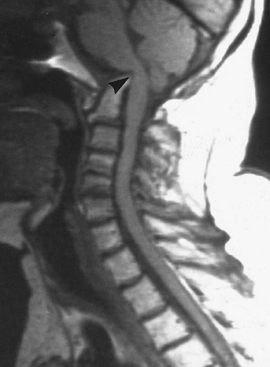
FIGURE 3-63
Rheumatoid arthritis. Sagittal T1-weighted MR image shows the odontoid projecting upward behind the clivus compressing the cord against the arch of C1 (arrowhead). |
Suggested Reading
Brower AC. Arthritis in black and white, 2nd ed. Philadelphia: WB Saunders; 1997:175–191.
P.108
Tumors and Tumorlike Conditions: Bone Lesions
Key Facts
-
The spine is a common site for metastasis and multiple myeloma.
-
Most metastases involve the thoracic spine. They usually are multiple and may be epidural or intradural.
-
Patients with primary or metastatic bone lesions generally present with pain.
-
Table 3-6 lists common benign and malignant lesions that may involve the spine.
-
Imaging approaches
-
Routine radiographs: AP and lateral
radiographs of the symptomatic site or skeletal survey for suspected
myeloma or metastasis. Lesions may be lytic, blastic, or mixed,
depending on the primary. -
Radionuclide scans: Screening for metastatic disease. May be false-negative in myeloma or with aggressive metastatic lesions.
-
CT: Excellent for isolated lesions to demonstrate bone involvement and tumor matrix.TABLE 3-6 OSSEOUS TUMORS AND TUMORLIKE CONDITIONS OF THE SPINE
Benign No. in Spine/Total/% in Spine Osteoblastoma 37/87/43% Hemangioma 28/108/26% Aneurysmal bone cyst 60/289/21% Osteoid osteoma 37/331/11% Giant cell tumor 32/568/6% Osteochondroma 22/872/3% Malignant No. in Spine/Total/% in Spine Chordoma 220/356/62% Myeloma 267/814/33% Lymphoma 116/694/17% Ewing sarcoma 50/512/10% Chondrosarcoma 72/895/8% -
MRI: Metastatic screening can be
accomplished with T1-weighted sagittal images of the spine and coronal
images of the pelvis and hips. Primary lesions are examined using
T1-weighted and T2-weighted sequences in two image planes. Gadolinium
may make metastasis isointense with marrow, requiring fat suppression.
P.109 -
 |
|
FIGURE 3-64 Sagittal T1-weighted images of the lumbar spine in a patient with lung metastasis (A) and marrow involvement in a patient with multiple myeloma (B). Note the multiple of low signal intensity (arrows) in (A). There is marrow replacement with only a small amount of fatty marrow (arrows) in (B).
|
P.110
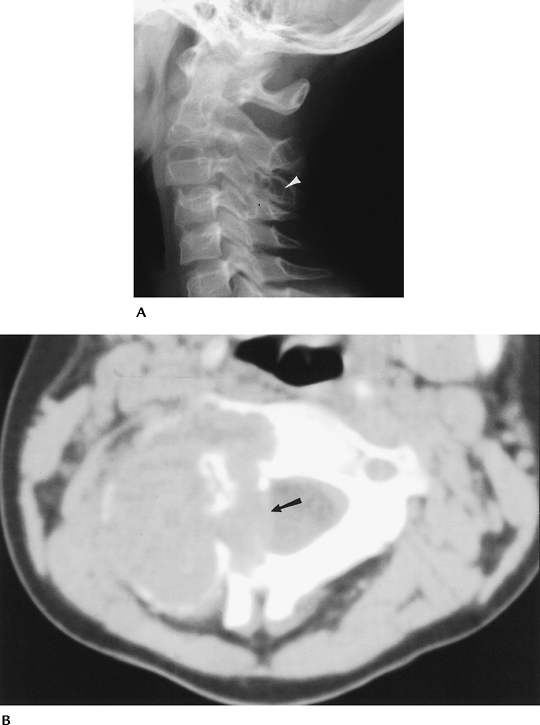 |
|
FIGURE 3-65 Aneurysmal bone cyst. (A) Lateral radiograph demonstrates a well-defined lytic area in the C3 spinous process (arrow). (B) CT image shows the extent of the lesion with bone expansion, blood attenuation levels, and compression (arrow) of the dural sac.
|
P.111
 |
|
FIGURE 3-66 Spinal chordoma. (A)
Lateral radiograph shows sclerosis and compression of L1 (15% of chordomas involve the spine, 50% involve the sacrum, 30% to 70% may calcify). Sagittal T1-weighted (B) and T2-weighted (C) and axial contrast-enhanced image (D) demonstrate extension of tumor from L1 to L2 with extension around the dural sac. |
Suggested Reading
Unni KK. Dahlin’s bone tumors: General aspects and data on 11,087 cases, 5th ed. Philadelphia: Lippincott-Raven; 1996.
P.112
Tumors and Tumorlike Conditions: Soft Tissue Masses
Key Facts
-
Soft tissue masses may reside in the
paraspinal soft tissues (including the retroperitoneum) or spinal
canal. The latter are categorized as extradural, intradural
extramedullary, or intramedullary. Table 3-7 summarizes common tumors in these locations. -
Paraspinal tumors
-
Some 17.2% of desmoid tumors involve the back.
-
Some 19% of liposarcomas occur in the retroperitoneum.
-
Leiomyosarcomas account for 5% to 10% of sarcomas. In women, 66% involve the retroperitoneum or vena cava.
-
Neuroblastoma is the third most common tumor in children; 50% occur before age 2 years.
-
-
Extradural tumors
-
Metastasis—most involve the thoracic region. Lung and breast are most common.
-
Soft tissue sarcomas in the paraspinal region may invade the extradural space.
-
-
Intradural extramedullary tumors
-
Meningiomas and neurogenic (neurolemmoma and neurofibroma) are most common.
-
Meningiomas—most common in thoracic region. Occurs more in females than males. They usually lie posterior to the cord.
-
Neurogenic—no site or sex predilection. Can be multiple. Sixteen percent
P.113
have an extradural component that extends through the neural foramen. This may be prominent and widen the foramen.TABLE 3-7 SOFT TISSUE TUMORSParaspinal Intradural Extramedullary Lipoma Meningioma Desmoid tumors Neurolemmoma Lymphangiomas Neurofibroma Liposarcoma Lipoma Leiomyosarcoma Intradural cysts Rhabdomyosarcoma Metastasis Neuroblastoma (50% <2 years of age) Paraganglioma Extradural Tumors Intradural Intramedullary Metastasis Ependymoma Lymphoma Astrocytoma Paraspinal sarcomas Hemangioblastoma Metastasis (uncommon)
-
-
Intradural intramedullary
-
Ependymoma: Most common, 62% of
intramedullary lesions. Common in conus and filum terminale. Typically
occurs in patients 30 to 60 years old, with no sex predilection. May
contain blood products. -
Astrocytoma: Second most common tumor.
Most common cord tumor in children. There is greater predilection for
upper cord and becomes less common caudally. Rare to find in filum
terminale.
-
P.114
 |
|
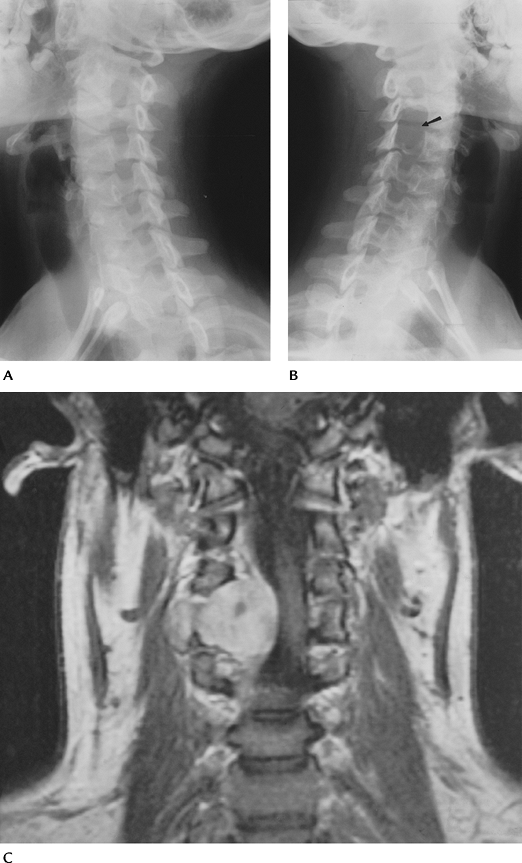
FIGURE 3-67 Neurofibroma. Oblique radiographs of the cervical spine show normal foramina in (A) and marked expansion in (B) (arrow). Coronal MR image (C) demonstrates a large neurofibroma extending through the foramen and displacing the cord.
|
P.115
 |
|
FIGURE 3-68 Ependymoma. (A) Proton density-weighted sagittal image shows a well-defined intradural mass separate from the conus (curved arrow). (B)
Large mass in a different patient arising from the filum terminale on enhanced T1-weighted image. There is a second smaller metastatic lesion (arrow) distally. |
Suggested Reading
Weiss SW, Goldblum JR. Enzinger and Weiss’s soft tissue tumors. 4th ed. St. Louis: Mosby; 2001.
Witte RJ, Lane JI, Miller GM, et al. Spine. In: Berquist TH. MRI of the musculoskeletal system. 5th ed. Philadelphia: Lippincott Williams & Wilkins; 2006:121–202.
P.116
Congenital Anomalies
Key Facts
-
Congenital spinal disorders include a spectrum of abnormalities.
-
Spinal dysraphism
-
Sacral anomalies
-
Caudal regression
-
Vertebral anomalies
-
Congenital scoliosis (Scoliosis; Basic Concepts)
-
Chiari malformation
-
-
Certain conditions may be diagnosed
radiographically. MRI is the technique of choice for noninvasive
evaluation of patients with suspected anomalies.
Congenital Anomalies: Spinal Dysraphism
Key Facts
-
Spinal dysraphism is a general term for incomplete midline fusion of osseous and neural structures.
-
Spina bifida is failure of vertebral fusion that may be occult or obvious, with skin defect and exposed neural elements.
-
Spina bifida occulta: No obvious skin
defect. Isolated posterior element fusion failure. More severe forms
may have spinal lipoma, diastematomyelia tethered cord (72% associated
with lipoma), or thickening of the filum terminale. -
Spina bifida aperta: Associated with meningocele, myelocele, meningomyelocele, and myelocystocele.
-
-
Normal conus should not extend below the
L3 interspace. The adult position (above the L2 interspace) is achieved
at several months of age. -
Normal filum terminale is 2 mm or less in thickness.
P.117
 |
|
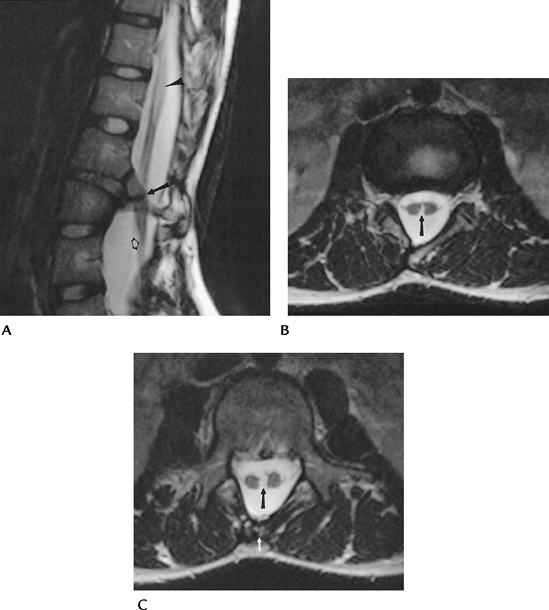
FIGURE 3-69 Diastematomyelia. Sagittal (A) and axial (B, C) fast SE T2-weighted images demonstrate diastematomyelia (arrow) with splitting of the cord at L2–L3. There is associated tethered cord with the tip (open arrow) at the conus at L4. There is also syringohydromyelia at T12–L1 (arrowhead) and spina bifida occulta at L5 (white arrow).
|
P.118
 |
|
FIGURE 3-70 Tethered cord with lipoma in a 14-month-old child. Sagittal T1-weighted image shows the conus as the L3 interspace (arrow) and an intraspinal lipoma (open arrows) that communicates with the subcutaneous fat.
|
Suggested Reading
Altman NR, Altman DH. MR imaging of spinal dysraphism. AJNR Am J Neuroradiol 1987;8:533–538.
P.119
Congenital Anomalies: Caudal Regression Syndrome
Key Facts
-
Caudal regression syndrome includes a
spectrum of disorders from minimal coccygeal absence to severe absence
of the distal spinal column, with anal atresia and malformed genitalia. -
Tethered cord, meningocele, myelocele, and meningomyelocele may be associated.
-
MRI is the technique of choice to evaluate the spectrum of abnormalities.
 |
|
FIGURE 3-71
Sacral agenesis. Sagittal fast SE T2-weighted image showing sacral and coccygeal agenesis with a tethered cord at L3–4 and central syringohydromyelia (arrow). |
Suggested Reading
Barkovich AJ, Raghavan N, Chuang S, et al. The wedge-shaped conus terminus: A radiographic sign of caudal regression. AJNR Am J Neuroradiol 1989;10:1223–1231.
P.120
Congenital Anomalies: Chiari Malformation
Key Facts
-
Chiari malformation is a complex congenital disorder of the hindbrain.
-
There are three categories of Chiari malformation.
-
Type I: Adult type. Inferior displacement
of cerebellar tonsils and sometimes the inferior vermis through the
foramen magnum. Syringomyelia may occur because of cerebrospinal fluid
flow obstruction. (By convention, tonsillar ectopia should be more than
5 mm inferior to a line drawn from the basion to the opisthion.)
Associated with Klippel-Feil anomalies. -
Type II: Also known as Arnold-Chiari
malformation childhood. Posterior fossa is small, with displacement of
tonsils, medulla, and vermis through an enlarged foramen magnum. The
cervicomedullary junction may appear kinked. Meningocele or
meningomyelocele and hydrocephalus are nearly always associated. -
Type III: More severe. Displacement of entire cerebellum into upper cervical or occipital encephalocele.
-
 |
|
FIGURE 3-72 Type I Chiari malformation. Sagittal T1-weighted MR image showing the cerebellar tonsils below the foramen magnum (short black arrow) with a large syrinx (double arrows). (From
Witte RJ, Miler GM. Spine. In: Berquist TH, ed. MRI of the musculoskeletal system. 4th ed. Philadelphia: Lippincott Williams & Wilkins; 2001:103–194.
) |
P.121
 |
|
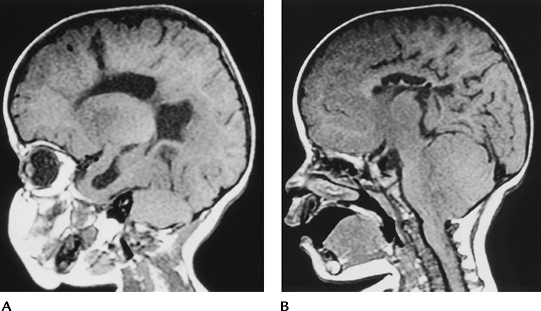
FIGURE 3-73 Type II Chiari malformation in a 14-month-old child. Sagittal T1-weighted images demonstrating hydrocephalus (A) with a small posterior fossa and downward herniation of the cerebellum and medulla (B).
|
Suggested Reading
El Gammal T, Marks EK, Brooks BS. MR imaging of Chiari II malformation. AJNR Am J Neuroradiol 1987;8:1037–1044.
P.122
Congenital Anomalies: Segmentation Anomalies
Key Facts
-
Segmentation anomalies of the vertebrae include hemivertebra, block vertebrae, and butterfly vertebrae. Scoliosis may result.
-
Vertebral body anomalies are detected on routine radiographs. MRI may be required to exclude other spinal anomalies.
 |
|
FIGURE 3-74 Butterfly vertebra. (A) AP radiograph of the spine demonstrating a butterfly vertebra at T10. (B) Axial CT image shows the midline segmentation of the vertebral body.
|
P.123
 |
|
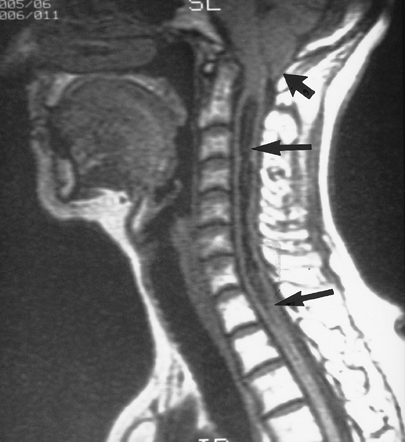
FIGURE 3-75 Klippel-Feil and Chiari Type I malformation. (A) Lateral radiograph of the cervical spine shows fusion of C2–C5. Sagittal T1-weighted (B) and T2-weighted (C) images in a different patient demonstrate approximately 15 mm of ectopia of the cerebellar tonsils through the foramen magnum (open arrows). Note the segmentation anomalies of C3–C5 (arrows) consistent with Klippel-Feil Syndrome and the basilar invagination (arrowhead).
|
Suggested Reading
Nokes SR, Murtagh FR, Jones JD III, et al. Childhood scoliosis. MR imaging. Radiology 1987;164:791–797.