MR Imaging of the Fingers
-
A 23-mm surface coil allows an 80 to 100 μm spatial resolution.2 When using a circular surface coil, the finger is placed through the coil to offer the maximum signal homogeneity. Larger coils, such as knee coils, may be necessary to image the whole wrist and hand for staging rheumatic diseases.
-
Ideally, the patient is placed in the prone position with the arm elevated. This puts the hand close to the center of the magnet to obtain efficient fat suppression. Full cooperation of the patient and efficient mechanical support with adhesive bandages are necessary. Some patients with painful (rotator cuff tears, multiple tendon calcifications) or frozen shoulders cannot maintain this position during the entire examination.
-
In all cases, finger immobility is necessary to avoid movement artifacts, which are particularly disturbing with high spatial resolution. Children younger than 6years of age usually cannot be examined in this manner.
-
Routine MR imaging of the finger is performed with axial images. This plane demonstrates mild partial volume artifact with 3- to 4-mm-thick slices and allows assessment of all the anatomic elements of the finger.
-
A complementary longitudinal plane image may be added, depending on the location of the suspected lesion.
-
Sagittal plane images are used to evaluate the extensor and flexor tendons, the volar plate, the pulleys, and the cartilage surfaces.
-
Coronal plane images are used to evaluate the collateral ligaments and osteochondral structures.
-
A field of view of 2 to 4 cm for axial images is the most useful. It provides a whole view of the finger section while maintaining a sufficient signal-to-noise ratio (SNR).
-
Routine examination includes axial T1-weighted spin-echo images and axial fast STIR or fat-suppressed fast spin-echo T2-weighted images, completed with a longitudinal sequence.
-
The T1-weighted spin-echo sequence clearly delineates the major structures of interest within the distal interphalangeal (DIP) joint.3
-
Fat suppression is necessary for T2-weighted images because of the large amount of fat in the subcutaneous tissue of the fingers.
-
The confidence level of a diagnosis may be improved in traumatic lesions by post-gadolinium fat-suppressed T1-weighted imaging. Contrast administration is also necessary to assess the vascularization of tumors and pseudotumors with or without MR angiography.
-
3D gradient-echo images are acquired when 1-mm-thick contiguous slices are necessary. However, small fields of view are limited with these sequences and multiplanar reformatting (MPR) is of poor quality because of the lack of isotropic acquisition.
-
3D post-gadolinium coronal sequences are acquired for MR angiography, with sequential acquisitions during the arterial and venous phases.4,5,6
-
Elliptical centric acquisitions improve the arterial phase by reducing the venous contrast.
 |
|
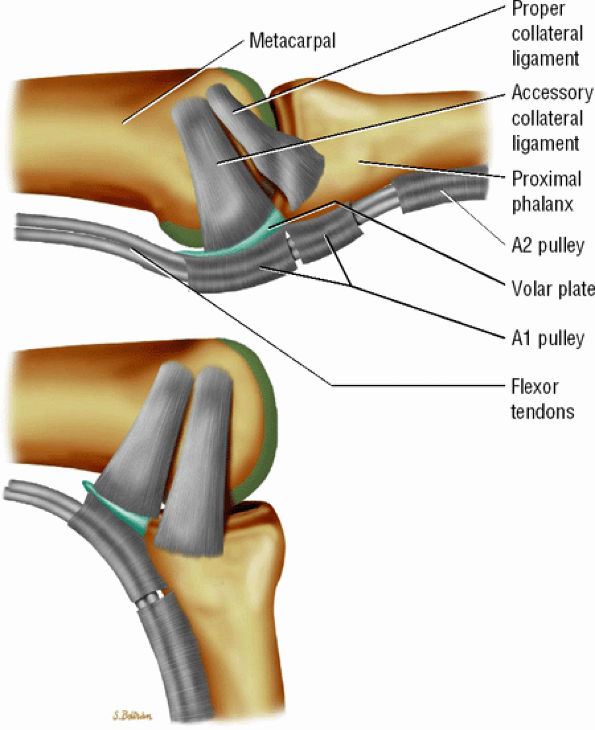
FIGURE 11.1 ● Capsular ligaments of the metacarpophalangeal joint. (A) Extension. The proper collateral ligament (PCL) is relaxed and the accessory collateral ligament (ACL) is under tension and limits extension. (B) Flexion. All ligaments are taut. The space between the A1 and A2 pulleys is narrowed.
|
-
The proper collateral ligament (PCL) originates from the dorsal side of the metacarpal head and extends
P.1849
obliquely and distally to insert onto a tubercle on the side of the base of the proximal phalanx. The radial PCL is stronger, and more oblique in its long axis, and its origin is a little closer to the articular surface than the ulnar PCL. -
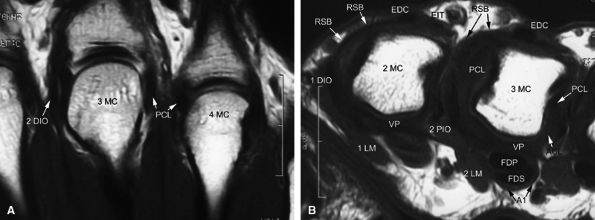
The accessory collateral ligament (ACL) has a common origin with the PCL and ends like a fan on the lateral side of the volar plate (Fig. 11.2). Some additional lateral stability is provided by the intrinsic tendons. This is especially important for the index finger (the first interosseous tendon on the radial aspect of the joint) and for the little finger (the abductor digiti minimi and flexor digiti minimi brevis on the ulnar side).
-
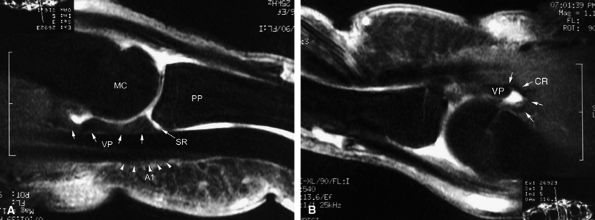
The volar plate is a fibrocartilaginous structure that becomes continuous with the articular surface on the palmar side (Fig. 11.3). The ACL is connected to the adjacent volar plate by the deep transverse metacarpal ligament. The volar plate is also connected to the flexortendon sheath (by the annular A1 pulley), strongly attached distally to the proximal phalanx, and loosely attached to the metacarpal neck by the checkreins.
-
The extensor hood, particularly the sagittal bands, stabilizes the MP joint and the extensor tendon during flexion (see Fig. 11.2).12
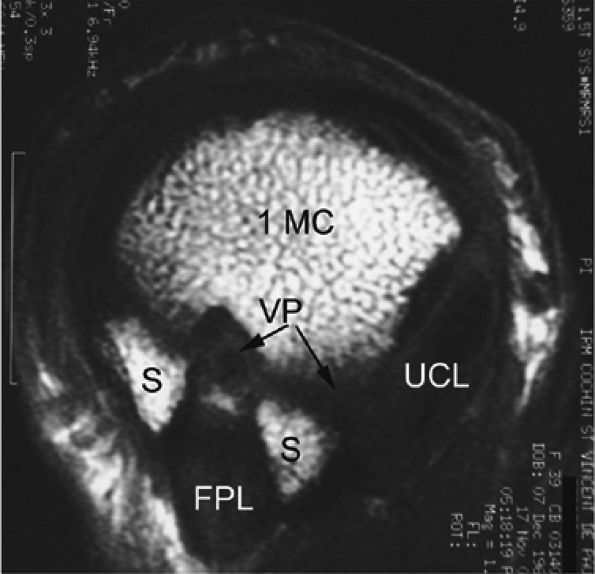
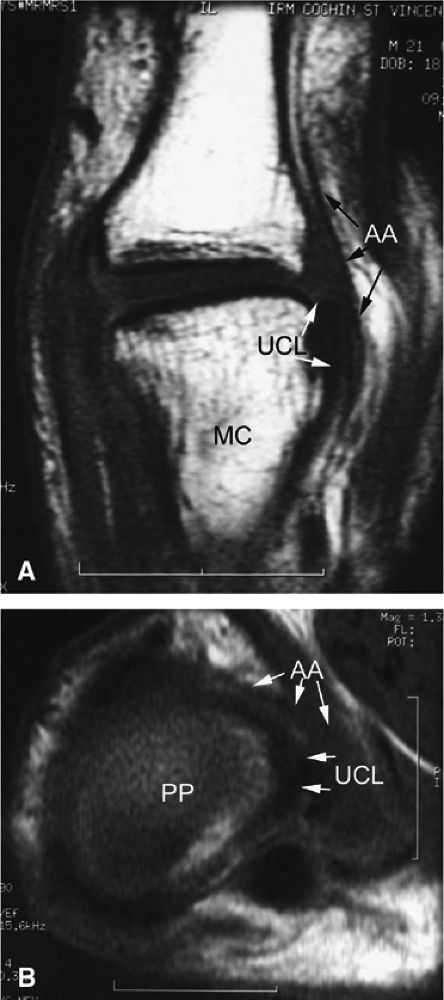
rotation. Stability is provided by the collateral ligaments, the volar plate, and musculotendinous elements. When the sesamoid bones are included in the volar plate, it is referred to as the volar complex (Fig. 11.4). On the medial aspect of the joint, the adductor pollicis is a strong insertion on the proximal phalanx and the volar plate, and contributes to the adductor aponeurosis. The ulnar collateral ligament (UCL) is covered dorsally by the adductor aponeurosis (Fig. 11.5).7,13
 |
|
FIGURE 11.2 ● Metacarpophalangeal joints. (A) T1-weighted coronal image. (B) T1-weighted axial image. The proper collateral ligament (PCL) is lax in extension and shows heterogeneous signal intensity on coronal and axial images. ACL, accessory collateral ligament; VP, volar plate; LM, lumbrical; DIO, dorsal interosseous; PIO, palmar interosseous; MC, metacarpal; RSB, radial sagittal band; EDC, extensor digitorum communis; EIT, extensor indicis proprius tendon; FDS, flexor digitorum superficialis tendon; FDP, flexor digitorum profundus tendon; A1, A1 annular pulley.
|
 |
|
FIGURE 11.3 ● The volar plate of the metacarpophalangeal joint. (A) Midline and (B) parasagittal post-enhancement fat-suppressed sagittal T1-weighted images. VP, volar plate; SR, synovial recess; MC, metacarpal; PP, proximal phalanx; A1, A1 annular pulley; CR, checkrein.
|
 |
|
FIGURE 11.4 ● Volar complex of the thumb. Axial T1-weighted images. Sesamoid bones (S) are incorporated into the volar plate (VP). FPL, flexor pollicis longus; UCL, ulnar collateral ligament; 1MC, first metacarpal.
|
 |
|
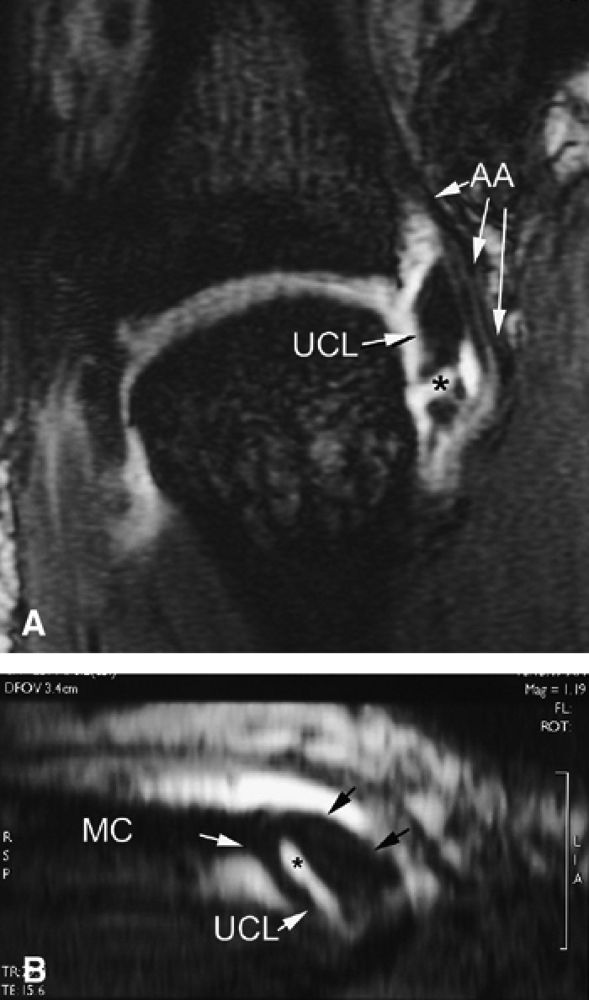
FIGURE 11.5 ● Coronal (A) and axial (B) T1-weighted images showing the ulnar collateral ligament (UCL) and adductor aponeurosis (AA). The UCL is deeper than the AA on axial images. On coronal images, the oblique AA is often more visible distal to the UCL. MC, metacarpal; PP, proximal phalanx.
|
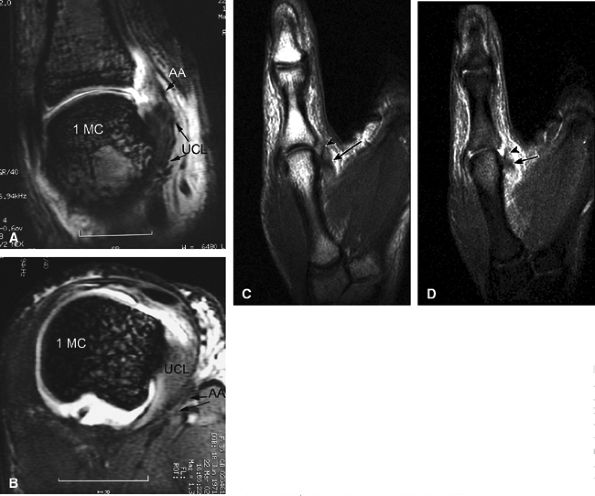
maneuvers alone a nondisplaced lesion may be misdiagnosed as a displaced one, and both ultrasonography and MR imaging may be useful (optimally before 2 weeks) in making the diagnosis.16 MR imaging and MR arthrography are both accurate in the detection of a Stener's lesion.15,17,18,19 Coronal fast spin-echo T2-weighted images are the most informative.20,21 The identification of a displaced versus a nondisplaced ligament is not straightforward, and a spectrum of UCL injuries may be depicted. Differentiation is more difficult in chronic lesions.20,22 Characteristic MR findings include the following:
-
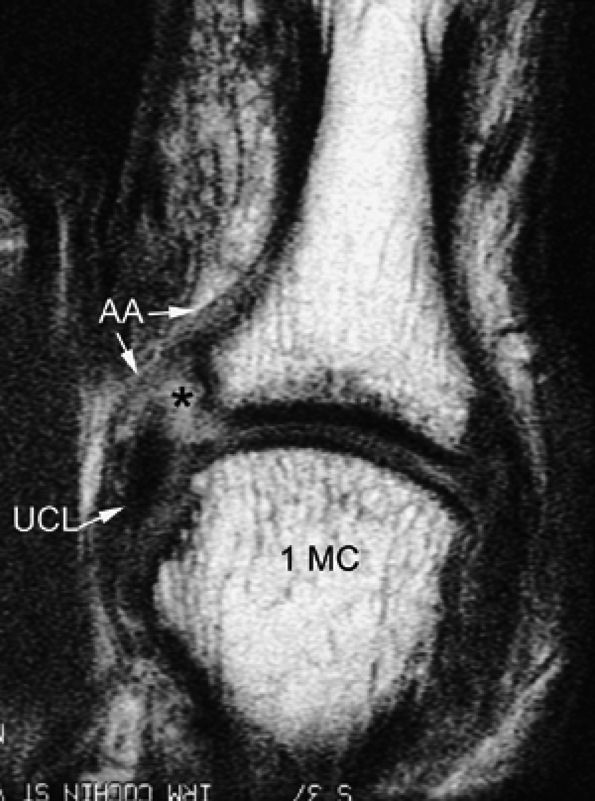
The UCL lies deep to the overlying low-signal adductor aponeurosis on coronal images (Figs. 11.7 and Fig. 11.8). In a nondisplaced partial or complete tear of the UCL, the ligament appears thickened all along its course, sometimes with a small gap. When displaced, the UCL appears as a proximally retracted round or stump-like structure, which demonstrates low signal on all sequences. It is no longer parallel to the long axis of the thumb and presents an increased horizontal orientation.
-
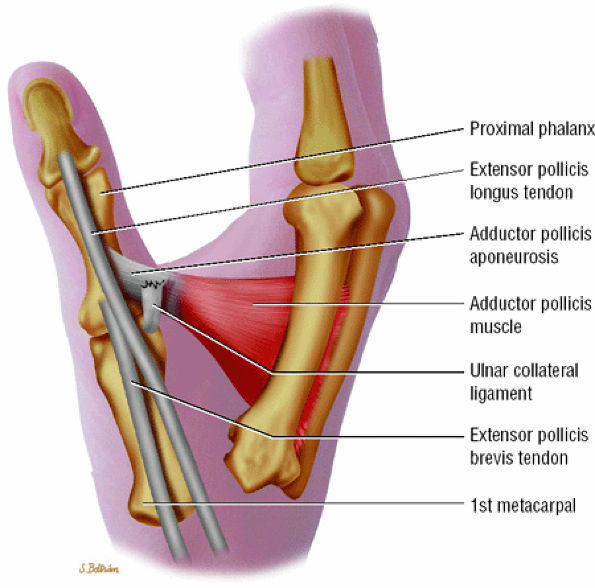
Stener's lesion may present with a “yo-yo on a string” pattern, with the retracted and balled-up UCL representing the yo-yo and the more distal linear adductor aponeurosis representing the string (Fig. 11.9).
-
On axial images, the ligament may be seen lying above or intersecting the adductor aponeurosis.
 |
|
FIGURE 11.6 ● Stener's lesion. The ulnar collateral ligament (UCL) is torn from its distal insertion and the proximal end passes over the expansion of the adductor pollicis aponeurosis and cannot heal.
|
 |
|
FIGURE 11.7 ● Coronal post-contrast T1-weighted image showing a nondisplaced tear of the UCL of the first metacarpophalangeal joint (MP) joint. The torn UCL is elongated beneath the adductor aponeurosis (AA). There is focal enhancement of the tear (asterisk). 1 MC, first metacarpal.
|
 |
|
FIGURE 11.8 ● MR arthrography of nondisplaced tear of the UCL of the first MP joint. Coronal (A) and sagittal multiplanar reformatted (MPR) (B) T1-weighted fat-suppressed 3D gradient-echo images showing an oblique tear (asterisk) of the UCL without avulsion. Thearrows mark the distal (black) and proximal (white) aspects of the torn UCL. The sagittal MPR slice is defined along the course of the UCL. MC, metacarpal; AA, adductor aponeurosis.
|
-
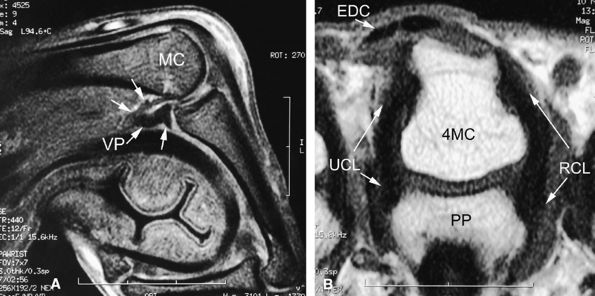
The collateral ligaments are taut and visible all along their course (Fig. 11.12).28,29,30,31
-
Stress imaging also allows assessment of the stability of the extensor tendon.28 When injured, the ligament appears thickened all along its course, but the presence of fluid in a tear is uncommon in chronic lesions.
-
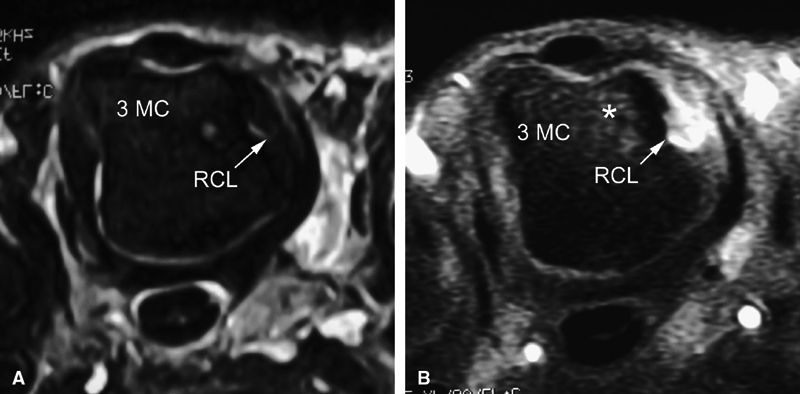
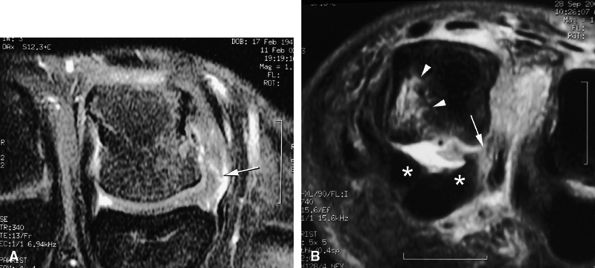
Intravenous injection of gadolinium may increase image contrast, making it possible to visualize small ligament tears (Fig. 11.13).10 Tears may involve the distal or proximal insertion or the middle third of the ligament (Figs. 11.13 and Fig. 11.14).
-
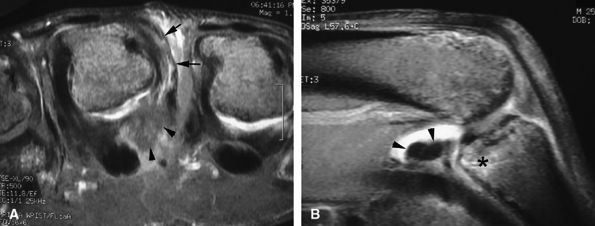
MR imaging also depicts common associated lesions (extensor hood, volar plate) in more than 40% of cases (Fig. 11.15).10
 |
|
FIGURE 11.9 ● MR of Stener's lesions. MR arthrograms. Coronal (A) and axial (B) T1-weighted fat-suppressed 3D gradient-echo images. The UCL is retracted proximally with a mildly horizontal orientation. The adductor aponeurosis (AA) is partially beneath the UCL. 1 MC, first metacarpal. A more classic Stener's lesion depicted on a coronal proton density-weighted image (C) and a fat-suppressed coronal proton-density weighted image (D), which demonstrate the UCL (arrow) torn from its distal attachment and extending perpendicular to the first ray. The adductor aponeurosis (arrowhead) is seen as a linear structure distal and deep to the torn and retracted UCL.
|
 |
|
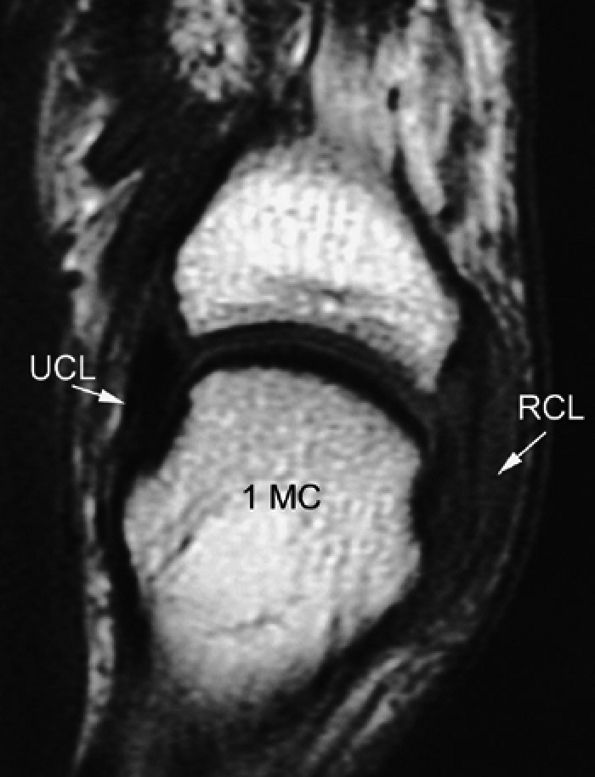
FIGURE 11.10 ● Coronal T1-weighted image showing an injury of the radial collateral ligament (RCL) of the first MP joint. The RCL demonstrates increased signal intensity and thickening all along its course.
|
 |
|
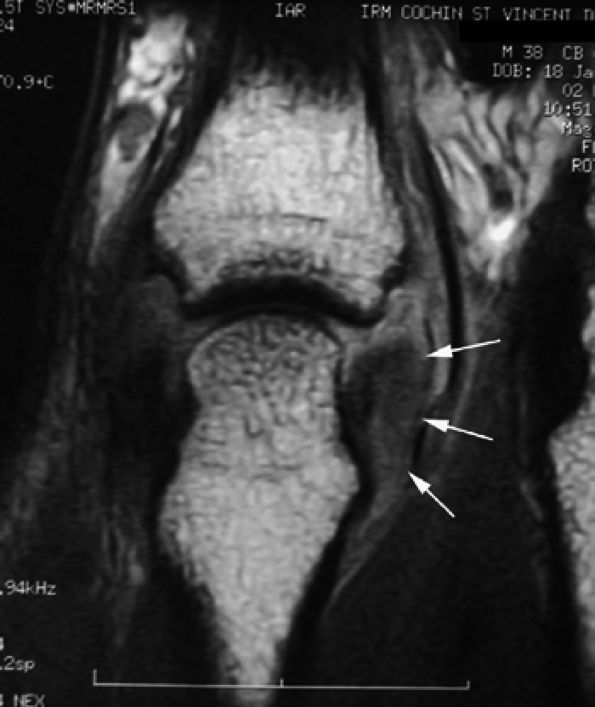
FIGURE 11.11 ● Tear of the radial collateral ligament (RCL) of the fifth metacarpophalangeal joint is shown on this coronal post-contrast T1-weighted image. The distal insertion of the RCL is proximally retracted and thickened (arrows).
|
 |
|
FIGURE 11.12 ● Stress MR examination with flexion of the metacarpophalangeal joint. (A) Sagittal fat-suppressed T1-weighted and (B) axial fast spin-echo T2-weighted images show the taut radial and ulnar collateral ligaments (RCL and UCL), which are seen along their course with a low signal. The stability of the extensor digitorum communis (EDC) tendon can also be assessed on these images. The volar plate (VP) is lax. MC, metacarpal; PP, proximal phalanx.
|
 |
|
FIGURE 11.13 ● Proximal tear of the radial collateral ligament (RCL) of the third metacarpophalangeal joint. Comparison of axial STIR (A) and post-contrast fat-suppressed T1-weighted image (B). Focal irregularity and slight hyperintensity of the RCL can be seen on the STIR image. Strong enhancement of the proximal part of the RCL and bone edema (asterisk) is seen on the T1-weighted images. MC, metacarpal.
|
 |
|
FIGURE 11.14 ● Collateral ligament tear of the metacarpophalangeal joint. Axial post-contrast fat-suppressed T1-weighted images with flexion of the joint. (A) Tear of the middle third of the ligament (arrow). (B) Distal tear (arrow) with a slight tilt of the volar plate (asterisks). There is associated contralateral bone edema of the metacarpal head (arrowhead).
|
 |
|
FIGURE 11.15 ● Axial (A) and sagittal (B) post-contrast fat-suppressed T1-weighted images display associated injuries of the ulnar collateral ligament (arrows) of the third metacarpophalangeal joint and the volar plate (arrowheads). Bone edema (asterisk) of the base of the proximal phalanx at the distal insertion of the volar plate can be seen.
|
-
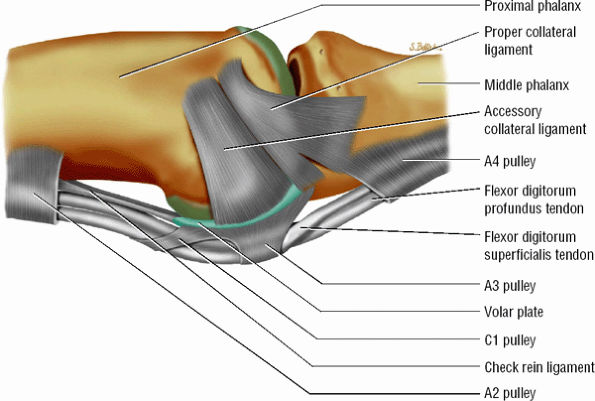
The collateral ligament complex is composed of a PCL and an ACL, both of which originate from the dorsolateral aspect of the head of the proximal phalanx; they insert on the laterovolar aspect of the base of the middle phalanx and the volar plate, respectively.
-
The triangular shape of the PCL, with the vertex proximally located and the base distally located, predisposes its fibers, which are 2 to 3 mm thick, to be under constant tension. The dorsal components are under tension when the PIP is flexed, the palmar components when the joint is extended.
-
The most palmar component of the PCL has a partial attachment on the border of the volar plate in continuity with the ACL (Fig. 11.16).33
-
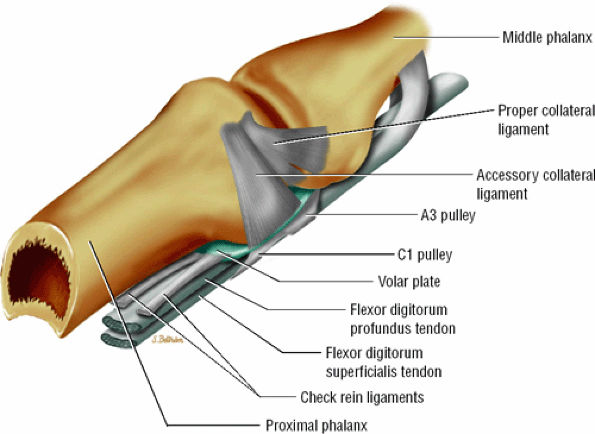
The volar plate reinforces the palmar aspect of the joint capsule and prevents hyperextension of the PIP joint. Its distal attachment to the base of the middle phalanx is thick, whereas its proximal attachment is divided in two U-shaped checkreins (Fig. 11.17).34
-
The extensor tendon complex stabilizes the PIP joint dorsally. The central slip inserts onto the dorsal tubercle of the base of the middle phalanx and is connected to the two lateral bands of the extensor tendon by retinacular ligaments (Landsmeer's oblique and transverse bands) (Fig. 11.18).
-
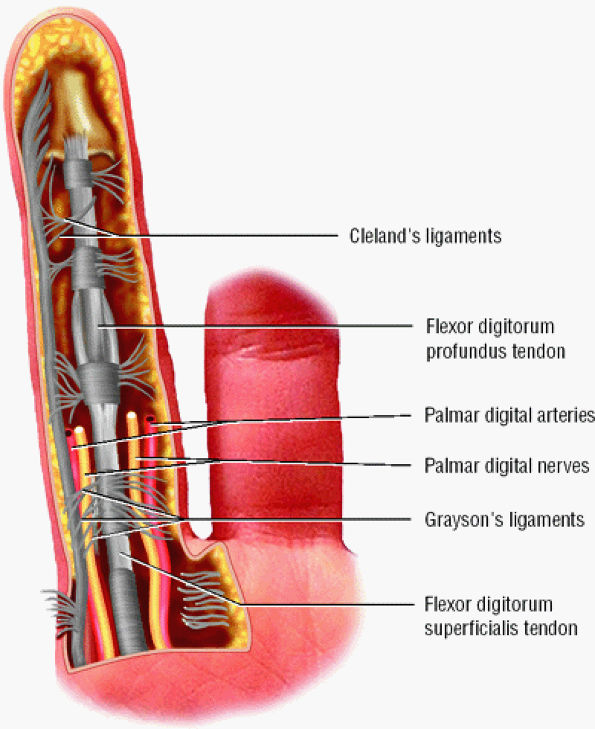
A complex retinacular apparatus includes the Landsmeer'sligament and cutaneous ligaments (Cleland's and
P.1856
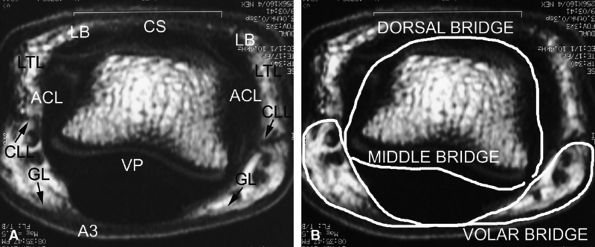
Grayson's ligaments) (Fig. 11.19). It delineates three compartments (dorsal, volar, and laterovolar), forming three bridges (see Fig. 11.18). The dorsal bridge includes the median slip and the lateral bands of the extensor tendon, the Landsmeer's transverse ligament and the ACL. The volar plate constitutes the middle bridge. The volar bridge is formed from the annular A3 pulley, and Cleland's and Grayson's ligaments.
 |
|
FIGURE 11.16 ● Capsular ligaments of the proximal interphalangeal joint. The proper collateral ligament inserts on the base of the middle phalanx and partially on the volar plate. The accessory collateral ligament inserts on the lateral aspect of the volar plate and flexor tendon sheath.
|
 |
|
FIGURE 11.17 ● Oblique view of the volar plate. The proximal volar plate inserts with the checkrein ligaments on each side of the flexor tendon sheath close to the distal fibers of the A2 pulley.
|
 |
|
FIGURE 11.18 ● (A) Axial T1-weighted images showing the retinacular apparatus at the level of the PIP joint. The dorsal bridge consists of the central slip (CS) and the lateral bands (LB) of the extensor tendon, Landsmeer's transverse ligament (LTL), and the accessory collateral ligament (ACL). The middle bridge consists of the volar plate (VP). The volar bridge consists of the A3 annular pulley (A3) and Cleland's and Grayson's ligaments (CLL and GL). (B) The finger is divided into a dorsal compartment with the PIP joint, a volar compartment with the flexor tendons, and two laterovolar compartments with the proper digital neurovascular bundles.
|
 |
|
FIGURE 11.19 ● The cutaneous (Grayson's and Cleland's) ligaments. On this palmar view of the little finger, the ligaments are interlaced transverse and oblique fibers of connective tissue coursing between the skin and the flexor tendon sheath.
|
-
Ligamentous sprain without joint instability
-
Partial tear with laterolateral instability
-
Complete tear with major instability or dislocation, which may be associated with a distal avulsion of the volar plate
-
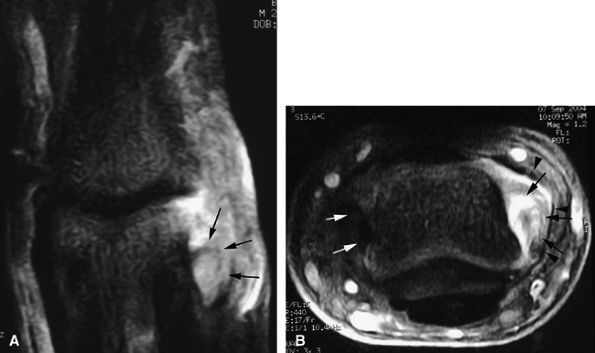
Thickening and intraligamentous signal abnormalities, periligamentous edema and swelling, discontinuity, detachment, and bone edema are seen at the insertion site (Fig. 11.20).
-
Joint fluid leakage is uncommon and visible only in acute injuries.
-
In chronic injuries, the ligament is often continuous but thickened by scar tissue. Sometimes the ligament is thinned or demonstrates a wavy pattern.
 |
|
FIGURE 11.20 ● Acute injury of the radial collateral ligament (RCL) of the PIP joint of the fourth finger. Coronal (A) and axial (B) post-contrast fat-suppressed T1-weighted images displaying distal avulsion of the RCL with a proximal retraction (black arrows). The retinacular apparatus is displaced (arrowheads) with periligamentous edema. The ulnar collateral ligament is also identified (white arrows).
|
-
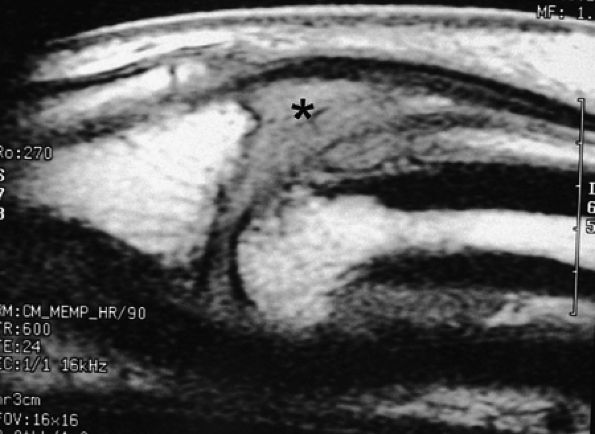
Grade 1. Grade 1 injuries with distal avulsion of the volar plate from the base of the middle phalanx are relatively common, with a natural outcome of hyperextension of the PIP joint (swan neck deformity). Proximal avulsion of the checkreins is less common and may produce a pseudoboutonnière deformity with integrity of the extensor tendon.8 MR examination highlights volar plate injuries, depicting a range of findings from a simple thickening and blurring, to elongation and irregularities, to a complete rupture (Fig. 11.21).
P.1858
Sagittal and axial plane images are complementary. The normal synovial recess at the distal insertion of the volar plate must not be confused with a tear (see Fig. 11.3). The volar plate is also easy to assess with ultrasonography, which allows a useful dynamic study with flexion-extension of the joint. -
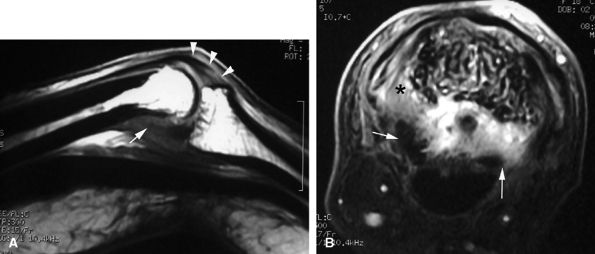
Grade 2: In grade 2, the volar plate injury extends toward the collateral ligaments and dorsal subluxation produces more severe instability. MR images may reveal detachment of the collateral ligament from the volar plate, which causes volar plate tilting (Fig. 11.22).
-
Grade 3: Grade 3 represents fracture–dislocation of the distal attachment of the volar plate. A fragment involving less than 40% of the articular surface with integrity of the collateral ligament attachment is a stable injury. A larger bony fragment involving the volar plate and the collateral ligament insertions is unstable, producing dorsal subluxation.
 |
|
FIGURE 11.21 ● Sagittal T1-weighted images at the site of a volar plate injury of the PIP joint. The volar plate is absent. Note the associated injury of the dorsal capsule, which appears thickened (asterisk).
|
 |
|
FIGURE 11.22 ● Associated injuries of the volar plate and a collateral ligament of the PIP joint. (A) Sagittal T1-weighted and (B) axial post-contrast fat-suppressed T1-weighted images show proximal injury of the checkreins of the volar plate with associated synovitis (white arrows). Continuity of the central slip of the extensor tendon is seen (arrowheads), and there is a tear of the radial collateral ligament (asterisk).
|
-
Large fields of view may be necessary because tendon retraction is often extensive.
-
Examination with the surface coil in two different locations is sometimes required.
-
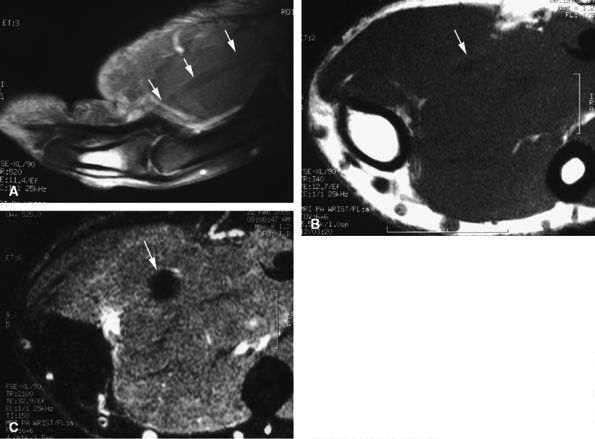
Axial and sagittal T1-weighted image or fat-suppressed proton density-weighted images may be sufficient to assess the tendon injury.43 However, when a short echo time (TE) is used, these sequences are subject to the magic angle phenomenon, which is most noticeable when the flexor or extensor tendon approaches an angle of 55 degrees with the B0 magnetic field. The magic angle phenomenon appears as increased intratendinous signal intensity that is present on all image planes and that decreases when TE values are lengthened.44 This artifact is relatively easy to recognize and typically occurs in areas such as the terminal band of the extensor tendon, the periarticular course of the flexor digitorum tendons, and the flexor pollicis longus in the thenar eminence (Fig. 11.23). In doubtful cases an additional T2-weighted sequence should be acquired.
-
Sagittal 3D gradient-echo sequences allow oblique reformats along the long axis of the tendons. These images are also subject to the magic angle phenomenon and to magnetic susceptibility artifacts due to micrometallic deposits from suture placement.45
 |
|
FIGURE 11.23 ● Magic angle phenomenon. The flexor pollicis longus tendon (arrows) with high signal intensity with short TE sequences on all imaging planes, as seen on (A) a sagittal fat-suppressed T1-weighted image and (B) an axial T1-weighted image. (C) On images with long TEs or STIR images, the signal of the tendon becomes normal.
|
-
the extensor digitorum communis (EDC)
-
the extensor indicis proprius (EIP)
-
the extensor digiti quinti minimi (EDQM)
-
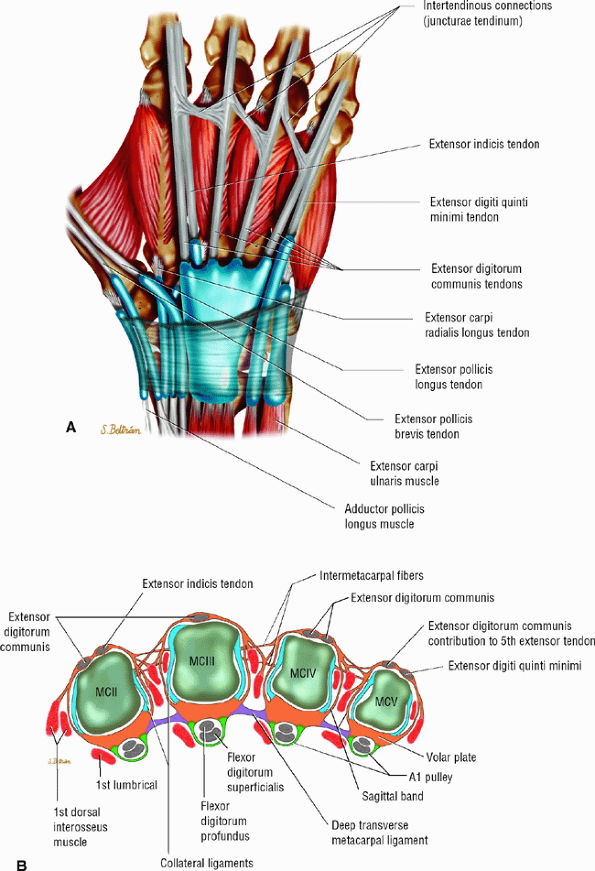
The juncturae tendinum (usually lacking for the extensor indicis tendon) connect the extensor tendons at the midpart of the metacarpals, preventing independent extension of the fingers (Fig. 11.25).46
-
In the most common configuration, the EDC provides one tendon to the index finger, one to the middle finger, two to the ring finger, and none to the little finger.47 The EIP tendon exhibits one tendon, whereas the EDQM exhibits two tendons (see Figs. 11.2 and Fig. 11.25). The EIP may be absent and the EDQM may provide a tendon slip to the ring finger.
-
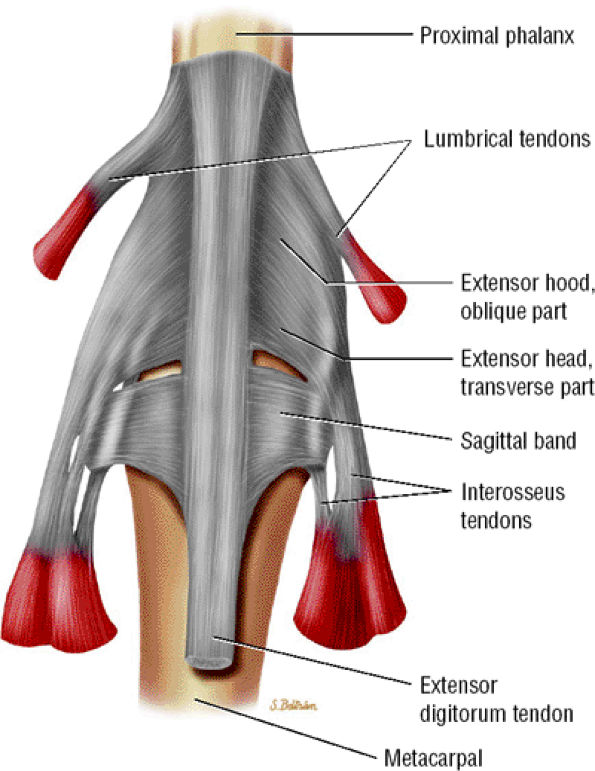
The tendons are stabilized on the dorsal aspect of the MP joint by the extensor hood, the main elements of which are the sagittal bands. The radial and ulnar sagittal bands surround the extensor tendon and extend volarly toward the volar plate, coursing superficially to the collateral ligaments (see Figs. 11.2 and Fig. 11.25; Fig. 11.26). The sagittal bands also appear to envelop the superficial interosseous tendons on both sides.12 They glide with the extensor apparatus, and the orientation of their fibers changes as the finger moves.48
-
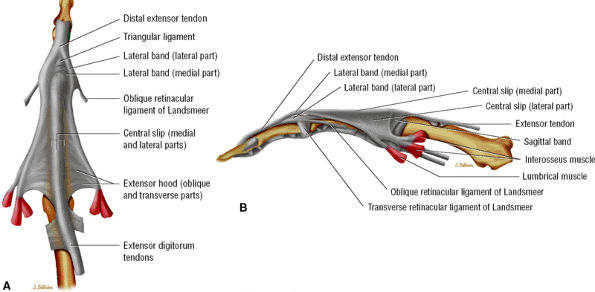
The extensor tendon provides the central slip and the lateral bands (Fig. 11.27). The intrinsic tendons contribute to the lateral bands primarily, and to a lesser degree to the central slip.
-
The central slip inserts on the dorsal tubercle of the base of the middle phalanx. Once the lateral band receives its intrinsic contribution, it becomes a conjoint tendon and converges distally to form the terminal tendon with the contralateral band on the base of the distal phalanx.
-
The triangular ligament joints the two conjoint tendons and maintains them dorsal to the rotational axis of the PIP joint (see Fig. 11.27).
-
The tendons of the extensor apparatus are connected by the retinacular ligament (Landsmeer's ligament) at the level of the PIP joint and the middle phalanx (see Fig. 11.18).
 |
|
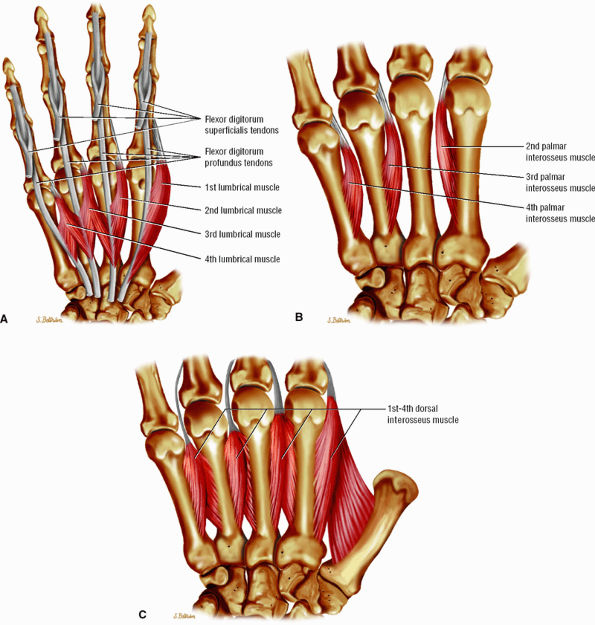
FIGURE 11.24 ● Intrinsic muscles of the hand. (A). Palmar view of the most common configuration of the lumbrical muscles. (B) Palmar view of the palmar interossei muscles. (C) Palmar view of the dorsal interossei muscles.
|
 |
|
FIGURE 11.25 ● Extensor tendons and their interconnections (juncturae tendinum). (A) Dorsal aspect and (B) axial image at the metacarpal heads. The most common configuration is presented. The extensor indicis tendon (EIT) lacks a junctura tendinum.
|
 |
|
FIGURE 11.26 ● Extensor hood and sagittal bands. Dorsal aspect.
|
 |
|
FIGURE 11.27 ● Extensor apparatus of the finger. (A) Dorsal aspect and (B) radial aspect.
|
|
TABLE 11.1 ● Zone Classification of Extensor Tendon Injuries
|
||||||||||||||
|---|---|---|---|---|---|---|---|---|---|---|---|---|---|---|
|
-
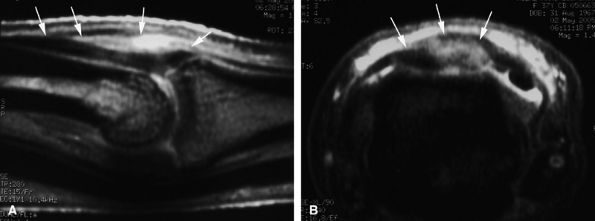
A partial tendon laceration appears as a thickened continuous tendon on sagittal and axial images, with partial intratendinous signal abnormalities. In evaluation of acute soft tissue injury associated with edema, T2-weighted and post-gadolinium-enhanced T1-weighted images are important (Fig. 11.28).
-
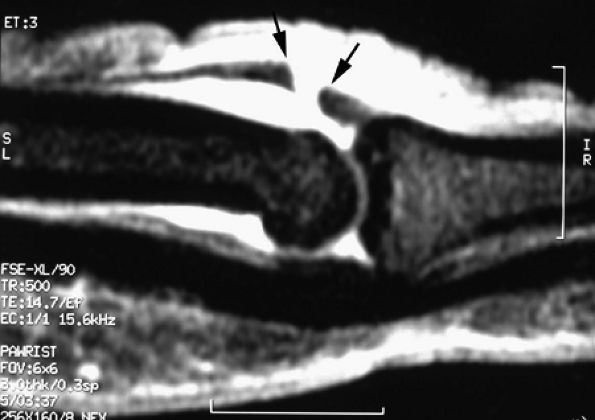
A complete laceration is highlighted by a tendinous gap, and the tendon ends are usually irregular, with some fraying. The length of the gap can be measured on sagittal images (Fig. 11.29). Tendon retraction is usually limited due to the numerous retinacular connections.50
 |
|
FIGURE 11.28 ● Open wound with partial laceration of the central slip of the extensor tendon. (A) Sagittal post-contrast fat-suppressed T1-weighted and (B) axial STIR images show that the tendon (arrows) is continuous but thickened and demonstrates partial signal abnormalities.
|
 |
|
FIGURE 11.29 ● Sagittal post-contrast fat-suppressed T1-weighted image displaying an open wound with complete tear of the central slip of the extensor tendon. There is a tendinous gap (arrows) close to the insertion of the central slip on the base of the proximal phalanx. The tendon retraction is minimal.
|
 |
|
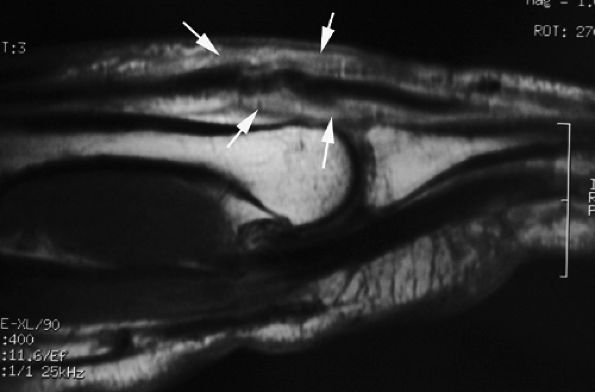
FIGURE 11.30 ● Sagittal post-contrast T1-weighted image showing complications of an open wound of the extensor tendon with adhesions. There is enhancement of peritendinous scar tissue around the tendon (arrows). The extensor tendon shows a loss of tension.
|
central slip and a lateral band of the extensor tendon may occur in cases of additional rotational trauma. Chronic symptomatic lesions require surgical reconstruction.55,57
 |
|
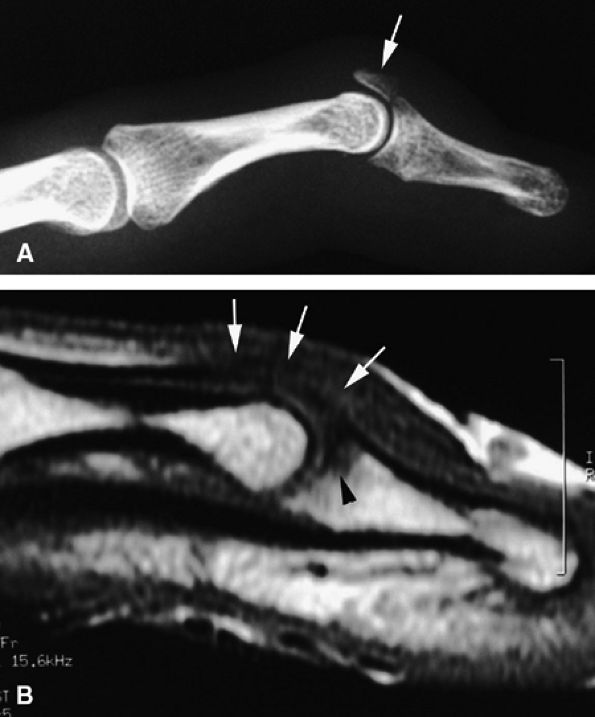
FIGURE 11.31 ● Mallet finger. (A) Fracture avulsion (arrow) of the base of the distal phalanx (lateral view). (B) Sagittal T1-weighted images in a different case showing a tear of the terminal band of the extensor apparatus (arrows) with thickening of soft tissues. There is bone edema (arrowhead) of the base of the distal phalanx without fracture.
|
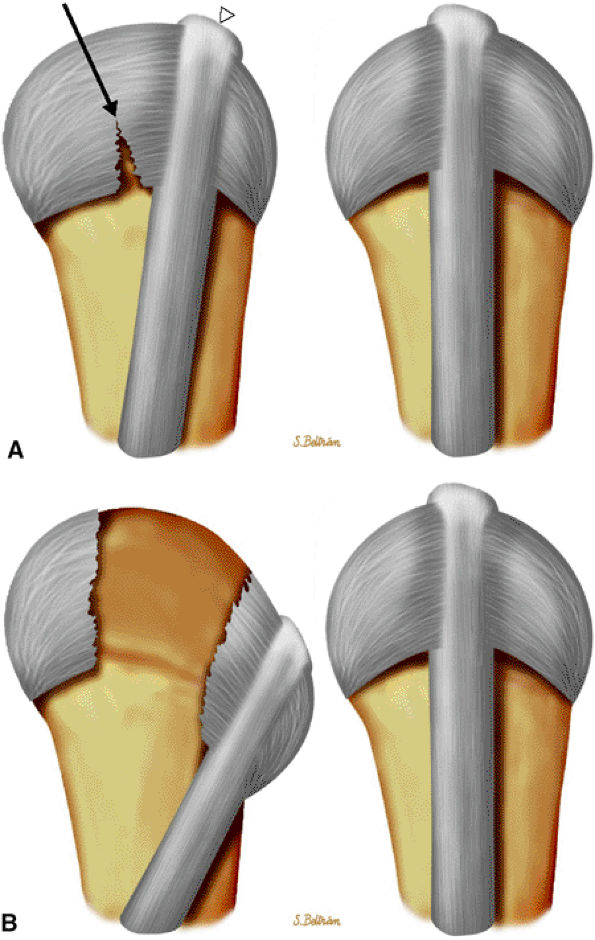
subluxation or dislocation of the EDC tendon. The mechanism of injury may be a direct blow with forced flexion and an ulnar deviation of the finger (boxer's knuckle).53,59 The middle and little fingers are most frequently involved, and the radial sagittal band is usually injured with an ulnar subluxation of the tendon (Fig. 11.36). The retinaculum between the two extensor tendons of the little finger may also be injured, and stress imaging depicts a diastasis between these tendons.60 The degree of tendon instability is determined by the extent of sagittal band disruption. A proximal rather than distal tear of the sagittal band contributes to instability (see Fig. 11.36).48 An associated dorsal capsular tear is also possible.60 Patients present with pain and swelling of the dorsal aspect of the MP joint and an inability to completely extend the joint. In neglected injuries the patient reports multiple episodes of pain and swelling with a painful snapping during flexion of the MP joint. Treatment of acute injuries remains controversial, but in general splinting of the extended joint is more often indicated than a simple suture.61 Chronic symptomatic lesions require surgical reconstruction.
 |
|
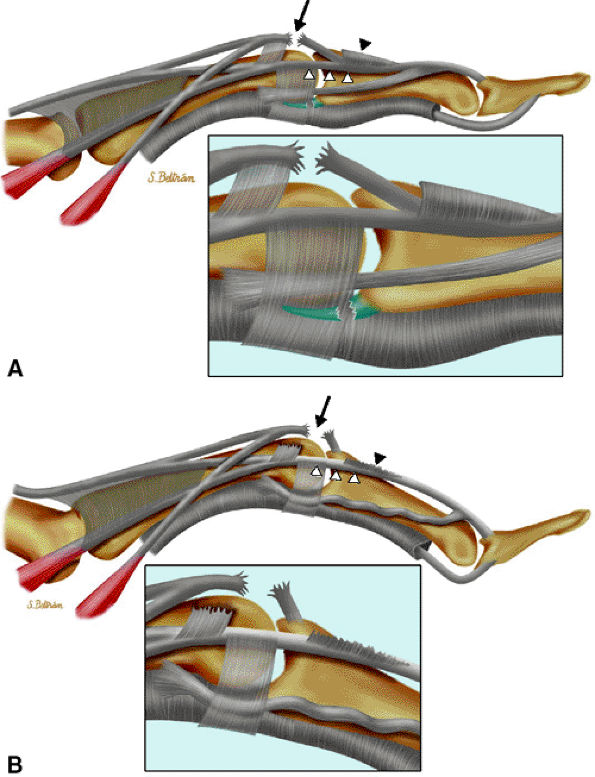
FIGURE 11.32 ● Boutonnière deformity. (A) Injury of the central slip (black arrow). The lateral bands (white arrowheads) keep their normal position if the triangular ligament, connecting the two lateral bands, is partially preserved (black arrowhead). (B) There is palmar dislocation of the lateral bands (white arrowheads) if the triangular ligament is torn. Herniation of the PIP joint and boutonnière deformity can be seen.
|
 |
|
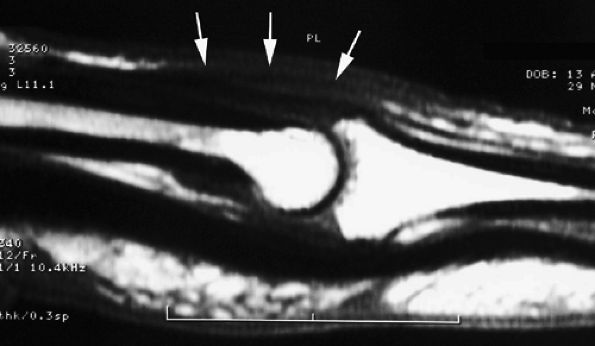
FIGURE 11.33 ● Sagittal T1-weighted image illustrating elongation of the central slip of the extensor tendon. The thickened continuous tendon (arrows) can be seen close to its insertion on the base of the middle phalanx.
|
 |
|
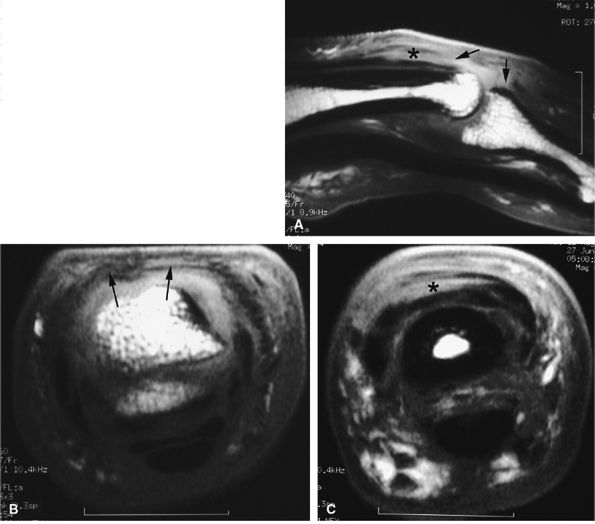
FIGURE 11.34 ● Complete rupture of the central slip of the extensor tendon on sagittal (A) and axial post-enhanced T1-weighted images at the level of the PIP joint space (B) and the distal third of the proximal phalanx (C). There is distal avulsion of the central slip with a tendon gap (arrows) and limited retraction. The proximal end is thickened and shows signal heterogeneity (asterisk).
|
 |
|
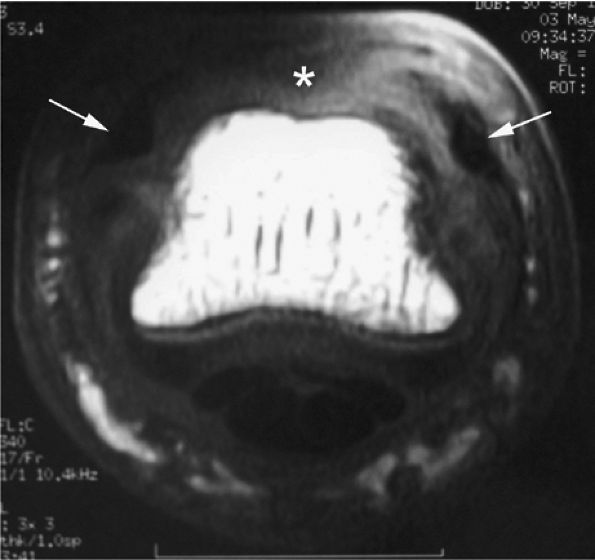
FIGURE 11.35 ● Boutonnière deformity. Axial T1-weighted image showing a tear of the central slip (asterisk) and palmar subluxation of the lateral bands of the extensor tendon (arrows).
|
 |
|
FIGURE 11.36 ● Injury of the radial sagittal band (arrow) with ulnar subluxation of the extensor tendon (arrowhead). The degree of tendon instability is determined by the extent of sagittal band disruption. (A) In a partial tear, a proximal tear rather than a distal tear of the sagittal band contributes to instability. (B) In a complete tear, there is dislocation of the extensor tendon into the intermetacarpal space.
|
 |
|
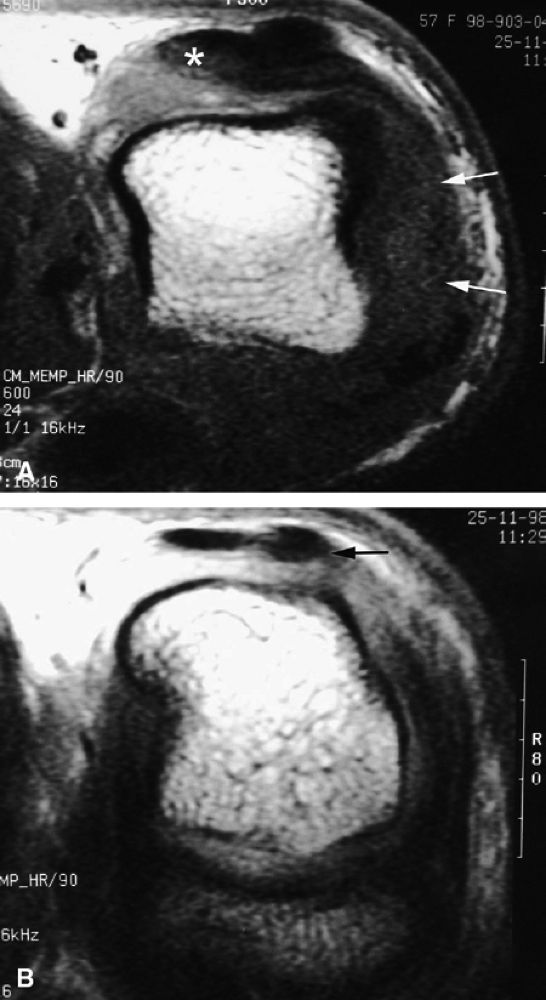
FIGURE 11.37 ● Partial tear of the ulnar sagittal band of the index finger. (A) Axial post-contrast T1-weighted images show focal thickening and blurring of the sagittal band close to the extensor tendon (asterisk). Injury of the radial collateral ligament is also seen (arrows). (B) Axial post-contrast stress T1-weighted image with flexion of the metacarpophalangeal joint demonstrates only a slight subluxation of the tendon (arrow).
|
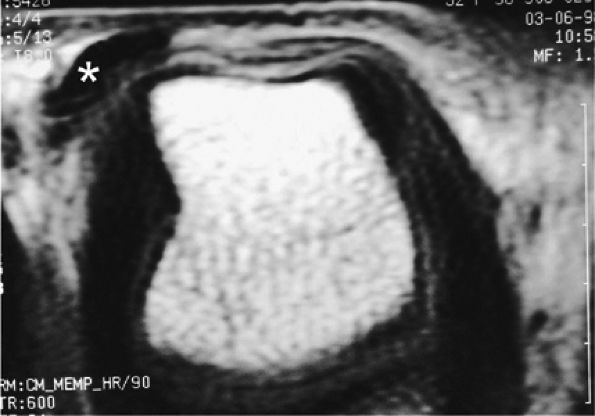
when the tendon dislocates on stress images (Figs. 11.38 and Fig. 11.39). Congenital hypoplasia of a sagittal band may be misleading in the middle finger but is not associated with edema and thickening of the soft tissues (see Fig. 11.39).64
 |
|
FIGURE 11.38 ● Axial stress T1-weighted image of a complete tear of the radial sagittal band. The tear is difficult to detect, but the extensor tendon dislocates in the intermetacarpal space (asterisk).
|
 |
|
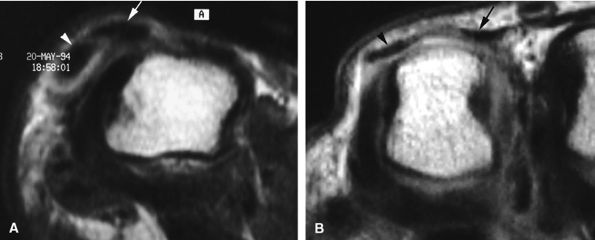
FIGURE 11.39 ● Complete tear of a sagittal band of the little finger. Two different types of injuries are illustrated. (A) In a tear of the radial sagittal band, the extensor digitorum communis (arrow) and the extensor digiti minimi tendon (arrowhead) dislocate together on the ulnar side (axial stress T1-weighted image). (B) A tear of the retinaculum connecting the two extensor tendons, extensor digiti minimi, and extensor digitorum communis (arrowhead and arrow). Axial stress T1-weighted image highlights a large diastasis between the tendons.
|
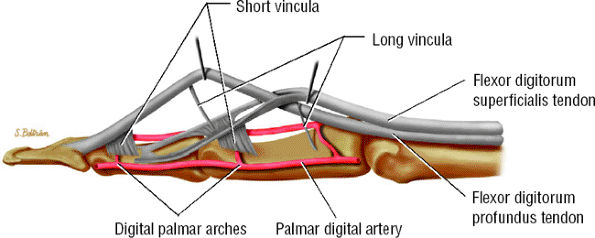 |
|
FIGURE 11.40 ● Lateral aspect of the flexor digitorum tendons and their vascular supply.
|
sheath to the tendons and provide the blood supply (see Fig. 11.40).38 The floor of the canal is composed of the volar aspect of the phalanges and the volar plates. The fibrous roof is composed of the five annular pulleys (A1–A5) and the three cruciform pulleys (C1–C3) (Fig. 11.42).65,66,67,68,69
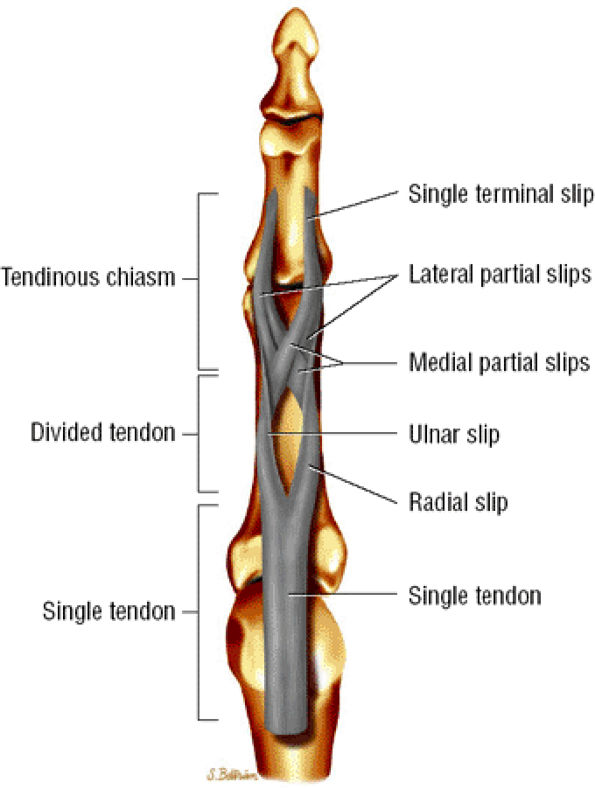 |
|
FIGURE 11.41 ● Flexor digitorum superficialis tendon, palmar aspect. A single tendon courses to the proximal third of the proximal phalanx. The tendon then splits into radial and ulnar slips that continue in spirals and diverge to either side. At the distal third of the proximal phalanx, the ulnar and radial slips divide into lateral and medial partial slips. The medial partial slips cross toform the tendon chiasm and to unite with the contralateral lateral partial slip.
|
 |
|
FIGURE 11.42 ● Lateral view in extension of the pulley system of the digital flexor tendon sheaths. The flexor tendons undulate along the palmar aspect of the bones of the finger.
|
|
TABLE 11.2 ● Zone Classification of Flexor Tendon Injuries
|
||||||||||
|---|---|---|---|---|---|---|---|---|---|---|
|
-
An A1 pulley that extends from the volar plate of the MP joint to the base of the proximal phalanx
-
A long A2 pulley that arises from the proximal part of the proximal phalanx and extends to the distal third of the proximal phalanx
-
A small A3 pulley at the level of the PIP joint
-
An A4 pulley at the midpart of the middle phalanx
-
An A5 pulley at the DIP joint (see Fig. 11.42)
the tendon ends.71,72,73,74 MR findings characteristically include the following:
-
An empty tendon sheath at the rupture area
-
Extensive tenosynovitis, dramatically enhanced after intravenous injection of gadolinium
-
Potentially extensive retraction in complete ruptures (Fig. 11.43) (unlike the situation with extensor tendons, the flexor tendons lack a strong tendon fixation)
-
In acute injuries the gap may be overestimated because the curled retracted tendon remains flexible (Fig. 11.44).
-
Associated pulley injury with some amount of tendon luxation
-
Focal intratendinous signal abnormalities (Fig. 11.45)72 in partial lacerations
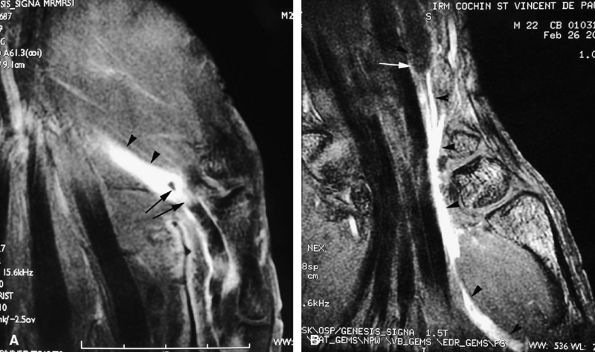 |
|
FIGURE 11.43 ● Acute open injury of the flexor pollicis longus tendon. (A) On these coronal post-contrast fat-suppressed T1-weighted images, the distal end of the tendon can be seen at the entry of the digital canal (arrows). (B) The proximal end is seen at the level of the radiocarpal joint (arrows). The tendon gap measures 6 cm. The empty tendon sheath shows significant synovitis (arrowheads in both images).
|
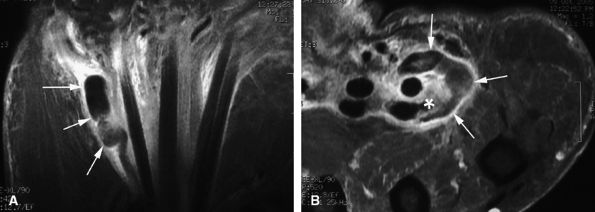 |
|
FIGURE 11.44 ● Acute rupture of the flexor digitorum profundus (FDP) tendon of the little finger in zone II. Coronal (A) and axial (B) post-contrast fat-suppressed T1-weighted images show retraction of a flexible proximal end (arrows) wrapping around the FDS tendon (asterisk).
|
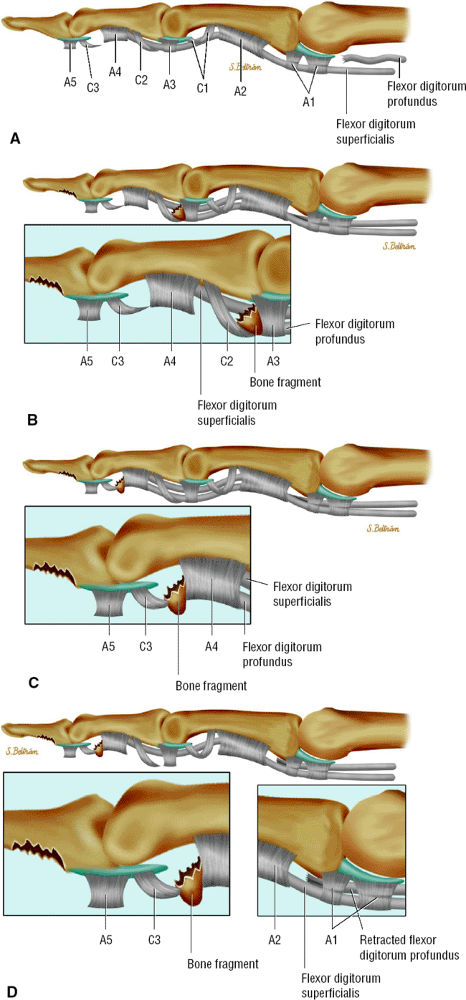
tendon. A sudden hyperextension during active flexion is responsible for this type of avulsion, most often seen in young athletes.75 The ring finger is involved in 80% of cases. This injury is often neglected initially as there is no typical deformity and swelling. Pain may mask a loss of active flexion of the DIP joint. Jersey finger is classified according to the degree of tendon retraction and the presence or absence of a bony fragment (Fig. 11.46):76,77
-
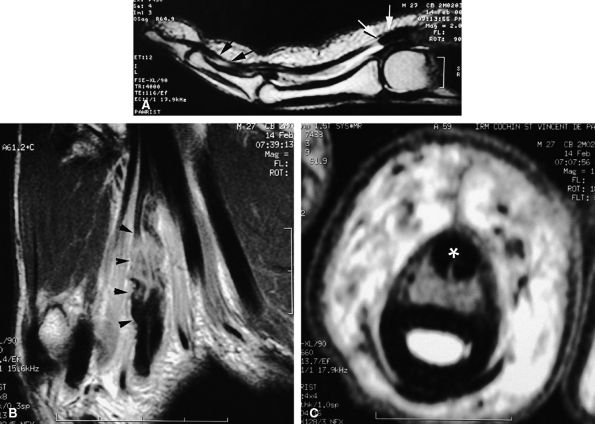
Type I: Retraction of the tendon into the palm
-
Type II: Retraction at the PIP joint. A small bone fleck may avulse and is visible at the PIP level.
-
Type III: Large bony fragment incarcerated in the A4 pulley
-
Type IV: A type III injury with an associated avulsion of the flexor tendon from the bone fragment
 |
|
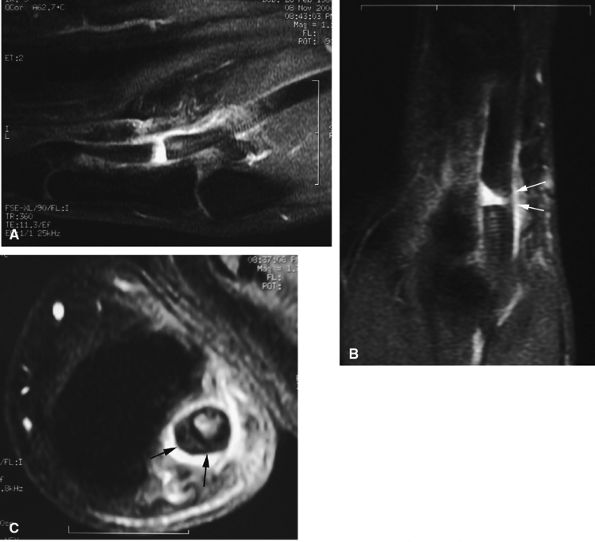
FIGURE 11.45 ● Open partial laceration of the flexor pollicis longus tendon. Sagittal (A), coronal (B), and axial (C) post-enhanced fat-suppressed T1-weighted images showing focal intratendinous high signal with conservation of a thin lateral continuity (arrow). Single orthogonal plane images may be misleading, and a partial tear may be mistaken for a complete tear. This potential pitfall is well demonstrated on the sagittal image (A).
|
 |
|
FIGURE 11.46 ● Classification of Jersey finger: (A) type I, (B) type II, (C) type III, (D) type IV.
|
 |
|
FIGURE 11.47 ● Jersey finger. (A) Sagittal T2-weighted image. (B) Coronal post-contrast T1-weighted images. (C) Axial T1-weighted image. Distal avulsion of the FDP tendon is shown with the proximal end (white arrows) at the metacarpophalangeal joint (type I). The tendon is wavy in the palm (arrowheads). The empty digital canal (in C) may mimic a remnant tendon, but the FDS tendon (asterisk) is alone in the canal.
|
 |
|
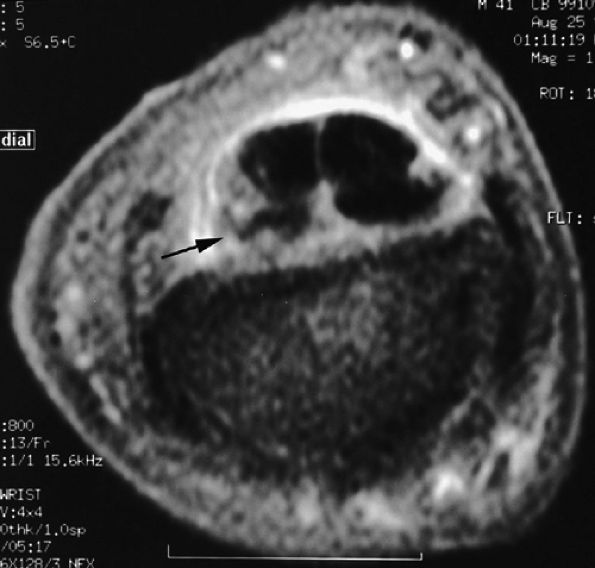
FIGURE 11.48 ● Axial post-contrast fat-suppressed T1-weighted image showing isolated laceration of the flexor digitorum superficialis (FDS) tendon. Irregularities and signal abnormalities of the radial band of the FDS can be seen close to its insertion (arrow).
|
 |
|
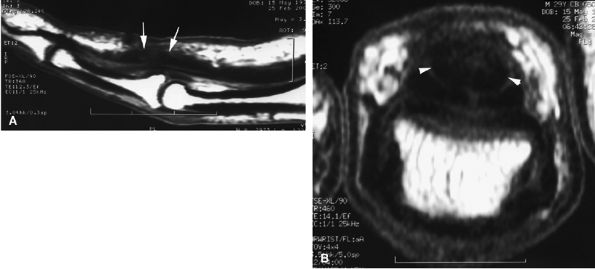
FIGURE 11.49 ● Healing process in a flexor digitorum profundus (FDP) tendon suture. Sagittal (A) and axial (B) T1-weighted images show surface irregularities of the suture area (arrows). Most of the surface of the tendon callus demonstrates low signal intensity (arrowheads).
|
exceeds 10 mm, reorganization of the tendon is not possible and reoperation (tendon grafting) is often the preferred option.93
 |
|
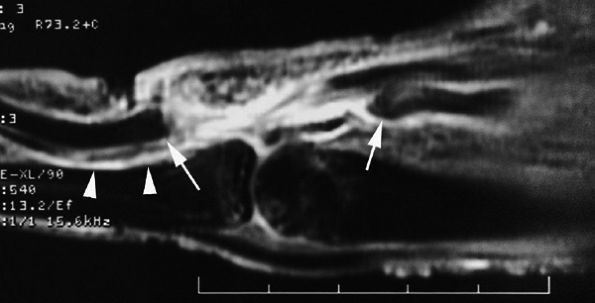
FIGURE 11.50 ● Acute rupture of the flexor digitorum profundus (FDP) tendon in zone II. Sagittal post-contrast fat-suppressed T1-weighted image shows the gap, which measured 3 cm (arrows). Note the slight deficiency of the A2 pulley (arrowheads).
|
 |
|
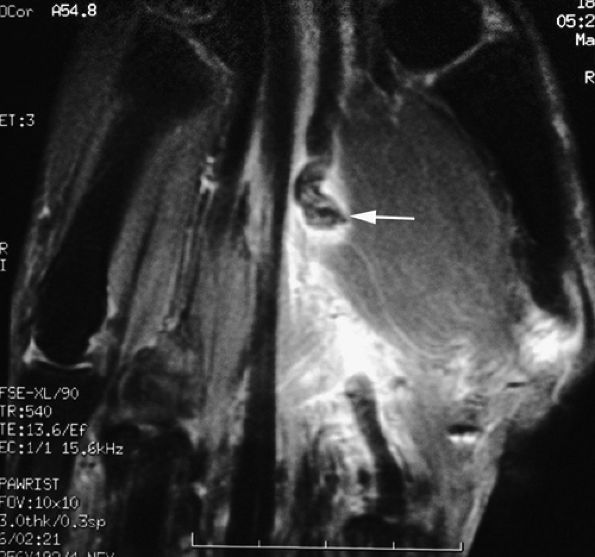
FIGURE 11.51 ● Rupture of a tendon graft of the flexor tendons of the index finger in zone III. Coronal post-contrast fat-suppressed T1-weighted image shows the tendon graft proximally retracted in the palm (arrow).
|
 |
|
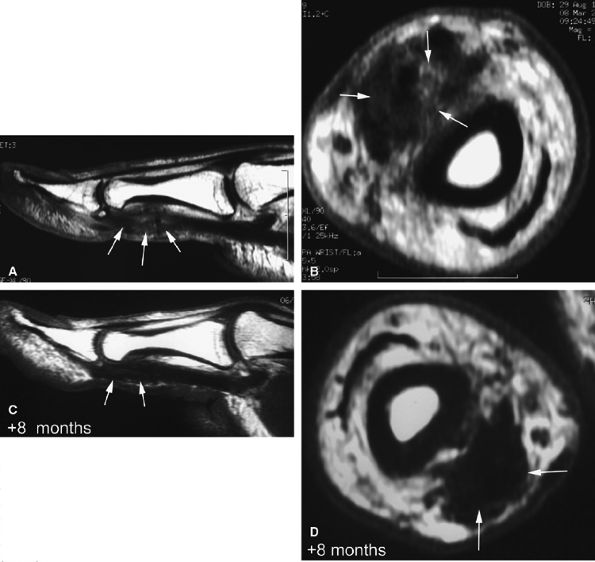
FIGURE 11.52 ● Elongation of a tendon callus of the flexor pollicis longus. Sagittal (A) and axial (B) post-contrast T1-weighted images show a thickened callus 1 cm in length with predominant scar tissue (arrows). Eight months later, sagittal (C) and axial (D) post-contrast T1-weighted images demonstrate the maturation process with thinning of the callus and predominant low-signal-intensity mature tissue (arrows).
|
-
Trigger finger, congenital or progressive
-
Tenosynovial ganglions
-
Lesions of the flexor tendon sheath associated with traumatic lacerations or surgical repairs
-
Ruptures due to overuse or stress (such as occurs during some sports activities, like rock climbing)98,99
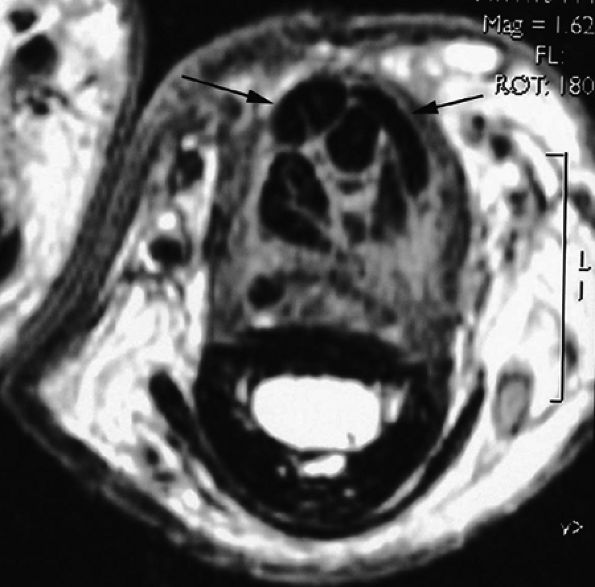 |
|
FIGURE 11.53 ● Postoperative adhesions in the digital canal. Axial post-contrast T1-weighted image shows adhesions between the disorganized FDP and FDS tendons. Note the palmar dislocation of the flexor tendons (arrows) due to deficiency of A2 pulley.
|
and axial MR images directly depict the tear as a thickening and a defect of the pulley (Fig. 11.55), sagittal images, which display the indirect sign of bowstringing, are more sensitive, particularly with imaging performed in forced flexion (Fig. 11.56).
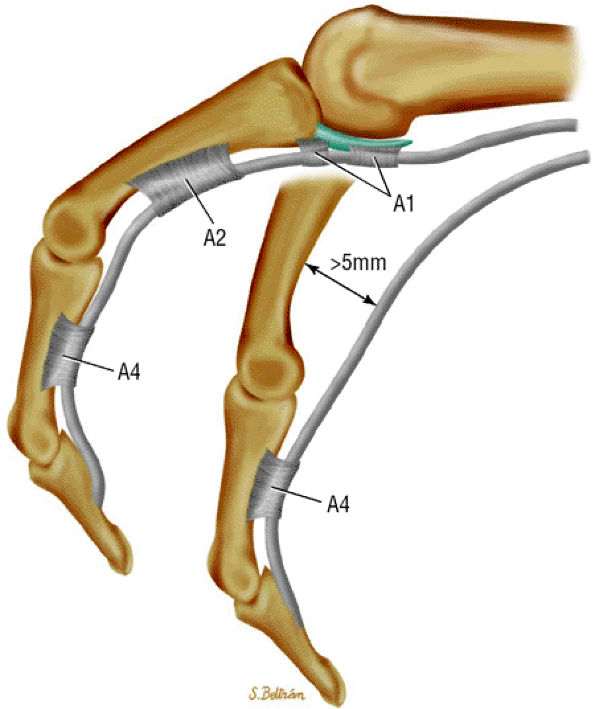 |
|
FIGURE 11.54 ● Injury of A1 and A2 annular pulleys with complete tear. There is bowstringing of the flexor tendons during flexion.
|
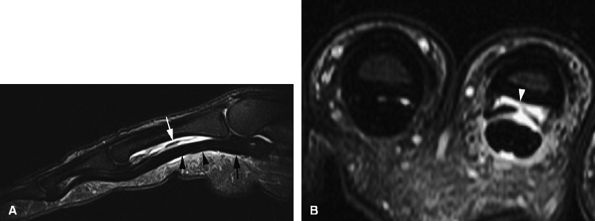 |
|
FIGURE 11.55 ● Rupture of A2 pulley of the fourth finger. Sagittal (A) and axial (B) post-contrast T1-weighted images show the tear of the A2 pulley on the midline (black arrowheads) with a palmar dislocation of the flexor tendon. The pulley (white arrow and arrowhead) is now deeply located beneath the flexor tendons. Note the integrity of the A1 pulley (black arrow).
|
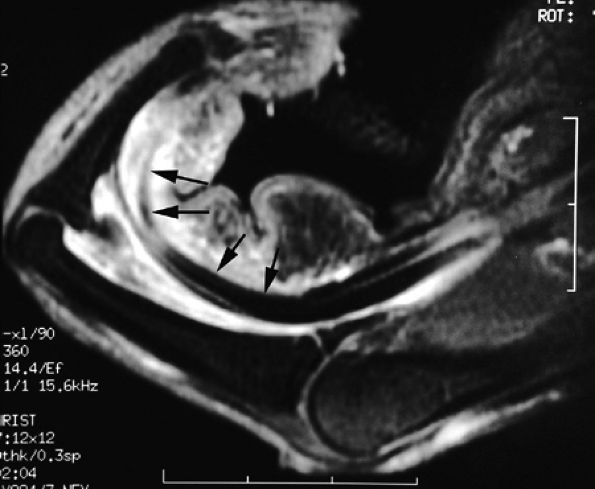 |
|
FIGURE 11.56 ● Bowstringing of the flexor tendons. Sagittal stress post-contrast T1-weighted image with forced flexion shows palmar dislocation of the flexor tendons (arrows) due to rupture of the A2 and A3 pulleys.
|
 |
|
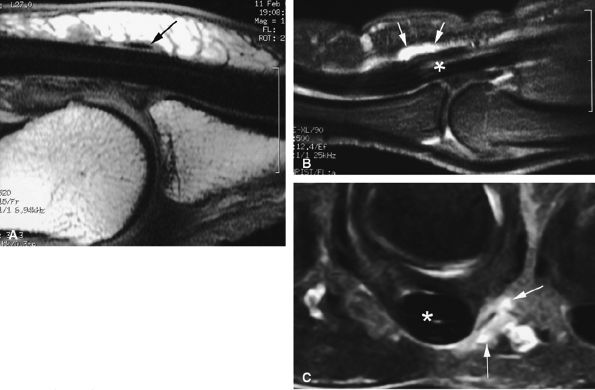
FIGURE 11.57 ● Trigger finger. (A) Sagittal T1-weighted image with a normal A1 pulley (arrow). Sagittal (B) and axial (C) fat-suppressed post-contrast T1-weighted images showing ulnar nodular inflammatory thickeningof the A1 pulley (arrows) associated with mild flexor tendinosis (asterisk).
|
 |
|
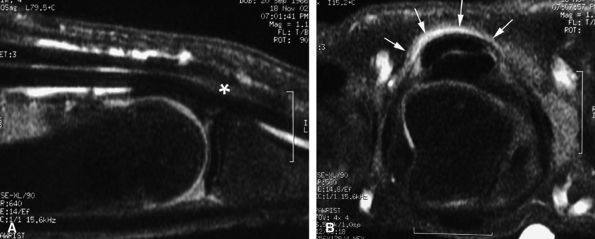
FIGURE 11.58 ● Trigger finger. Sagittal (A) and axial (B) post-contrast T1-weighted images show a diffuse inflammatory thickening of the A1 pulley (arrows) and a distal nodular tendinosis (asterisk).
|
 |
|
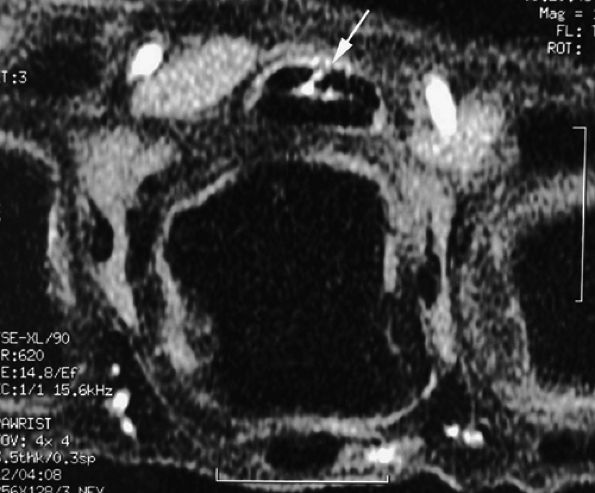
FIGURE 11.59 ● Trigger finger. Axial post-contrast fat-suppressed T1-weighted image showing partial laceration of the flexor digitorum superficialis (FDS) tendon (arrow) with inflammatory reaction.
|
 |
|
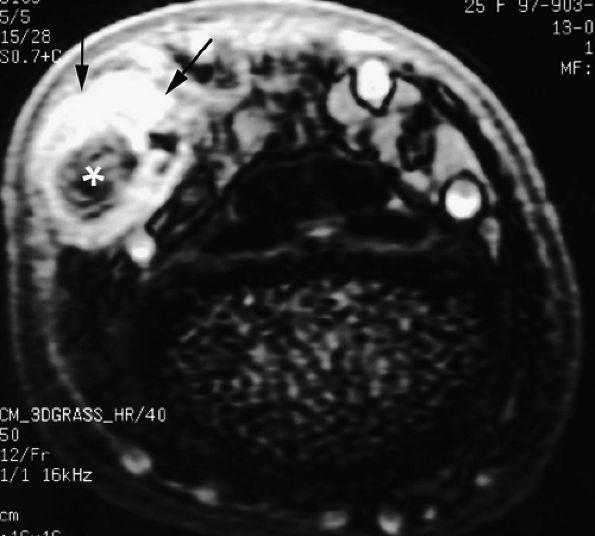
FIGURE 11.60 ● Posttraumatic arteriovenous fistulas. Axial post-contrast 3D gradient-echo image shows peripheral enhancement (arrows) and a central flow void (asterisk) due to high velocity.
|
 |
|
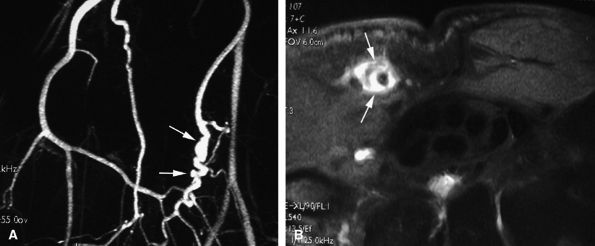
FIGURE 11.61 ● Hypothenar hammer syndrome. (A) MR angiography shows a typical corkscrew pattern (arrows) of the ulnar artery extending to the deep palmar arterial arch. (B) Axial post-contrast fat-suppressed T1-weighted image depicting inflammatory thickening of the ulnar artery walls (arrows).
|
 |
|
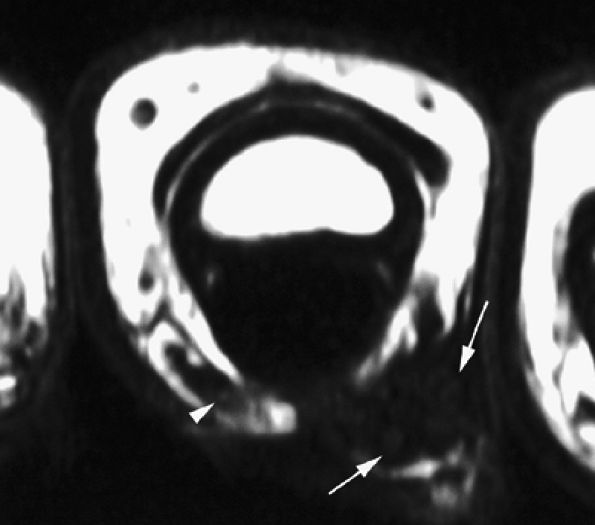
FIGURE 11.62 ● Palmar proper digital nerve neuroma. Axial T1-weighted image displaying the enlarged medial palmar proper digital nerve (arrows) with hypertrophic nerve bundles. Note the normal contralateral nerve (arrowhead).
|
images show intratendinous extension of the cyst with peripherally displaced thin tendinous walls (Fig. 11.66). Tenosynovitis is commonly associated at the level of the wrist. A painful cyst may be due to extrinsic nerve compression or, rarely, intraneural infiltration of a proper digital nerve (Fig. 11.67).137 Intraosseous ganglions in the phalanx have also been reported.138
 |
|
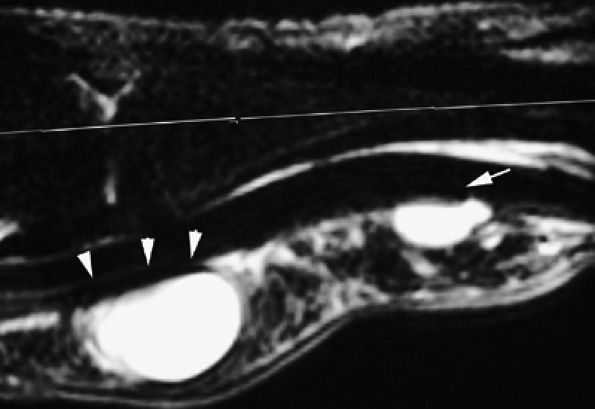
FIGURE 11.63 ● Palmar ganglia of the A1 and A2 pulleys. Sagittal STIR image depicts the proximal ganglion close to the A1 pulley (arrowheads) and the distal ganglion against the distal part of A2 pulley (arrow).
|
 |
|
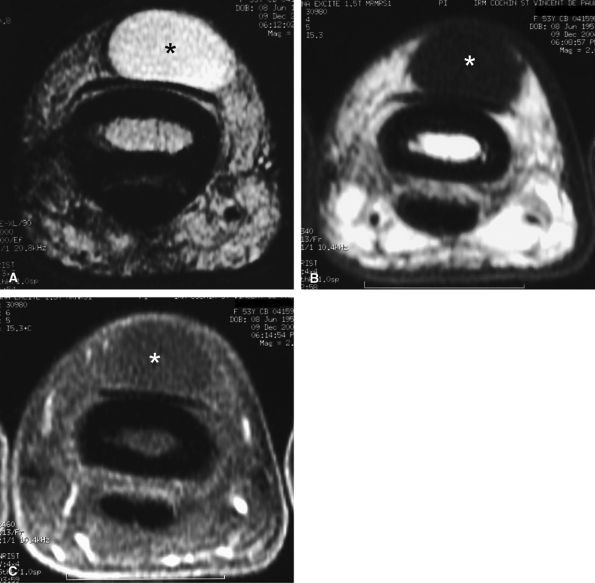
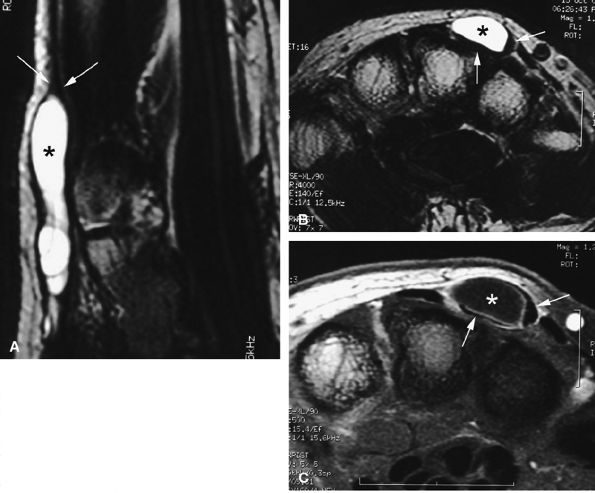
FIGURE 11.64 ● Dorsal ganglion at the proximal phalanx on (A) an axial T2-weighted image, (B) a T1-weighted image before contrast administration and (C) a T1-weighted fat-suppressed image after injection of gadolinium. The ganglion (asterisk) shows a homogeneous high signal on the T2-weighted image and low signal on T1-weighted images. There is no peripheral enhancement.
|
 |
|
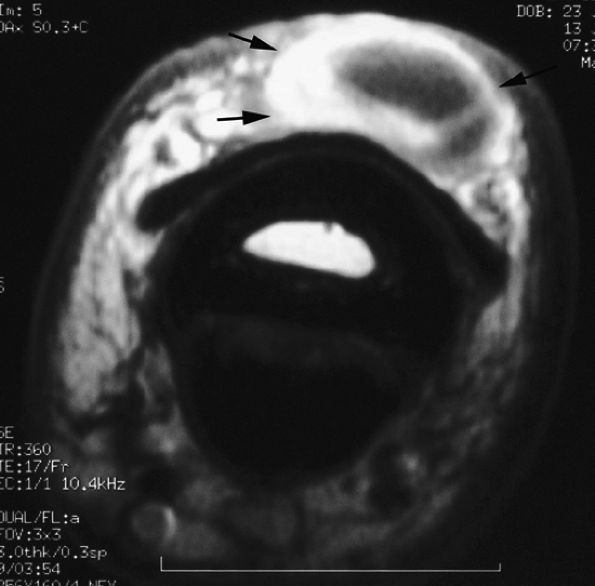
FIGURE 11.65 ● Inflammatory dorsal ganglion. Axial post-contrast T1-weighted image shows strong enhancement of the peripheral walls of the ganglion (arrows).
|
 |
|
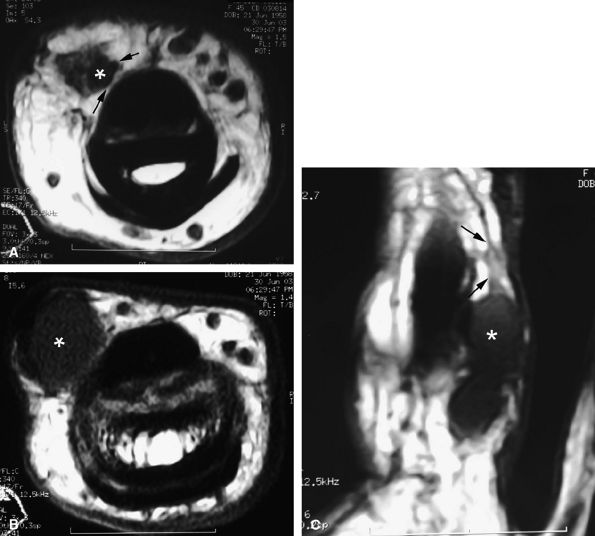
FIGURE 11.66 ● Intratendinous ganglion. Sagittal (A) and axial (B) T2-weighted images and an axial post-contrast fat-suppressed T1-weighted image (C) show a ganglion (asterisks) infiltrating the central part of the extensor digitorum communis tendon of the middle finger. The tendon wall is displaced peripherally (arrows).
|
 |
|
FIGURE 11.67 ● Intraneural ganglion. Axial (A and B) and coronal (C) T1-weighted images of a ganglion (asterisk) infiltrating the medial proper digital nerve (arrows).
|
 |
|
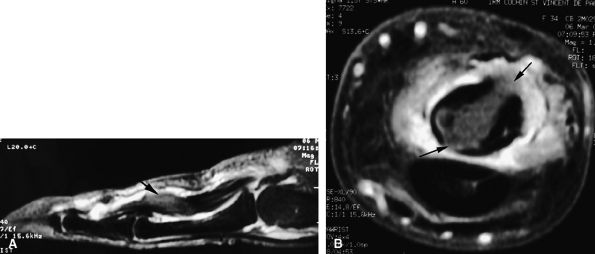
FIGURE 11.68 ● Tuberculous tenosynovitis. Sagittal (A) and axial (B) post-contrast fat-suppressed T1-weighted images show strong enhancement of the tenosynovitis in the digital canal. The flexor tendons are thickened and infiltrated by caseous necrosis (arrow).
|
 |
|
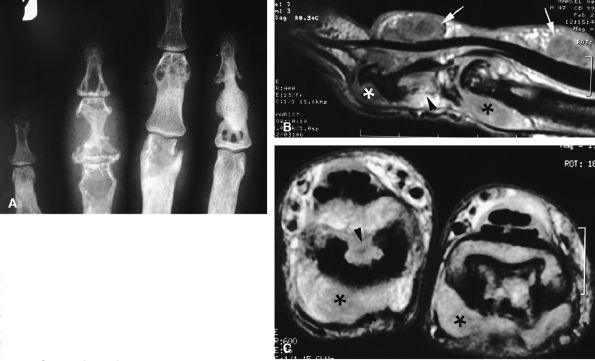
FIGURE 11.69 ● Sarcoidosis with osseous involvement (arrowheads). PA view radiograph (A) showing polycystic osseous involvement of the fingers. A sagittal 3D post-contrast gradient-echo image (B) and an axial post-contrast T1-weighted image (C) depict polysynovitis with joint synovitis (asterisks) and polynodular tenosynovitis (arrows).
|
 |
|
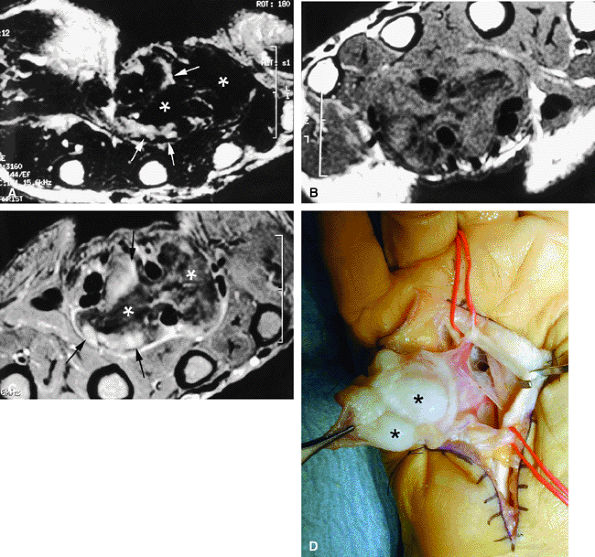
FIGURE 11.70 ● Chondromatosis of the sheath of the flexor tendons on (A) an axial fast spin-echo T2-weighted image and T1-weighted images before (B) and after (C) injection of gadolinium with fat suppression. There is enlargement of the tendon sheaths of the third and fourth fingers with synovitis (arrows) and cartilage signal characteristics (asterisks). (D) Surgical exposure indicating white cartilage nodules (asterisks).
|
 |
|
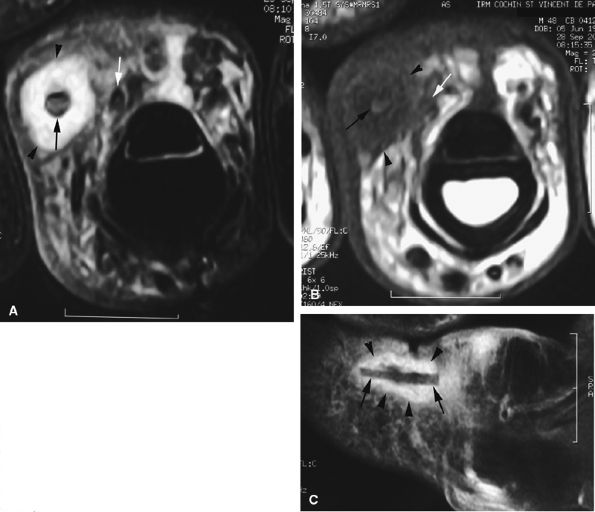
FIGURE 11.71 ● Foreign body granuloma on an axial STIR image (A), an axial T1-weighted image (B), and a sagittal post-contrast fat-suppressed T1-weighted image (C). A wood splinter (black arrows) with a peripheral enhanced granuloma (arrowheads) can be seen. The proper digital neurovascular bundle is deeply displaced (white arrows).
|
 |
|
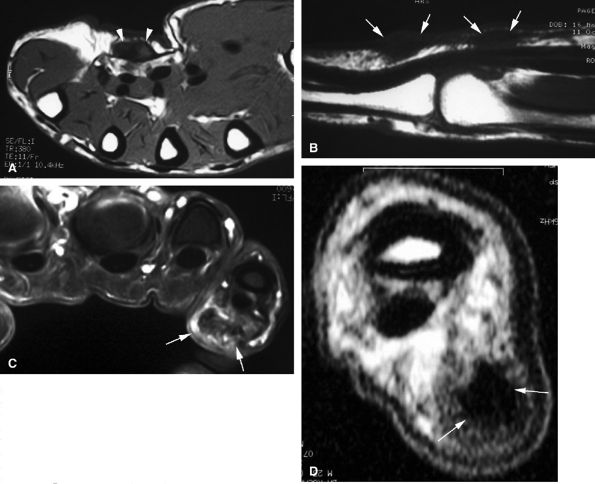
FIGURE 11.72 ● Dupuytren's contracture. Axial (A) and sagittal (B) T1-weighted images and an axial post-contrast fat-suppressed T1-weighted image (C) show a heterogeneous nodule of the palmar aponeurosis (arrowheads) and subcutaneous small nodules with high cellularity (strong enhancement) (arrows) along the little finger. (D) In a separate case, axial T1-weighted images show a large strand with low signal and finger contracture (arrows).
|
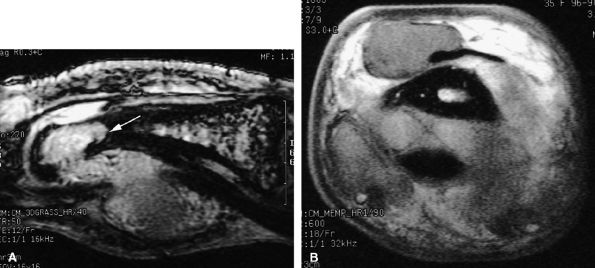
seen with synovial sarcomas. Bone and joint invasion is possible.168 Ultrasonography shows a nonspecific solid mass with a variable color Doppler signal. MR images are specific, depicting a well-defined mass with hemosiderin deposits. Typical signal void artifacts are seen on all sequences, particularly on gradient-echo images, and a more heterogeneous and predominantly low signal is found on T2-weighted images.162,166,169 The lesion typically enhances after intravenous injection of gadolinium (Fig. 11.74). The tendon sheath of the flexor digitorum tendons is usually partially or totally enveloped; the extensor tendons are less commonly involved. Some lesions may be more aggressive, and diffuse lesions are seen in multiple locations with invasion of both the flexor and extensor tendons (Fig. 11.75).170
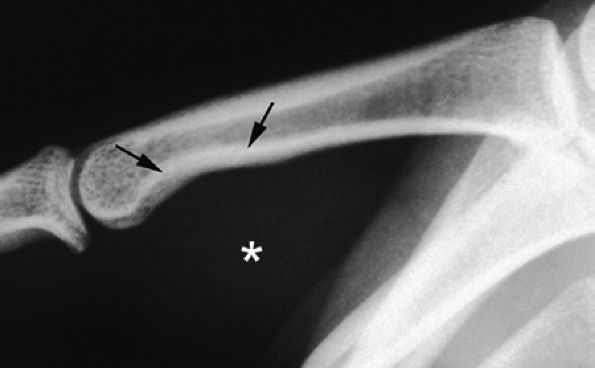 |
|
FIGURE 11.73 ● Giant cell tumor of the tendon sheath. Lateral view radiograph shows a large mass of the palmar soft tissue (asterisk) and bone pressure erosion (arrows).
|
 |
|
FIGURE 11.74 ● Giant cell tumor of the tendon sheath. Sagittal T2-weighted image (A) and post-contrast T1-weighted image (B) show a palmar mass (arrows) close to the sheath of the flexor tendons with predominant low signal (arrowhead) on the T2-weighted image and strong enhancement following contrast administration.
|
 |
|
FIGURE 11.75 ● Aggressive giant cell tumor of the tendon sheath. Sagittal post-contrast 3D gradient-echo (A) and axial T1-weighted (B) images depicting a multinodular tumor invading the flexor and extensor tendons as well as the head of the phalanx (arrow).
|
“hemangioma” is often used as a generic term, although it represents a well-defined and rather unusual entity. Hemangiomas result from endothelial hyperplasia and consist of lobules of microcapillaries. They are absent or discrete at birth and grow rapidly in successive phases of proliferation and regression. Vascular malformations do not exhibit endothelial abnormalities; they are present at birth and their growth follows that of the child; and they never regress. In 1996, the International Society for the Study of Vascular Anomalies (ISSVA) classification was proposed by Enjolras and Mulliken, based on the initial classification of Mulliken and Glowacki proposed in 1982 (Table 11.3).172 In this classification low-flow malformations include venous, lymphatic, and capillary malformations. High-flow malformations are represented by AVMs and AVFs.173 The distinguishing features of infantile hemangioma and vascular malformations are presented in Table 11.4.
|
TABLE 11.3 ● ISSVA Classification of Intramuscular Vascular Anomalies
|
||||||
|---|---|---|---|---|---|---|
|
|
TABLE 11.4 ● Distinguishing Features of Infantile Hemangioma and Vascular Malformation
|
||||||||||
|---|---|---|---|---|---|---|---|---|---|---|
|
 |
|
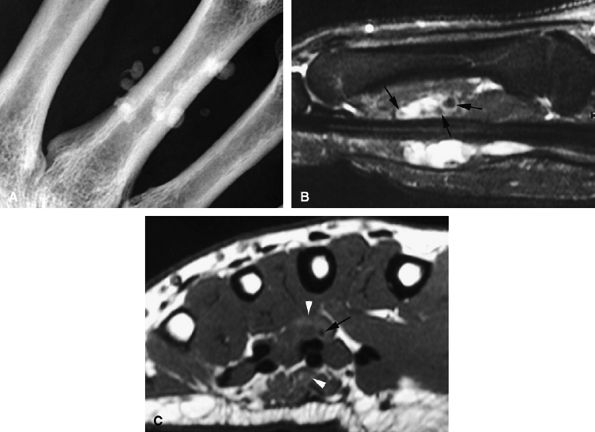
FIGURE 11.76 ● Venous malformation with phleboliths. (A) PA view radiograph and (B) sagittal STIR image showing the high-signal-intensity malformation with foci of low signal intensity (arrows) due to phleboliths. (C) Axial T1-weighted image shows small foci of high signal (arrowheads) due to thrombosis.
|
-
Venous malformations are isointense on T1-weighted sequences and hyperintense on T2-weighted sequences.177 The high T2 signal is related to increased free water within blood pools in the venous malformation.
-
Signal intensity is often heterogeneous and areas of low signal, caused by fibrous septa, calcifications, thrombi, or hemosiderin deposition after thrombosis, may be seen on T2-weighted images.171,178
-
Phleboliths present as low-signal-intensity punctuate areas on both T1- and T2-weighted images.
-
Areas of high signal on T1-weighted images may be related to thrombi (see Fig. 11.76).
-
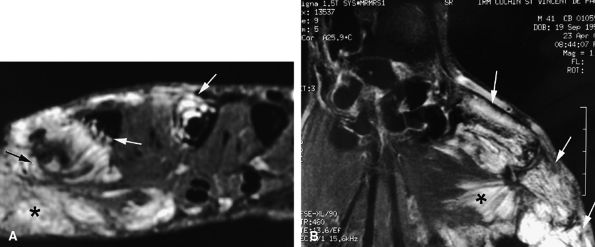
Articular, cartilaginous, or osseous invasion may also be depicted on MR studies (Fig. 11.77).
-
MR imaging is particularly useful in displaying the relationship of the venous malformation with adjacent structures, such as muscles, tendons, and nerves.
-
Venous malformations are frequently multifocal, have both intramuscular and subcutaneous components (see Fig. 11.77), and follow the neurovascular bundles of the affected limb.179
-
Some venous malformations may even invade nerves, causing pain. These lesions present difficult therapeutic decisions since there are risks associated with both surgery and sclerotherapy.
-
Nodular or tubular enhancement may be seen after gadolinium administration. MRA is complementary to standard MR studies, providing precise details of the angiographic appearance of the malformation (Fig. 11.78). MRA of the fingers is technically challenging because of the small caliber of blood vessels and their changing orientation. The MRA technique that is most suited to the fingers is a 3D coronal acquisition after gadolinium administration. This rapid technique (requiring less than 30 seconds for acquisition) yields high spatial resolution and is not dependent on vessel orientation. Injection of a gadolinium test dose allows precise determination of maximum arterial enhancement.180 Temporal resolution remains inferior to DSA.4
better angiographic assessment of the venous malformation than arteriography alone.116
 |
|
FIGURE 11.77 ● Venous malformation with bony involvement. Axial STIR (A) and coronal post-contrast fat-suppressed T1-weighted image (B) of vascular malformation infiltrating the thenar eminence, the three first metacarpals (arrows), and the subcutaneous tissues of the thumb (asterisks).
|
septa may be seen, similar to that seen in other cystic tumors. Venous malformations, on the other hand, exhibit enhancement of their bloody contents.182
 |
|
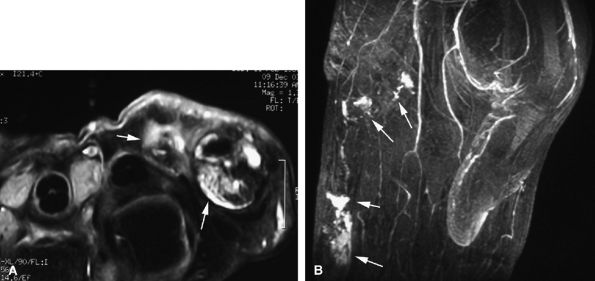
FIGURE 11.78 ● Venous malformation. (A) Axial post-contrast fat-suppressed T1-weighted image showing vascular malformation invading the fourth intermetacarpal space and the fifth metacarpal (arrows). (B) MR angiogram of multifocal vascular malformation with a distal extension toward the lateral aspect of the fifth finger (arrows).
|
 |
|
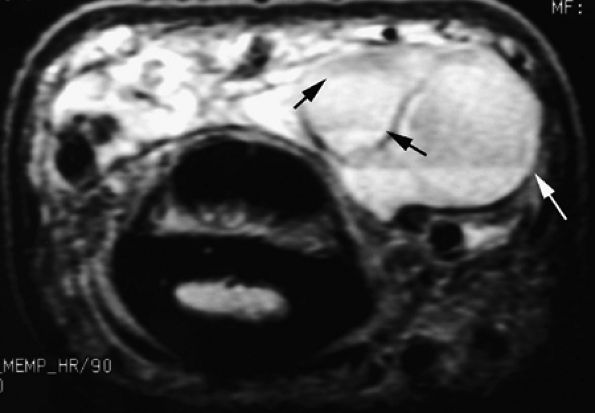
FIGURE 11.79 ● Vascular malformation with multiple lobules and fluid–fluid levels (arrows).
|
hemangioma” should be used to refer to a lesion occurring in a child. Pediatric cutaneous vascular lesions and hemangiomas are usually not present at birth; they become clinically evident within the first month of life, exhibit a rapid growth phase in the first year, and involute and spontaneously regress to nearly complete resolution by 7 years of age. By definition, an adolescent or adult patient cannot have a true hemangioma.116
 |
|
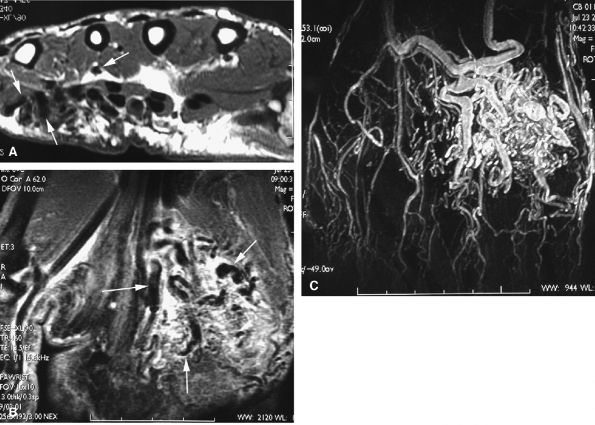
FIGURE 11.80 ● Arteriovenous malformation. (A) Axial T1-weighted image, (B) coronal post-contrast fat-suppressed T1-weighted image, and (C) MR angiogram showing a high-velocity vascular malformation of the hypothenar eminence with flow void artifacts (arrows). The angioarchitecture is better assessed with MR angiography.
|
 |
|
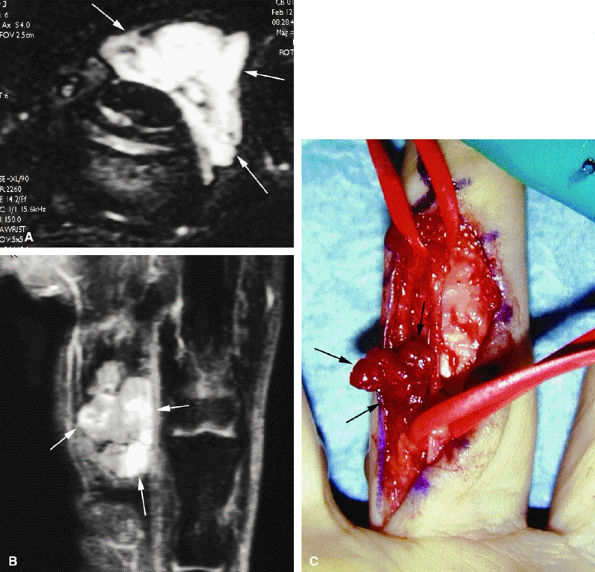
FIGURE 11.81 ● Hemangioma on (A) axial STIR, (B) coronal post-contrast fat-suppressed T1-weighted images, and (C) operative view. The hemangioma (arrows) appears as a soft tissue mass with a very high signal on the STIR image and partial strong enhancement after contrast administration.
|
is the most reliable sign. Identification of high-flow vascular structures exhibiting signal voids on both T1- and T2-weighted images rules out a venous malformation and favors the diagnosis of an AVM or an intramuscular hemangioma.
 |
|
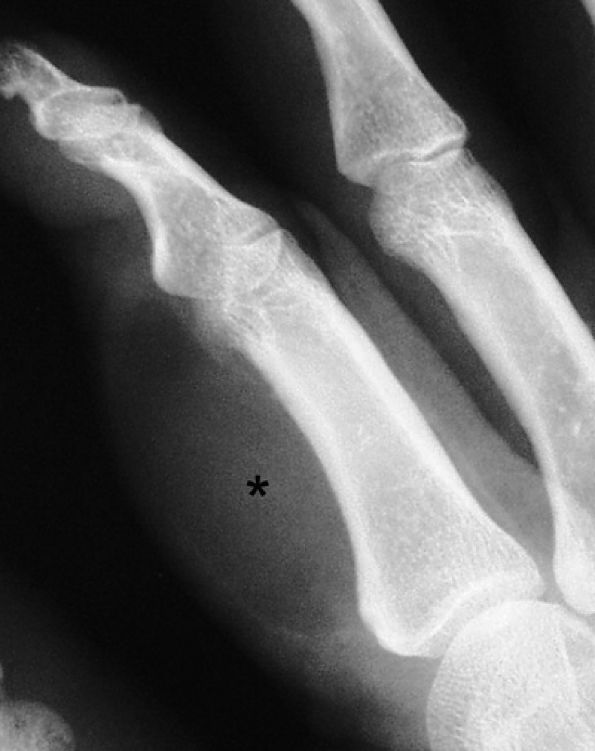
FIGURE 11.82 ● Lipoma of the index finger. Oblique view radiograph shows a low-density palmar mass (asterisk) in the soft tissues.
|
one third of cases are associated with macrodactyly (macrodystrophia lipomatosa) with bony and soft tissue overgrowth.195
 |
|
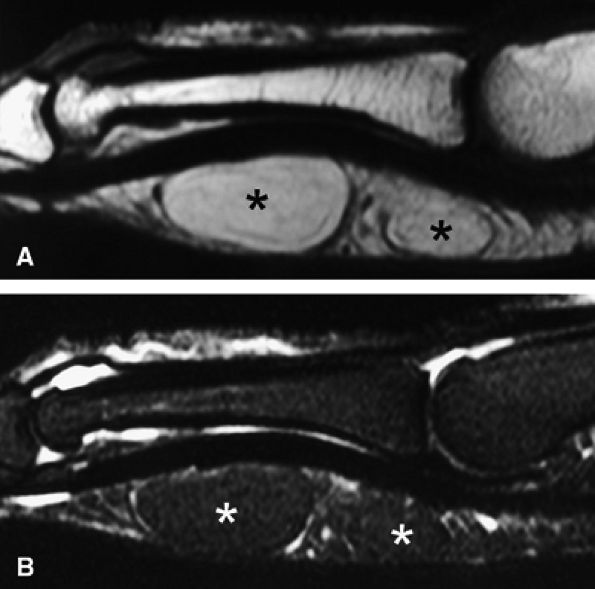
FIGURE 11.83 ● Lipoma. Sagittal T1-weighted image (A) and STIR image (B) depicting a bilobed lipoma (asterisks) of the palmar aspect of the proximal phalanx. The lesion demonstrates high signal on the T1-weighted image and low signal on the STIR image, similar to subcutaneous fatty tissue.
|
 |
|
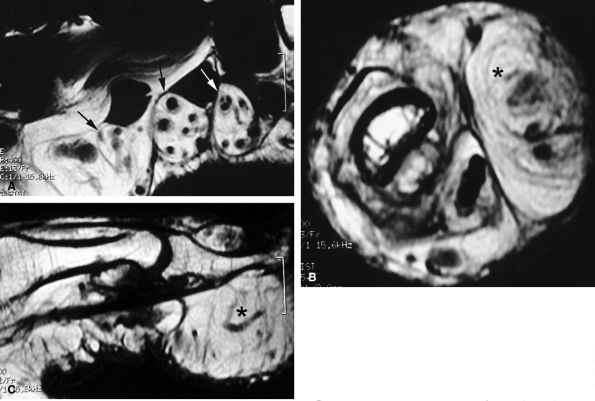
FIGURE 11.84 ● Macrodystrophia lipomatosa of the thumb. Axial (A and B) and sagittal (C) T1-weighted images depict thickening of the subcutaneous fatty tissue of the palmar and medial aspect of the thumb (asterisk). A fibrolipoma of the two first interdigital nerves demonstrates a cable-like pattern (arrows).
|
 |
|
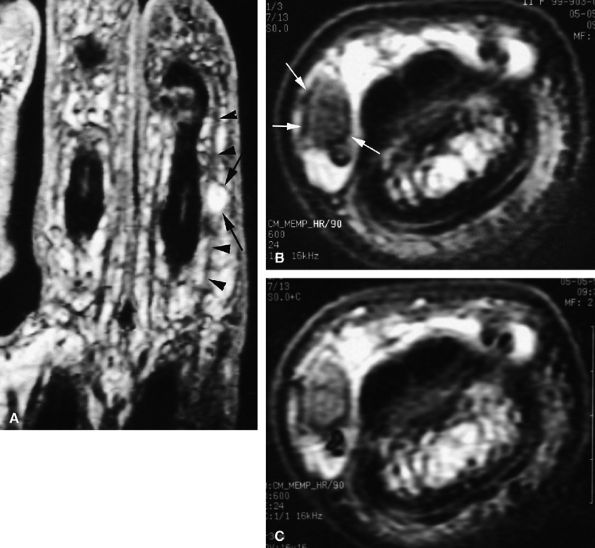
FIGURE 11.85 ● Schwannoma of the proper digital nerve. (A) Coronal T2-weighted 3D gradient-echo image. Axial T1-weighted image before (B) and after (C) gadolinium injection. The tumor is visualized as a round mass with a peripheral capsule (arrows) along the course of the proper digital nerve (arrowhead). The mass demonstrates high signal on the T2-weighted image and enhancement after injection of gadolinium.
|
 |
|
FIGURE 11.86 ● Chondroma of the nail bed. (A) Sagittal T2-weighted 3D gradient-echo image. Note high signal and lobulated margins (asterisks). Pressure bone erosion of the distal phalanx (arrowheads) can also be seen. (B) Axial post-contrast T1-weighted image showing lobulated type of enhancement (asterisks).
|
 |
|
FIGURE 11.87 ● Lateral view radiograph showing multiple chondromas (arrows) of the hand, which may occur in Ollier's disease.
|
 |
|
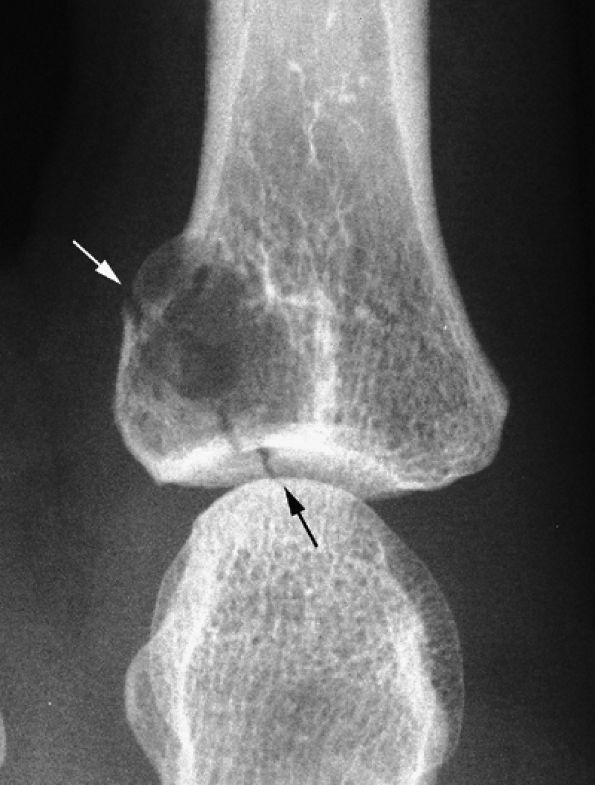
FIGURE 11.88 ● PA view radiograph showing fracture (arrow) of an enchondroma of the base of the proximal phalanx.
|
 |
|
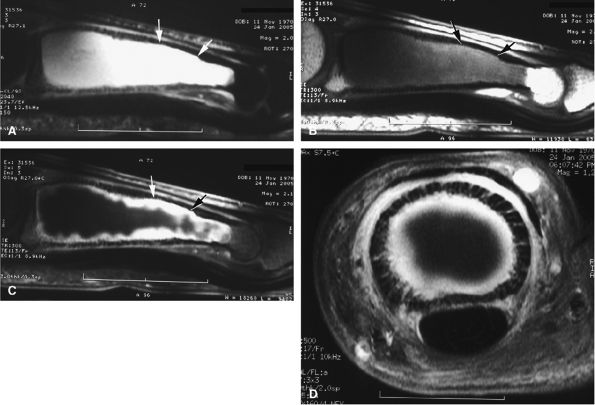
FIGURE 11.89 ● Enchondroma of the proximal phalanx. Sagittal T2-weighted (A) and T1-weighted (B) images. Sagittal (C) and axial (D) fat-suppressed T1-weighted images after gadolinium administration. A centromedullary expansile lesion with cortical thinning and scalloping (arrows) can be seen. There is high signal on the T2-weighted image and lobulated peripheral enhancement.
|
 |
|
FIGURE 11.90 ● Enchondroma of the proximal phalanx. Sagittal T2-weighted (A) and post-contrast T1-weighted (B) images depict intralesional septa (arrows) with enhancement delineating cartilaginous lobules.
|
-
Pain (the main symptom)
-
A slight lifting of the dorsal aspect of the distal phalanx
-
Distal onycholysis, sometimes emerging beneath the free edge of the nail plate
-
Nail failure, which may cause surface erosion leading to infection mimicking an ingrown nail or a melanoma222
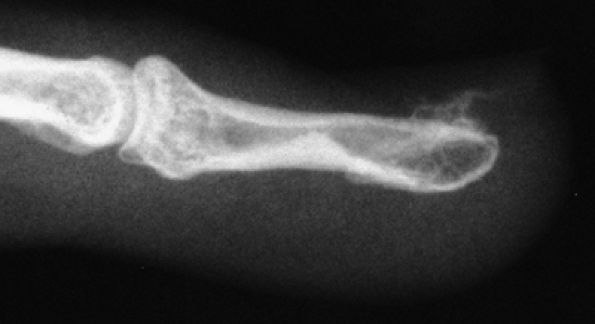
distal phalanx, but this distinction may be difficult to appreciate (Fig. 11.92).223,224 Since the treatment for both entities is surgical excision, radiographic evaluation is sufficient for preoperative evaluation.
 |
|
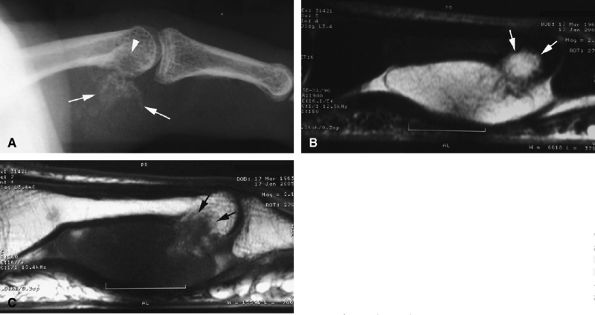
FIGURE 11.91 ● Juxtacortical chondroma. (A) Lateral view radiograph showing calcifications of the palmar soft tissues (arrows) and bone erosion of the proximal phalanx head (arrowhead). Sagittal STIR (B) and post-contrast T1-weighted images (C) show intralesional septa with cartilage signal intensity characteristics. Invasion of the head of the phalanx is well depicted (arrows).
|
 |
|
FIGURE 11.92 ● Subungual exostoses. Lateral view radiograph showing that the trabecular bone and the cortex of the phalanx are not in continuity.
|
 |
|
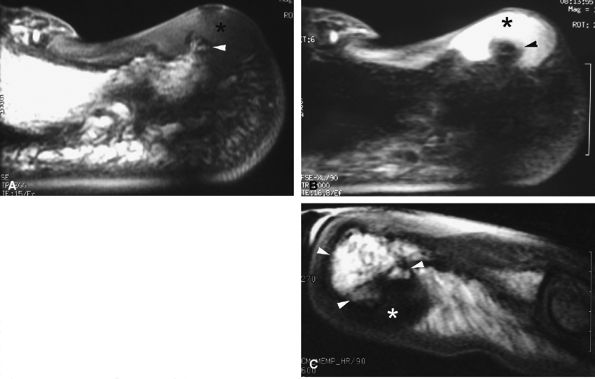
FIGURE 11.93 ● Subungual exostoses. Sagittal T1-weighted (A) and STIR (B) images showing a predominant hyaline cartilage cap (asterisk) with very high signal on the STIR image. The bony component is tiny (arrowhead). (C) Sagittal T1-weighted image in a separate case shows that the bony component is predominant (arrowheads) and the fibrocartilage cap demonstrates low signal intensity (asterisk).
|
bone cortex is usually intact, although some cases of bone erosions have been reported.228,233 The periosteal reaction becomes compact and integrated into the bone.
 |
|
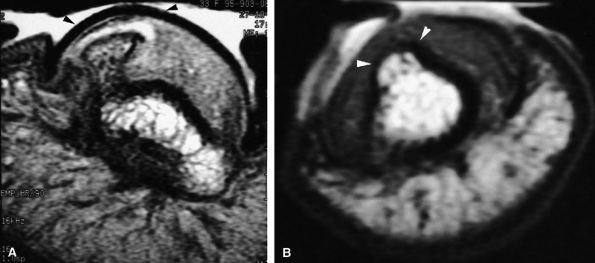
FIGURE 11.94 ● Subungual exostoses. (A) Axial proton density-weighted image depicting development of the exostoses in the lateral part of the nail bed with asymmetrical deformity (arrowheads). (B) Axial T1-weighted image in a separate case shows the lesion is seated on the midline of the nail bed (arrowheads).
|
after surgery depends on the degree of maturation of the lesion but is much less than that of bizarre paraosteal osteochondromatous proliferation.226,236
 |
|
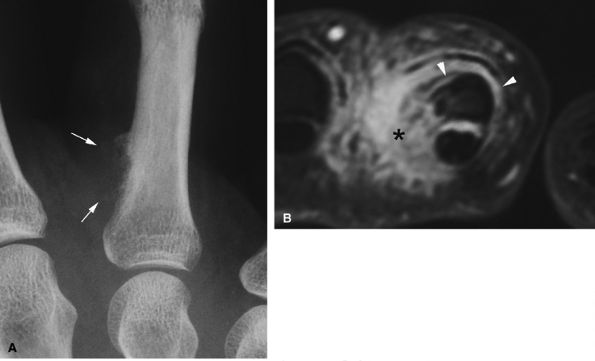
FIGURE 11.95 ● Florid reactive periostitis. (A) PA view radiograph of a paraosseous mass with sparse calcifications (arrows) and compact periosteal reaction. (B) Axial post-contrast fat-suppressed T1-weighted image showing a large inflammatory reaction in the soft tissues (asterisk) and an aggressive periosteal reaction with phalanx integrity (arrowheads).
|
 |
|
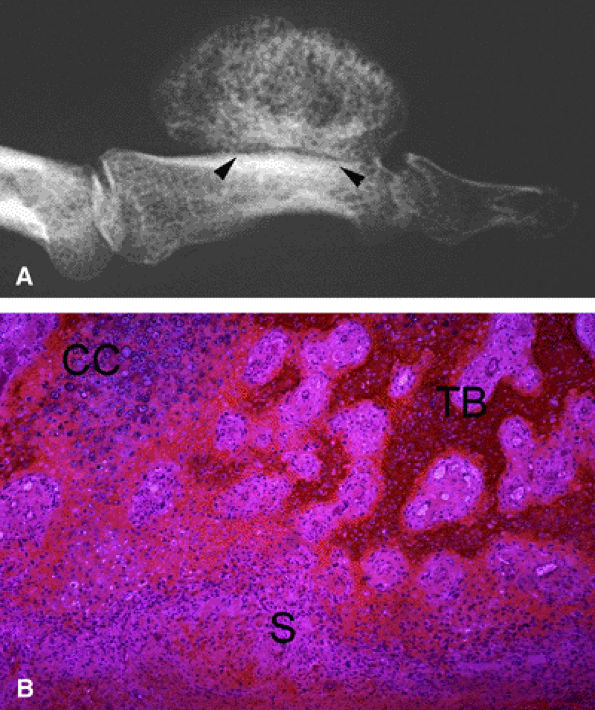
FIGURE 11.96 ● Bizarre paraosteal osteochondromatous proliferation (BPOP). (A) Oblique view radiograph shows features similar to an osteochondroma but with an intact underlying cortex (arrowheads). (B) Histologically there is variable association of a less organized cartilage cap than in osteochondroma, maturing trabecular bone, and fusiform cells without cellular atypia in the stroma.
|
-
Hypercellular cartilage with calcifications and enchondral ossification. Cartilage may form a cap or lobules separated by fibrous septa in a less-organized architecture than in osteochondroma. This cartilaginous component may be minimal in older lesions.246
-
Maturing trabecular bone
-
Fusiform cells without cellular atypia in stroma
misleading features in osteoid osteoma include the following (see Fig. 11.97):248,249
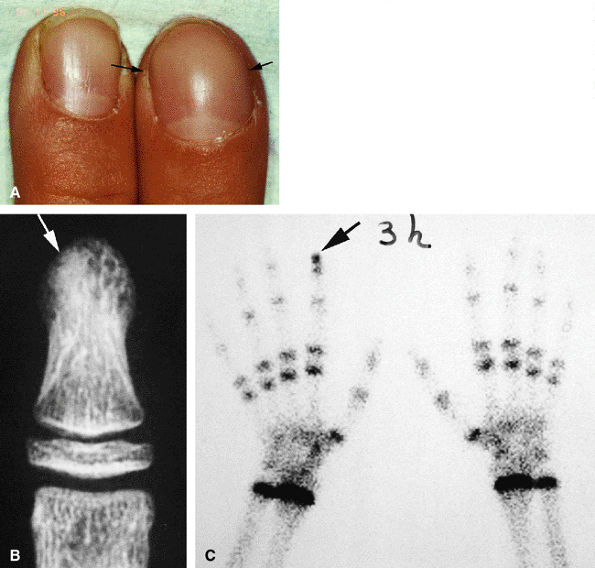 |
|
FIGURE 11.97 ● Osteoid osteoma of the distal phalanx of the index finger. (A) Dorsal aspect of the fingertip showing clubbing (arrows). (B) PA view radiograph showing osteosclerosis of the distal tuberosity of the phalanx (arrow), blurring the detection of a nidus. (C) Tc99 bone scan depicting delayed uptake of the fingertip of the index finger (arrow).
|
-
Absence of reactive bone
-
Monoarticular arthritis
-
Clubbing
-
Macrodactyly
-
Painless swelling
-
Absence of bony lysis
soft tissues, the nidus may be difficult to highlight with MR imaging (Fig. 11.99). Percutaneous radiofrequency ablation may be performed in the tubular bones of the hand.250
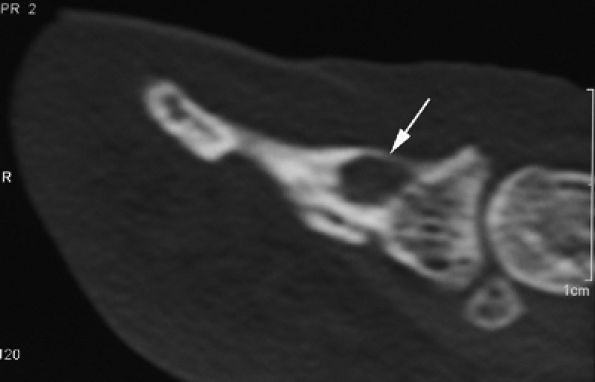 |
|
FIGURE 11.98 ● Osteoid osteoma of the distal phalanx. CT scans showing the osteolytic noncalcified nidus (arrow).
|
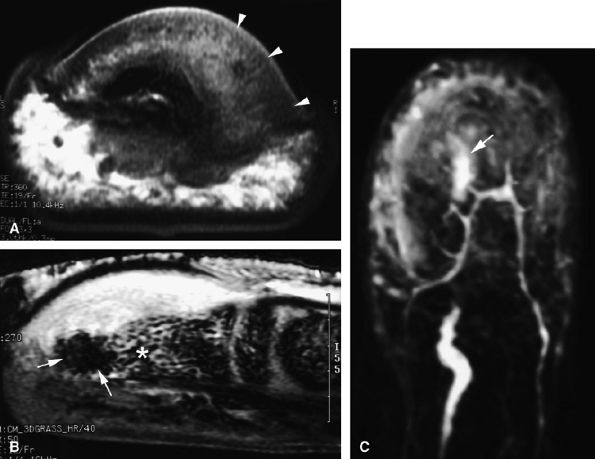 |
|
FIGURE 11.99 ● Osteoid osteoma of the distal phalanx. (A and B) The calcified nidus appears as a focus of low signal intensity (arrows), and associated asymmetric inflammatory thickening of the nail bed can be seen (arrowheads). (C) MR angiography demonstrates hypervascularization of the nidus on delayed sequences (arrow).
|
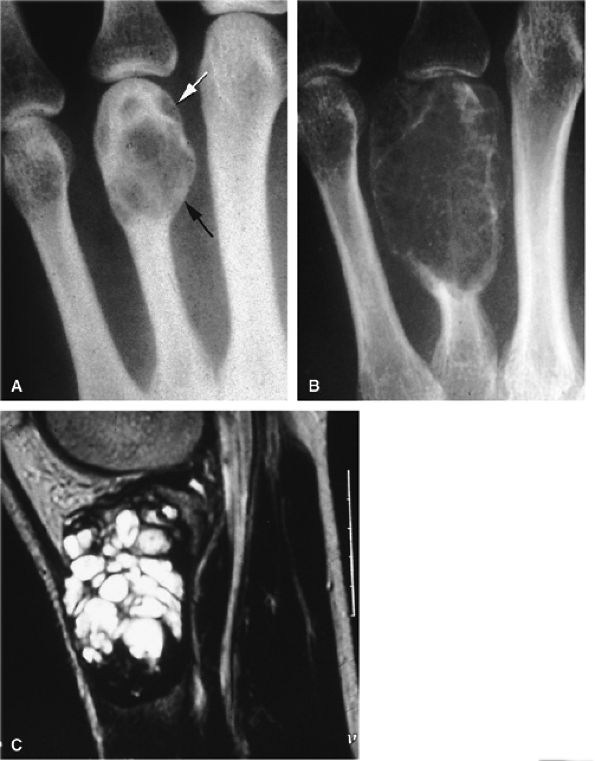 |
|
FIGURE 11.100 ● Giant cell tumor of the metacarpal. (A) Oblique view radiograph showing an expansile osteolytic lesion (arrows) of the distal metaphysoepiphysis of the fourth metacarpal. (B) One year later, there is an increase of expansion, cortex osteolysis, and numerous intralesional septa. (C) Sagittal T2-weighted image of the right knee shows the appearance of an identical lesion in the superior tibia.
|
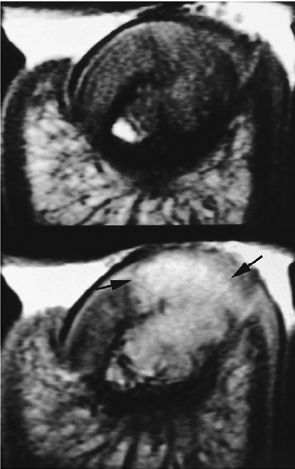 |
|
FIGURE 11.101 ● Giant cell tumor of the distal phalanx on an axial T1-weighted image before and after injection of gadolinium. The post-contrast image shows strong enhancement of the tumor invading the nail bed (arrows). Asymmetrical deformity of the nail bed is also seen.
|
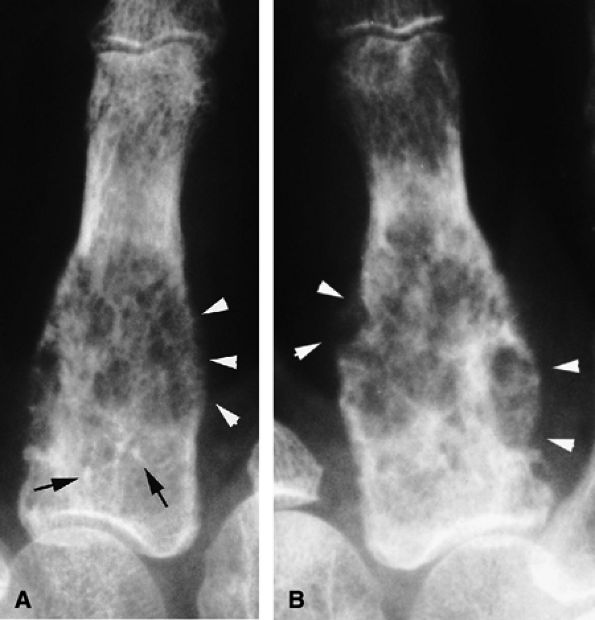 |
|
FIGURE 11.102 ● Chondrosarcoma of the metacarpal. (A) PA view radiograph showing a slightly expansile osteolytic lesion of the proximal third of the metacarpal. Intralesional calcifications (arrows) are compatible with an enchondroma, but cortex osteolysis with periosteal reaction (arrowheads) is unusual. (B) At follow-up 3 months later, there has been a significant increase in size and extensive cortex osteolysis (arrowheads).
|
found in the periungual area are discussed below. Tumors of the perionychium may be difficult to diagnose because of its anatomic characteristics. Symptoms, growth, and above all the appearance of a tumor may be modified by the presence of the adjacent nail plate. Deep tumors originating close to the nail root are covered by the posterior nail fold, and their only sign may be nail dystrophy. It is important that all suspicious lesions of the nail unit be carefully evaluated by radiography and biopsy. A complementary imaging modality (ultrasonography or MR imaging) may be helpful in difficult cases by confirming and accurately locating the periungual mass.
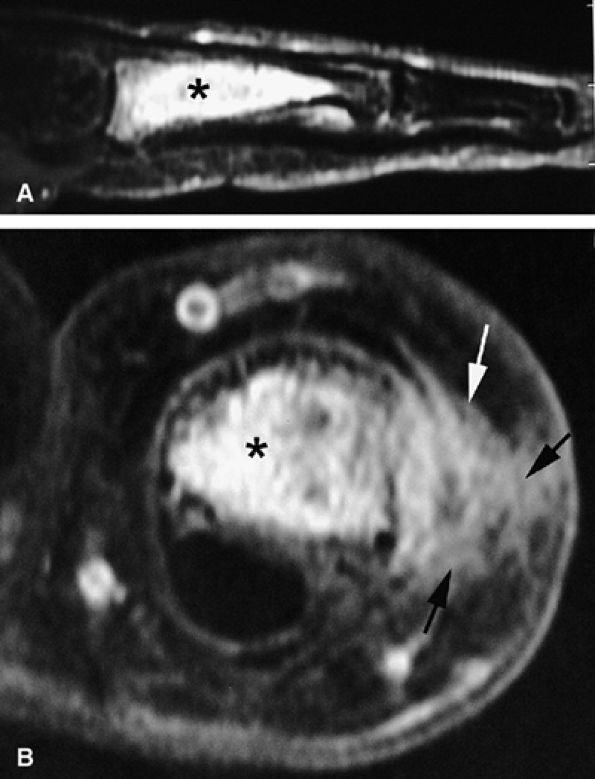 |
|
FIGURE 11.103 ● Chondrosarcoma (asterisk) of the proximal phalanx. (A) STIR image showing a centromedullary tumor with high signal intensity compatible with cartilage content. (B) Axial post-contrast fat-suppressed T1-weighted image showing intralesional diffuse enhancement with cortex osteolysis and extension toward the soft tissues (arrows).
|
devoid of signal throughout its thickness. With ultrasonography, two layers of different hydration in the nail plate can be distinguished.268 Unlike MR images, however, ultrasound scans do not display the epidermis layer of the nail bed.
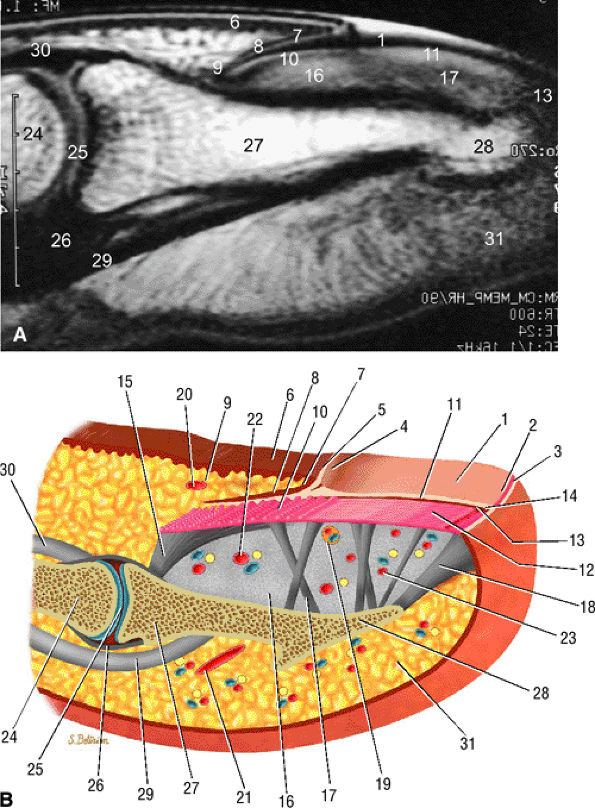 |
|
FIGURE 11.104 ● Sagittal anatomy of the nail unit. (A) T1-weighted image showing the surface of the nail plate (arrows) highlighted by petroleum jelly deposits. (B) Dorsal oblique view of the nail unit: 1, nail plate; 2, onychodermal band; 3, free edge of plate; 4, lunula; 5, cuticle; 6, proximal nail fold; 7, inferior aspect of proximal nail fold or eponychium; 8, proximal or dorsal nail matrix; 9, cul-de-sac; 10, intermediate or ventral nail matrix; 11, nail bed epithelium ridges; 12, nail bed corium; 13, hyponychium; 14, distal groove; 15, matrix phalangeal ligament; 16, submatrical hypersignal area; 17, network of collagenous fibers; 18, hyponychio-phalangeal ligament; 19, glomus body; 20, proximal dorsal arterial arch; 21, distal dorsal arterial arch; 22, distal matrix arterial arch; 23, nail bed arterial arch; 24, middle phalanx; 25, distal interphalangeal joint; 26, volar plate; 27, distal phalanx; 28, tuberosity of distal phalanx; 29, flexor digitorum profundus tendon; 30, terminal band of extensor tendon; 31, pulp.
|
 |
|
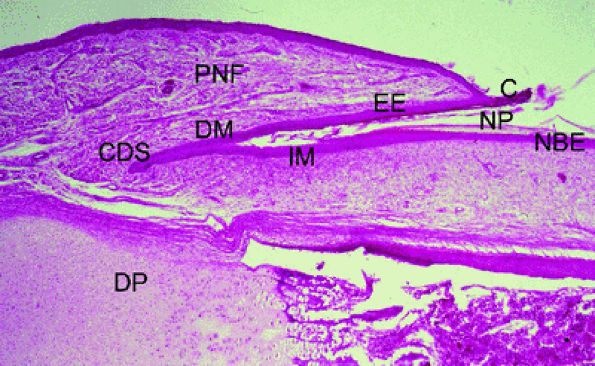
FIGURE 11.105 ● Photomicrograph of nail matrix in sagittal section with hematoxylin and eosin staining. PNF, proximal nail fold; EE, epithelium eponychium; C, cuticle; DM, dorsal matrix; IM, intermediate matrix; NBE, nail bed epithelium; CDS; matrix cul-de-sac; NP, nail plate; DP, distal phalanx.
|
 |
|
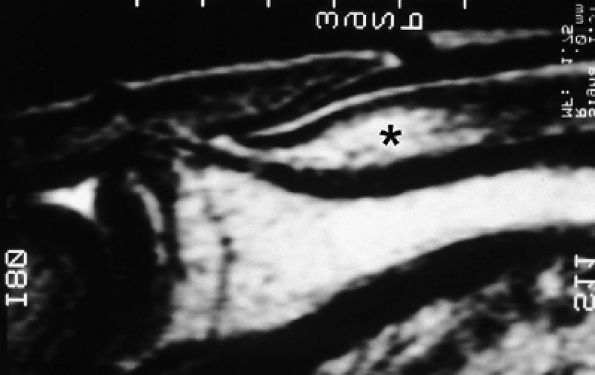
FIGURE 11.106 ● Submatrix area. Sagittal T2-weighted image depicting the oval shaped submatrix area (asterisk).
|
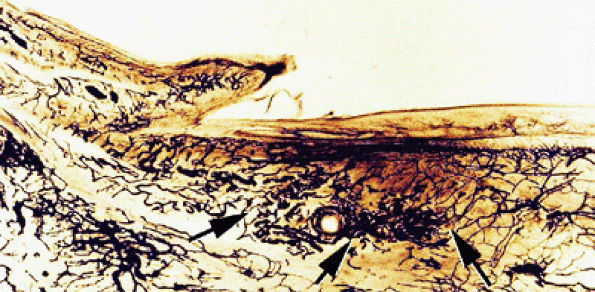
intensity. This heterogeneity is emphasized by the injection of gadolinium, which results in enhancement of the numerous glomus bodies of the nail bed (see Fig. 11.111; Fig. 11.112). Glomus bodies, which function as arteriovenous shunts, are highly concentrated in the fingertips, particularly beneath the nail plate.128 Each glomus body is a tiny encapsulated oval organ 300 μm long. The nail beds of fingers and toes contain 93 to 501 glomus bodies per square centimeter.
 |
|
FIGURE 11.107 ● Microvascularization of the submatrix area. Photomicrograph with transparency using the Spalteholz technique, vascular injection with gelatinous India ink. The vascular networks are more regular in the submatrix area (arrows) than in the nail bed.
|
 |
|
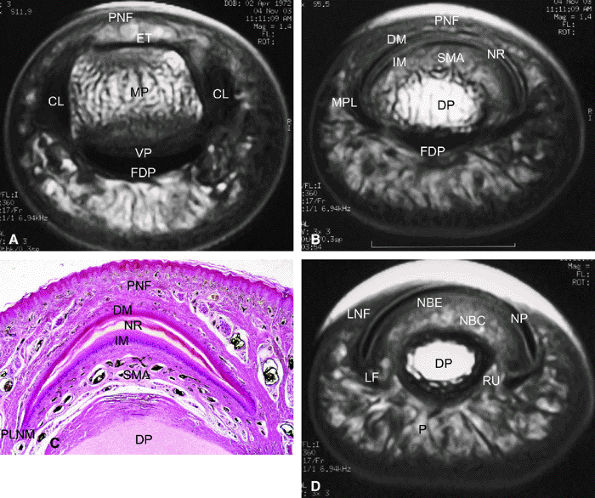
FIGURE 11.108 ● Axial anatomy of the nail unit. (A) Distal interphalangeal joint. (B) Matrix area. (C) Photomicrograph of the matrix area with hematoxylin and eosin staining. (D) Nail bed area. ET, extensor tendon; PNE, posterior nail fold; CL, collateral ligament; MP, middle phalanx; VP, volar plate; FDP, flexor digitorum tendon; MPL; matricophalangeal ligament; NR, nail root; PLNM, posterolateral corners of the nail matrix; SMA; submatrix area; DM; dorsal matrix; IM, intermediate matrix; DP, distal phalanx; P, pulp; LF, ligament of Flint; NBE, nail bed epithelium; NBC, nail bed corium; LNF, lateral nail fold; RU; rima ungualum.
|
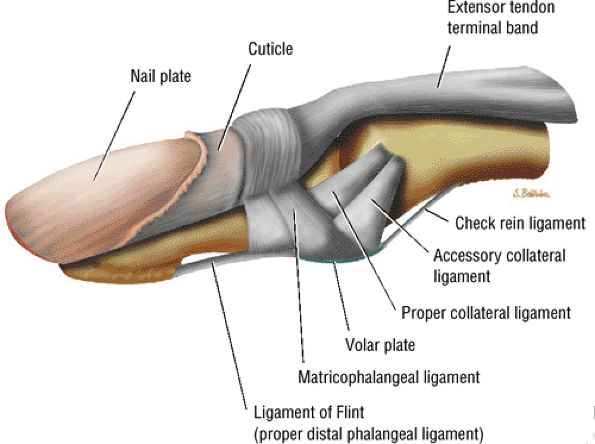 |
|
FIGURE 11.109 ● Ligaments of the distal interphalangeal joint.
|
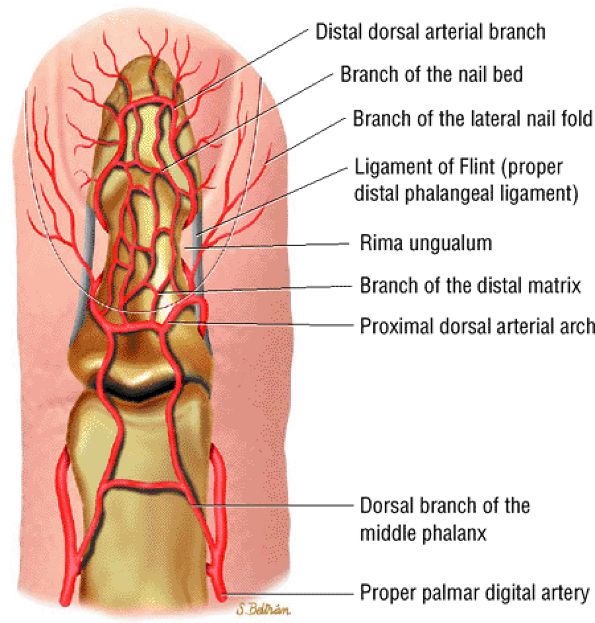 |
|
FIGURE 11.110 ● Dorsal aspect of the arterial supply of the fingertip.
|
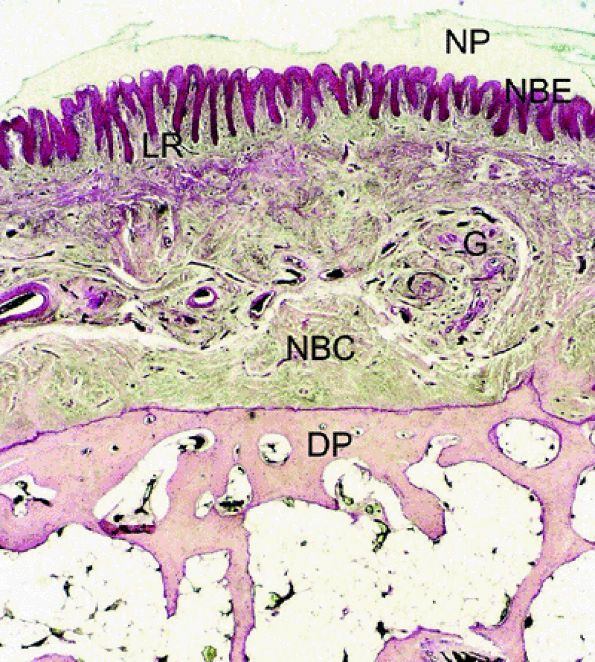 |
|
FIGURE 11.111 ● Photomicrograph of axial slice of the nail bed area with hematoxylin and eosin stain. The longitudinal ridges of the nail bed epithelium interdigitate with nail bed fibrocollagen. NP, nail plate; NBE, nail bed epithelium; G, glomus body; NBC, nail bed corium; LR, longitudinal ridges; DP, distal phalanx.
|
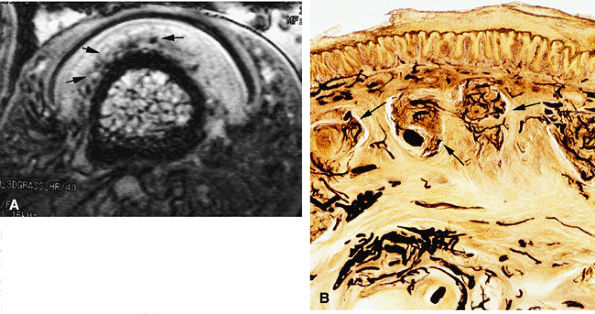 |
|
FIGURE 11.112 ● Glomus bodies. (A) Axial post-contrast 3D gradient-echo image of the nail bed showing multiple round foci representing glomus bodies (arrows). (B) Photomicrograph with transparency using the Spalteholz technique, vascular injection with gelatinous India ink, axial slice showing glomus bodies (arrows).
|
 |
|
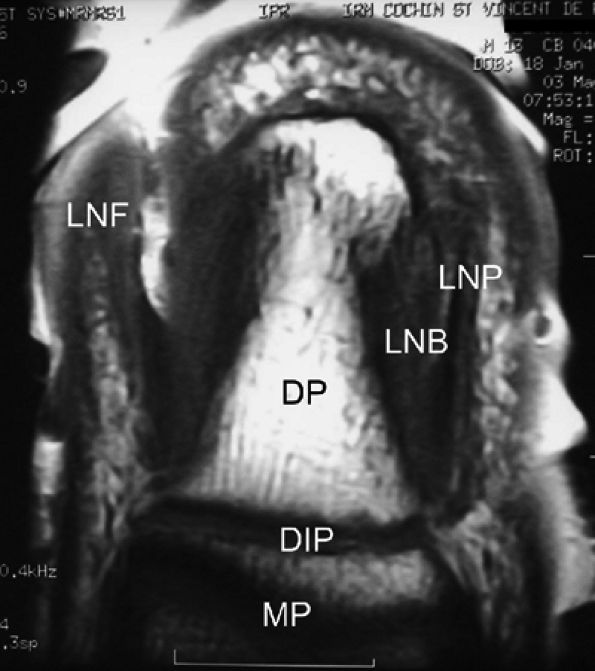
FIGURE 11.113 ● Coronal anatomy of the nail unit on T1-weighted images. MP, middle phalanx; DP, distal phalanx; DIP, distal interphalangeal joint; LNB, lateral nail bed; PNF, proximal nail fold; LNP, lateral border of nail plate.
|
 |
|
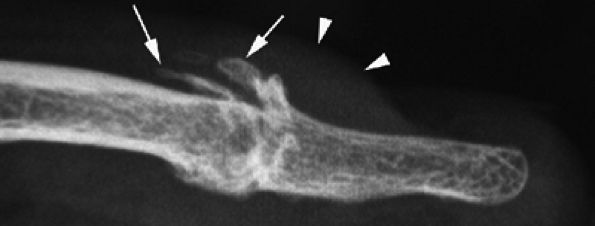
FIGURE 11.114 ● Mucoid pseudocyst. Lateral view radiograph showing distal interphalangeal joint osteoarthritis with dorsal osteophytes (arrows) and thickening of the posterior nail fold (arrowheads).
|
-
Thin regular walls
-
Low signal intensity on T1-weighted images
-
Very high signal on T2-weighted images
-
High-resolution MR images accurately display the relationship between the cyst and the DIP joint.
-
Sagittal images commonly show osteoarthritis of the DIP joint with joint effusion and dorsal osteophytes lifting up the terminal extensor tendon.
-
Fluid around the extensor tendon is a common associated finding.
-
Synovitis of the DIP joint is somewhat highlighted after IV injection of gadolinium.
 |
|
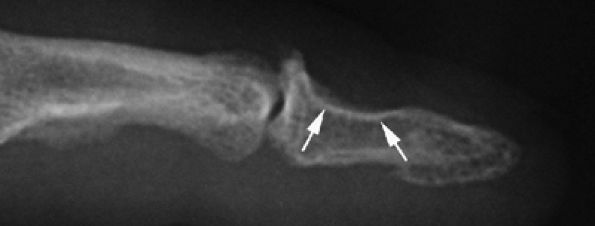
FIGURE 11.115 ● Mucoid pseudocyst. Lateral view radiograph showing distal interphalangeal joint osteoarthritis with bone pressure erosion (arrows) of the dorsal aspect of the distal phalanx.
|
 |
|
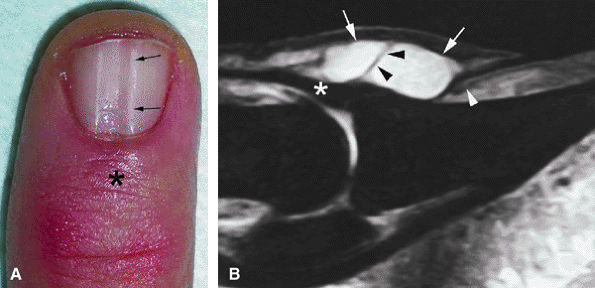
FIGURE 11.116 ● Mucoid pseudocyst. (A) PA view photograph showing thickening of the posterior nail fold (asterisk) and nail groove (arrows) on the midline due to matrix compression. (B) Sagittal STIR image displaying a bilobed cyst of the posterior nail fold (arrows) close to the insertion of the extensor tendon (asterisk). Note the intralesional septum (black arrowheads). The cyst causes deep displacement of the nail root (white arrowhead).
|
 |
|
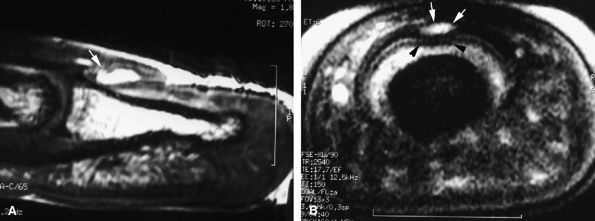
FIGURE 11.117 ● Mucoid pseudocyst. Sagittal (A) and axial (B) T2-weighted images depicting a small cyst (arrows) seated in the matrix cul-de-sac with compression of the dorsal and intermediate matrix (arrowheads).
|
 |
|
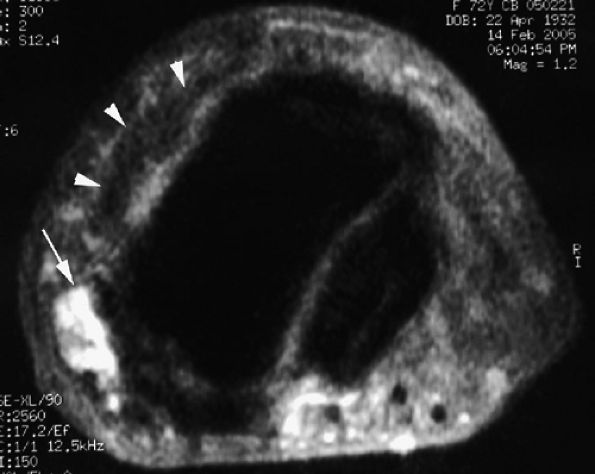
FIGURE 11.118 ● Peduncle of a mucoid pseudocyst. Axial STIR image shows a laterally located peduncle (arrow) beneath the insertion of the extensor digitorum tendon (arrowhead).
|
 |
|
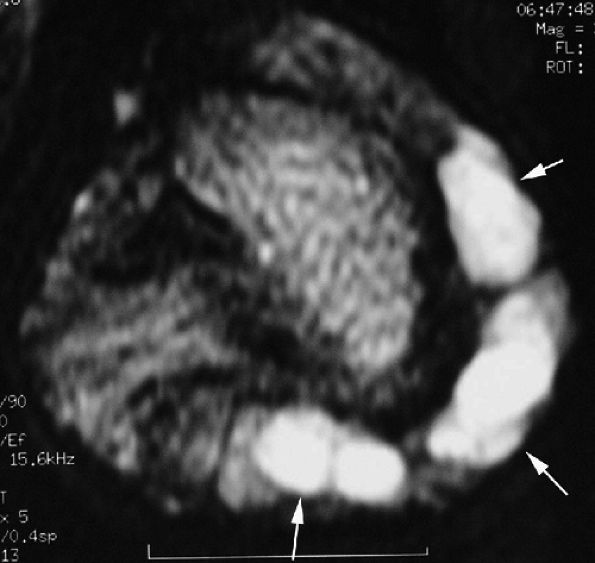
FIGURE 11.119 ● Multiple mucoid pseudocysts. Sagittal T2-weighted image shows multiple cysts in the posterior nail fold and the pulp (arrows).
|
 |
|
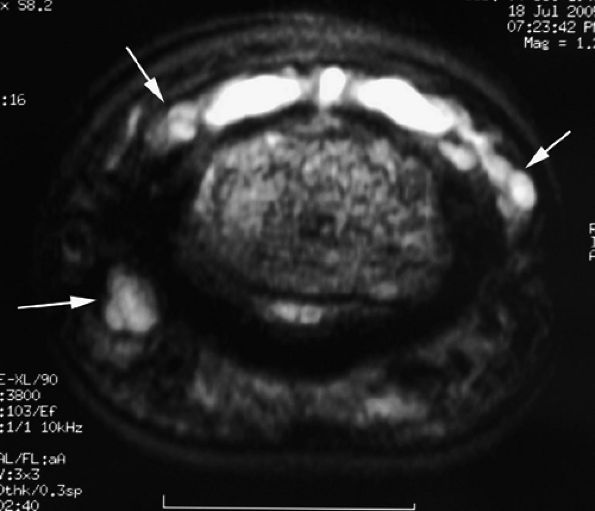
FIGURE 11.120 ● Overhanging multiloculated mucoid pseudocyst. Axial T2-weighted images show the cyst extending on both sides of the posterior nail fold (arrows) and the pulp (arrowhead).
|
 |
|
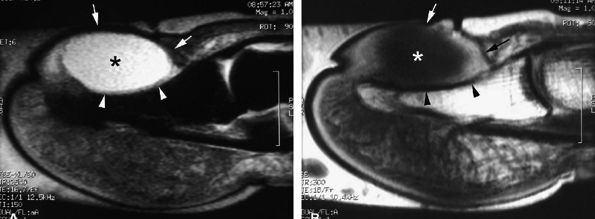
FIGURE 11.121 ● Subungual mucoid pseudocyst. Sagittal STIR (A) and post-contrast T1-weighted (B) images of a cyst seated in the nail bed (asterisks) with slight peripheral enhancement after contrast administration. The nail matrix and the nail bed (arrows) are lifted by the cyst. Slight pressure bone erosion of the distal phalanx (arrowheads) can also be seen.
|
 |
|
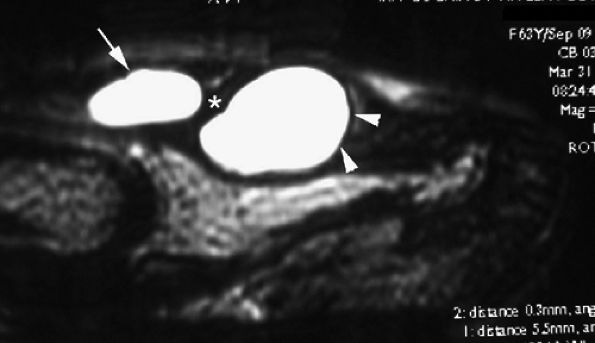
FIGURE 11.122 ● Subungual mucoid pseudocysts. Sagittal T2-weighted image of bilobed cysts. There is a proximal cyst in the posterior nail fold (arrow) and a distal cyst in the nail bed (arrowheads).
|
 |
|
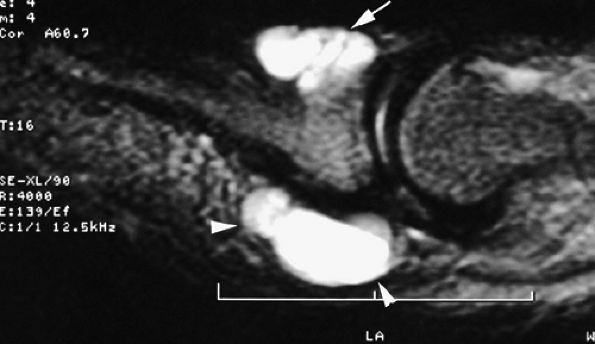
FIGURE 11.123 ● Subungual mucoid pseudocyst. Sagittal T2-weighted image of a subungual cyst (arrow) with extension toward the pulp (arrowheads).
|
 |
|
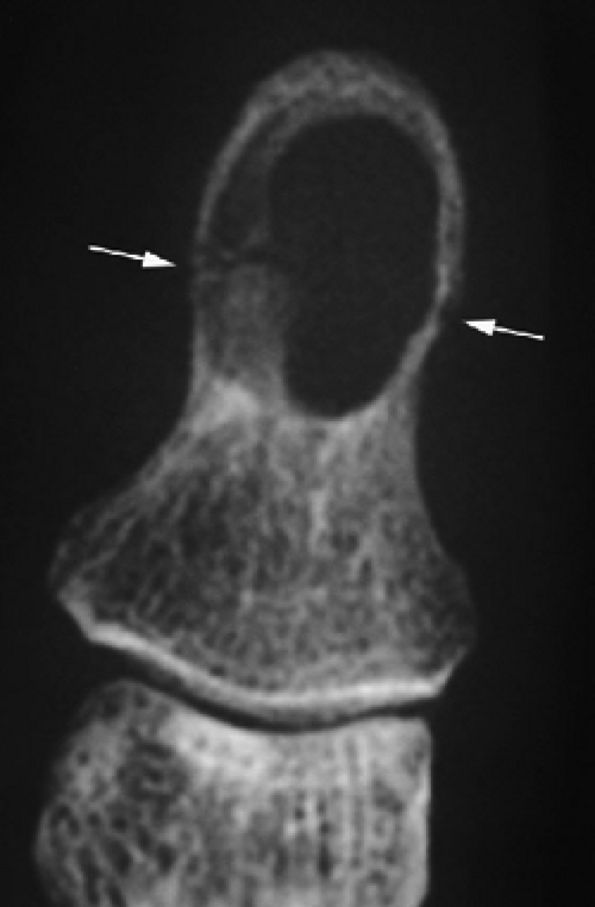
FIGURE 11.124 ● Epidermal inclusion cyst. PA view radiograph of fracture (arrows) of a clear-cut round erosion of the distal phalanx.
|
-
The vascular type is composed of numerous vascular lumens. Enhancement is very high after injection of gadolinium, and the signal is high on T2-weighted images.296 MR angiography shows early enhancement in the arterial phase that increases on the delayed venous acquisition (Fig. 11.128).297,298
-
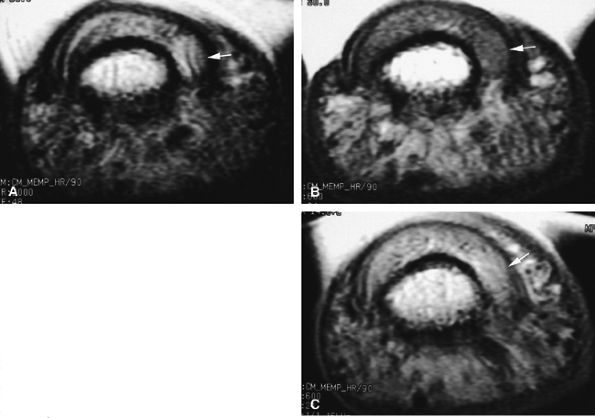
The cellular or solid type of glomus tumor is composed mainly of a proliferation of epithelioid cells (glomus cells) with a relative paucity of vascular lumens. This type of tumor is difficult to detect with MR imaging. Its signal is close to that of the normal dermis of the nail bed on all sequences (Fig. 11.129). Injection of gadolinium, even with MR angiography, is of little use. Using 3D gradient-echo imaging with thin contiguous slices is the most helpful by depicting a peripheral capsule or a slight bone erosion on the dorsal aspect of the phalanx.
-
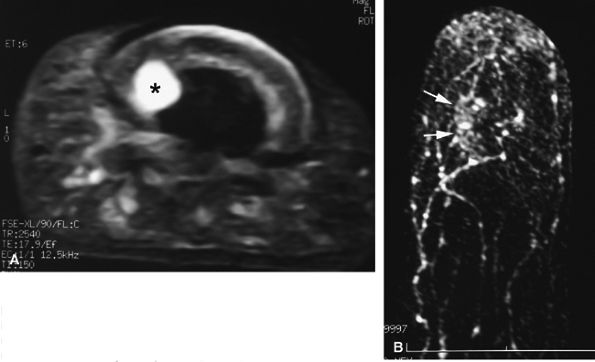
The mucoid type of glomus tumor is characterized by mucoid degeneration of the stroma, which demonstrates mild enhancement after gadolinium administration. On T2-weighted images it is seen with very high signal intensity because of the large amount of water in the stroma (Fig. 11.130). Recently it has been shown that this subtype of glomus tumor coexpresses alpha-smooth muscle actin and CD34 in neoplastic cells, an important finding regarding the differential diagnosis of these lesions and the relationship of perivascular neoplasms.299,300
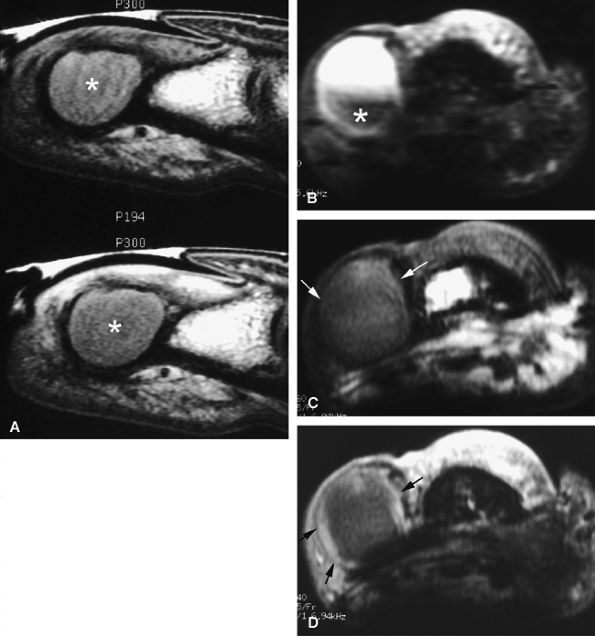 |
|
FIGURE 11.125 ● Epidermal inclusion cyst. (A) Sagittal T1-weighted images before and after injection of gadolinium show an expansile bone inclusion of the distal phalanx (asterisk) that does not enhance after contrast administration. (B–D) Postoperative epidermal inclusion cyst in a separate case. (B) Axial STIR image shows a cyst with variable signal and a low-signal component (asterisk). On axial T1-weighted images before (C) and after (D) injection of gadolinium, there is a thin rim of high signal intensity, identical to that of normal epidermis (arrows). No bone involvement is seen.
|
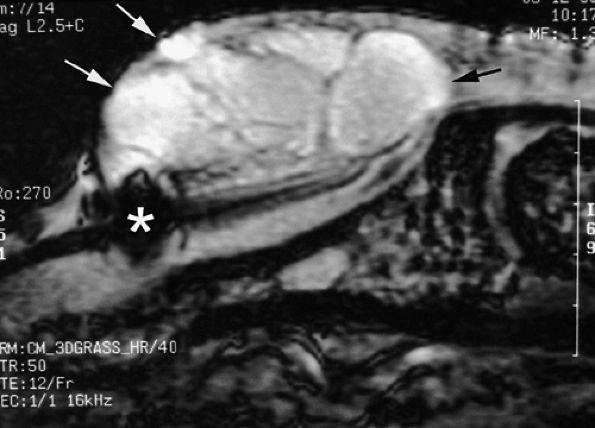 |
|
FIGURE 11.126 ● Epidermal inclusion cyst of the posterior nail fold. Sagittal 3D gradient-echo image displays a polylobed cyst of the posterior nail fold (arrows) with intralesional septa. Note the artifact (asterisk) from a previous trauma.
|
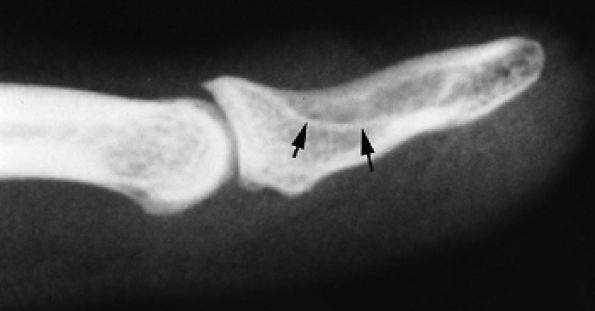 |
|
FIGURE 11.127 ● Glomus tumor of the fingertip. Lateral view radiograph showing bone pressure erosion (arrows) of the dorsal aspect of the distal phalanx beneath the matrix area.
|
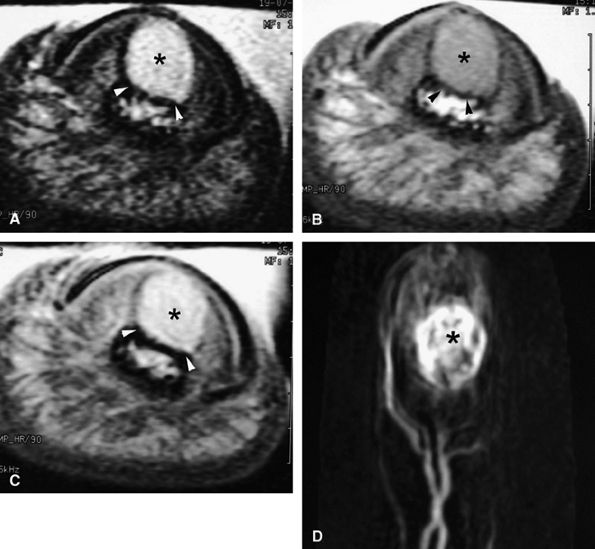 |
|
FIGURE 11.128 ● Vascular-type glomus tumor (asterisk) of the nail bed with the most common signal characteristics. (A) Axial T2-weighted image. T1-weighted images before (B) and after (C) injection of gadolinium. (D) MR angiogram. The tumor is located on the midline with an underlying bone erosion (arrowheads). The signal is high on T2-weighted images and slightly high on T1-weighted images. There is strong post-contrast enhancement on T1-weighted images and MR angiography.
|
 |
|
FIGURE 11.129 ● Solid-type glomus tumor. (A) Axial T2-weighted image. T1-weighted image before (B) and after (C) injection of gadolinium. The tumor is in the lateral part of the nail bed (arrows) and is faintly visible on all sequences.
|
 |
|
FIGURE 11.130 ● Mucoid-type glomus tumor. (A) Axial STIR image of a glomus tumor demonstrates very high signal in the lateral nail bed (asterisk). (B) On an MR angiogram, faint tumor enhancement is seen on delayed sequences (arrows).
|
 |
|
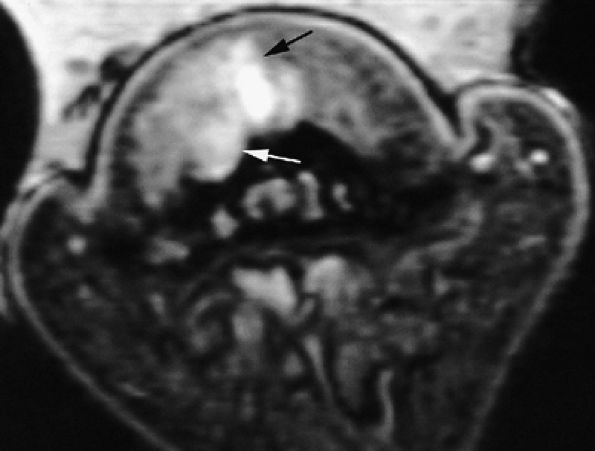
FIGURE 11.131 ● Mixed-type glomus tumor. Axial post-contrast 3D gradient-echo image of a glomus tumor shows a partial highly vascularized component close to the midline (arrows).
|
 |
|
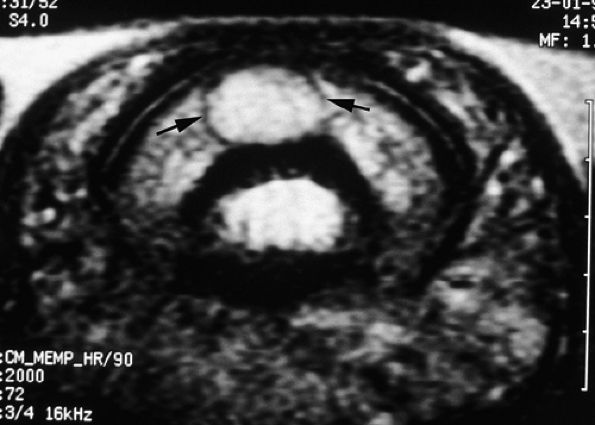
FIGURE 11.132 ● Peripheral capsule of glomus tumor. Axial T2-weighted image shows a peripheral capsule with a low signal (arrows).
|
 |
|
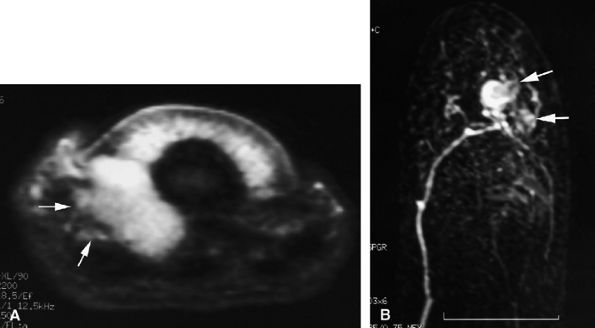
FIGURE 11.133 ● The ill-defined margins of a glomus tumor shown on (A) an axial STIR image and (B) an MR angiogram. On the axial STIR image, a glomus tumor of the lateral part of the nail bed is seen extending toward the pulp via the rima ungualum (arrows). The lateral borders are not well defined. On the MR angiogram, the tumor also displays poorly defined lateral borders with lateral and proximal extension (arrows).
|
 |
|
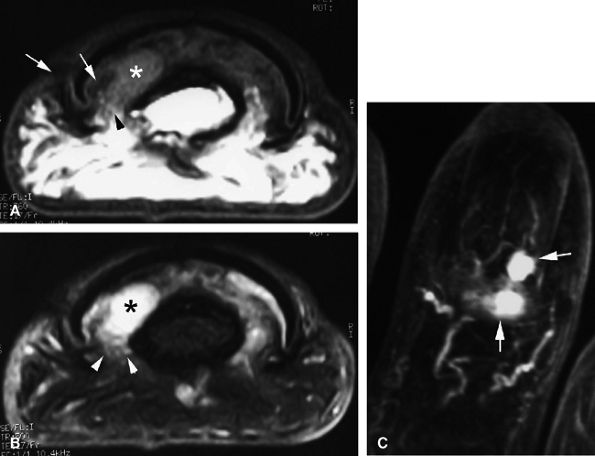
FIGURE 11.134 ● Postoperative recurrence of glomus tumor. Axial T1-weighted images before (A) and after (B) injection of gadolinium and (C) MR angiogram. Artifacts from the previous lateral surgical approach (arrows) can be seen, and there is tumor recurrence in the lateral part of the nail bed (asterisk). The lateral margins are blurred by scar tissue (arrowheads). On the MR angiogram, two contiguous tumors (arrows) can be seen. The proximal lesion displays ill-defined borders.
|
 |
|
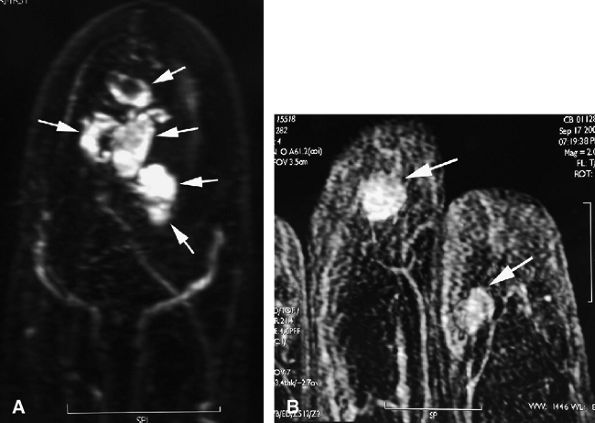
FIGURE 11.135 ● Multiple glomus tumors. (A) MR angiogram depicting five glomus tumors in the same fingertip (arrows). (B) MR angiogram in a separate case shows glomus tumors of the fingertips of two adjacent fingers (arrows).
|
 |
|
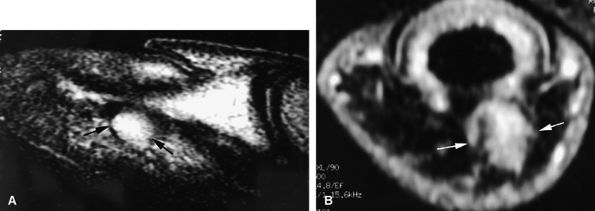
FIGURE 11.136 ● Glomus tumor, pulp location. (A) Sagittal T2-weighted and (B) post-contrast fat-suppressed T1-weighted images show a palmar glomus tumor of the fingertip (arrows). Fat suppression is necessary to detect the tumor enhancement.
|
tissue and tumor. On T1-weighted images the low-signal-intensity tumor is seen, surrounded by high-signal-intensity fat. After gadolinium administration, tumor enhancement is only visible on fat-suppressed images (see Fig. 11.136).
 |
|
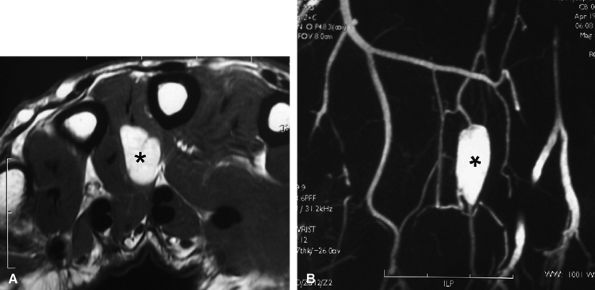
FIGURE 11.137 ● Glomus tumor, palmar location. (A) Axial post-contrast T1-weighted image and (B) MR angiogram of a glomus tumor located in the third intermetacarpal space (asterisks) between the interosseous and lumbrical muscles.
|
 |
|
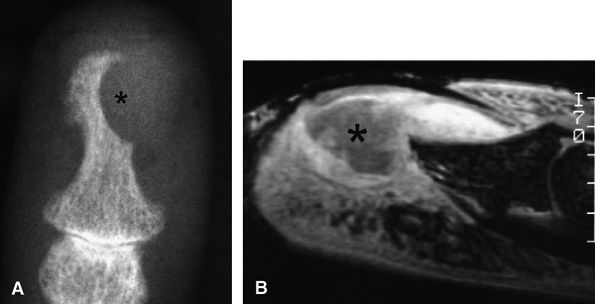
FIGURE 11.138 ● Keratoacanthoma. (A) PA view radiograph shows a well-defined lytic lesion of the distal phalanx (asterisk). (B) Sagittal post-contrast 3D gradient-echo image illustrates a deep infiltrating nodule with a central area of low signal (asterisk) invading the distal phalanx. The tumor borders are ill-defined and there is peripheral inflammation.
|
 |
|
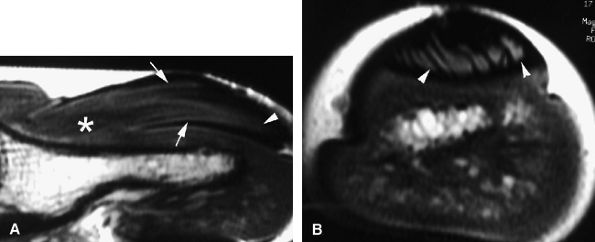
FIGURE 11.139 ● Onychomatricoma. Sagittal (A) and axial (B) T1-weighted images show the tumor core (asterisk) in the matrical area and invagination of the lesion into the funnel-shaped nail plate (arrows). Distal filamentous expansions (arrowheads) are better depicted on the axial image.
|
 |
|
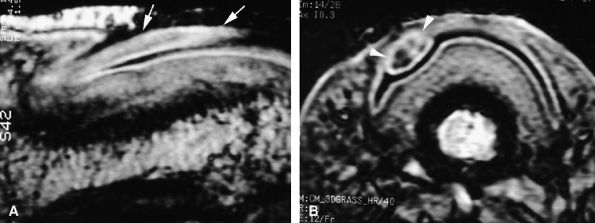
FIGURE 11.140 ● Fibrokeratoma. Sagittal (A) and axial (B) 3D gradient-echo images of a tumor involving the ventral aspect of the proximal nail fold with epithelial invagination (arrows), which is an incidental matrix producing a pseudonail of collagen. Overlying acanthotic epidermis displays signal intensity identical to that of normal epidermis (arrowheads).
|
acanthotic epidermis displays signal intensity identical to that of normal epidermis. On MR images displaying involvement of the ventral aspect of the proximal nail fold, epithelial invagination (see Fig. 11.140) may be visualized. This invagination acts as an incidental matrix and produces a pseudonail of collagen.
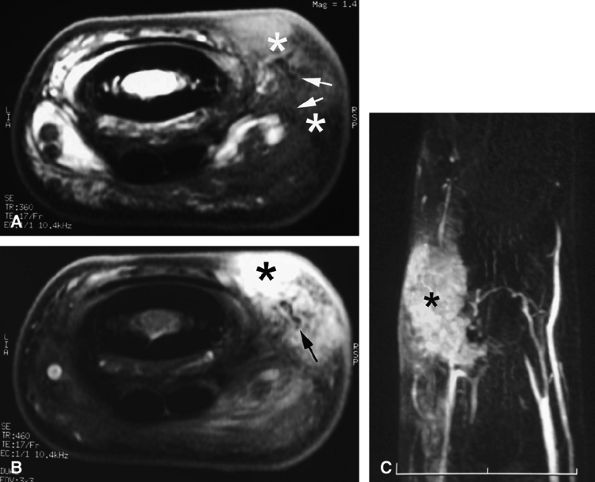 |
|
FIGURE 11.141 ● Knuckle pad. Axial T1-weighted image before (A) and after (B) injection of gadolinium. (C) MR angiogram. A knuckle pad is visualized as a highly vascularized dorsal mass (asterisk) infiltrating the lateral part of the extensor apparatus. Low-signal foci (arrows) are due to dense collagen areas.
|
is clearly influenced by genetic factors.330 Other significant risk factors include trauma and occupation. Incidence and severity are increased in women over 50 years of age, and multiple joints in the hand are likely to be involved. Clinical and radiologic findings are specific.331 The most frequently affected joints in the hand are the interphalangeal joints of the long fingers and thumb. Both PIP and DIP joints are often involved simultaneously, but isolated lesions of the DIP joint are not uncommon. In contrast, the MCP and PIP joints are the most commonly affected in rheumatoid arthritis. OA of the fingers may also be secondary to crystal-induced arthropathies, with a predilection for the second and third MP joints.
-
Cartilage loss
-
Bone edema
-
Synovial enhancement
-
Osteophytosis
-
Erosions
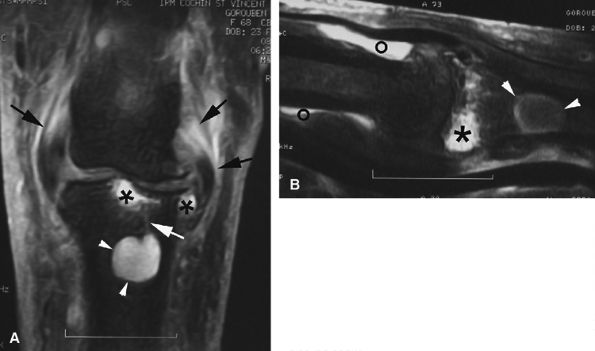 |
|
FIGURE 11.142 ● Osteoarthritis of the PIP joint on (A) a coronal proton density fat-suppressed image and (B) a sagittal post-contrast fat-suppressed T1-weighted image. Erosive osteoarthritis with foci of subchondral bone edema (asterisks), a bone cyst (arrowheads), and capsuloligamentous thickening (black arrows) are seen. A possible thin channel between the cyst and the joint (white arrow) or diffuse synovitis (small circles) may also be seen.
|
ossification.331 Osteophytes contain bone trabeculae and bone marrow and are usually covered with cartilage. Stress at the capsular insertions may lead to the development of capsular osteophytes along the direction of capsular pull. Dorsal osteophytes of the DIP joint may be large and aggressive, affecting the extensor tendon and generating a mucoid pseudocyst (see Fig. 11.114).271
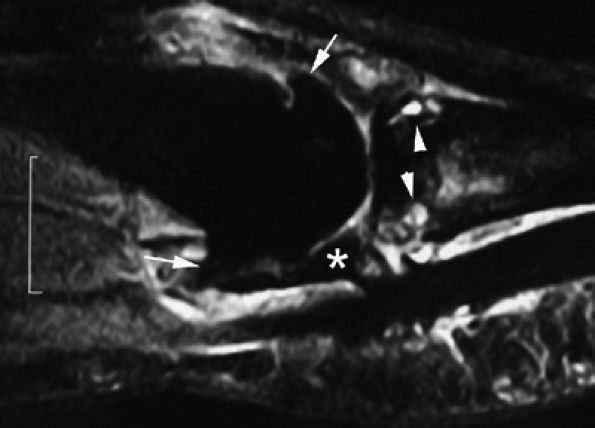 |
|
FIGURE 11.143 ● Osteoarthritis of the MP joint. Sagittal STIR image showing marginal osteophytes (arrows), subchondral bone edema (arrowheads), and degenerative lesions of the volar plate (asterisk) with irregular narrowing.
|
-
Synovitis is assessed in three wrist regions and in each MP joint. The first carpometacarpal and first MP joints are not scored. The scale is 0 to 3'0 is normal; 1 to 3 (mild, moderate, severe) is determined by thirds of the
P.1925
presumed maximum volume of enhancing tissue in the synovial compartment. -
Bone erosions are scored separately for each bone (wrist, metacarpal bases, MP joints'metacarpal heads and phalangeal bases). The scale is 0 to 10, based on the proportion of eroded bone compared to the “assessed bone volume,” judged on all available images. A score of 0 is no erosion; 1 is 1% to 10% of bone eroded; 2 is 11% to 20% of bone eroded; and so forth. For long bones, the “assessed bone volume” is from the articular surface (or its best estimated position if absent) to a depth of 1 cm.
-
Bone edema is also scored separately for each bone. The scale is 0 to 3 based on the proportion of bone with edema. A score of 0 is no edema; 1 is 1% to 33% of bone is edematous; 2 is 34% to 66% of bone is edematous; and 3 is 67% to 100% of bone is edematous.
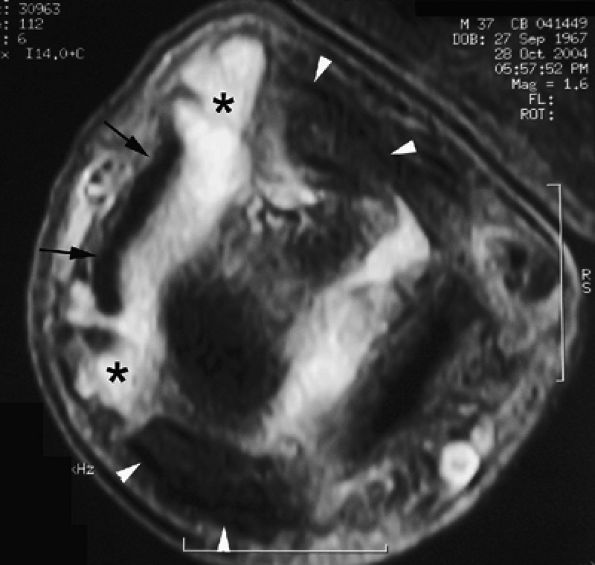 |
|
FIGURE 11.144 ● Heberden's nodes. Axial proton density fat-suppressed image shows capsulosynovial herniation (asterisks) through the space between the extensor tendon (arrows) and the collateral ligaments (arrowheads).
|
-
Imaging in two planes (two 2D sequences or one 3D isometric sequence) with T1-weighted images before and after IV gadolinium injection
-
T2-weighted fat-saturated sequence or a STIR sequence (Fig. 11.145).
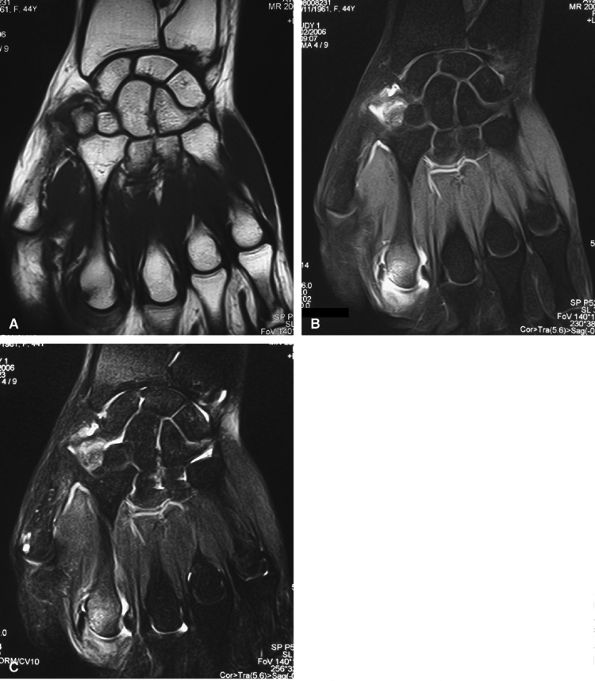 |
|
FIGURE 11.145 ● Rheumatoid arthritis MR scoring. Coronal T1-weighted image before (A) and after (B) injection of gadolinium with fat suppression. (C) T2-weighted image with fat suppression. A large field of view is needed to assess both the wrist and the metacarpophalangeal joints. Additional axial T1-weighted images are also necessary.
|
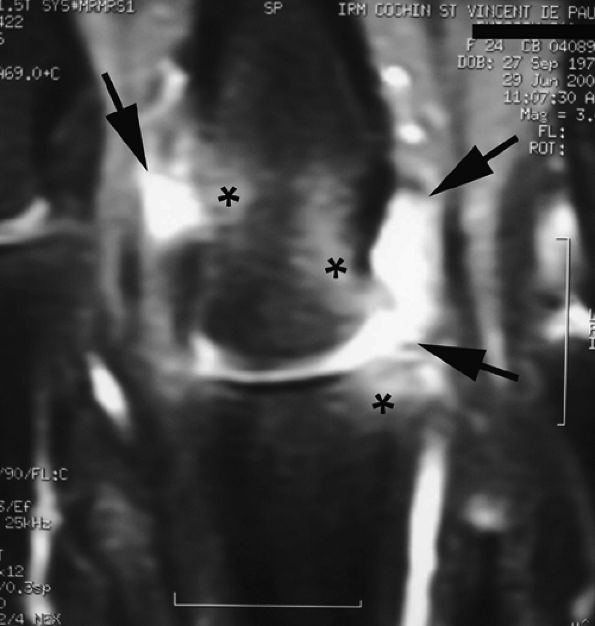 |
|
FIGURE 11.146 ● Pre-erosive inflammatory arthritis of the metacarpophalangeal joint. Coronal post-contrast fat-suppressed T1-weighted image showing enhanced synovium (arrows) and associated bone edema (asterisks).
|
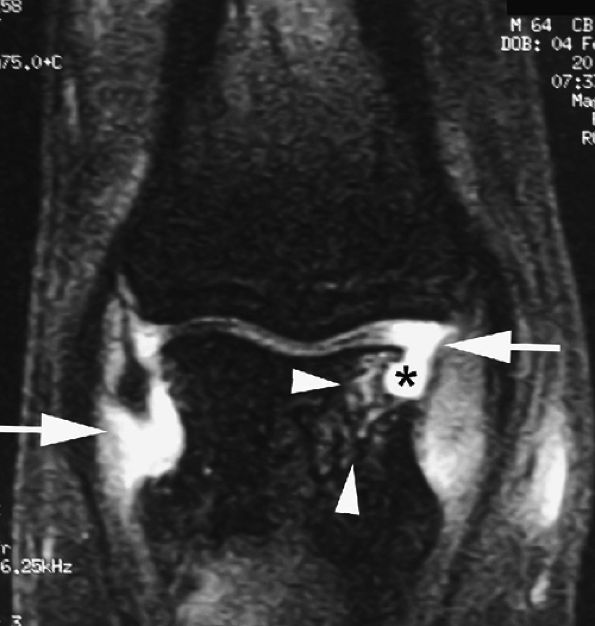 |
|
FIGURE 11.147 ● Erosive inflammatory arthritis of the PIP joint. Coronal post-contrast fat-suppressed T1-weighted images display enhanced synovium (arrows) and bone erosion (asterisk) with underlying bone edema (arrowheads).
|
-
Active inflammatory pannus (destructive and extensive enhancement)
-
Moderately active pannus (homogeneous enhancement confined to bone erosions)
-
Inactive fibrous pannus (low signal on all sequences).364 Although fibrotic pannus may enhance, it does so with lower levels and on delayed images.365,366,367

