
differences in anatomical structure, motor control patterns, and
pathological or chronological changes, each person’s gait pattern is
unique. However, because everyone has the same basic anatomic and
physiological makeup, human locomotion occurs in a similar manner for
everyone. The cyclical and highly automated movement pattern during
human locomotion involves rhythmic, alternating motions of the trunk
and extremities. This movement pattern provides a unique characteristic
of limb movement that can be studied with a high degree of accuracy.
This specific branch of biomechanics is defined as gait analysis—a
quantitative description of human locomotion.
spanning many disciplines. In the field of medicine, motion analysis
studies are fundamental to understanding the mechanics of normal and
pathological movement. This information is useful for the diagnosis and
treatment of patients with motor deficiencies. Others in the field of
medicine use human models for the development of functional electrical
stimulation protocols to restore mobility to paralyzed individuals.
Sports medicine physicians also use motion analysis to test strategies
for optimizing various sports movements. Clearly motion analysis
techniques have widespread applications in medicine.
information that can be used as a basis for appropriate therapeutic
intervention, as well as to objectively evaluate the effectiveness and
efficacy of treatment methods. Clinical gait analysis is used to
quantify the mechanics of walking and to identify deviations in normal
movement. The causes of abnormal movement can then be distinguished
from
compensations in order to provide appropriate treatment
recommendations. The ability to objectively quantify movement patterns
is critical for prescribing specific treatment modalities. The focus of
this chapter is on the methods for objective assessment of human
movement. This chapter discusses available measurement technology and
application of this technology for clinical treatment planning and
assessment.
a student of Galileo, was among the first scientists to analyze motion
while developing his theory of muscle action based on mechanical
principles. The quantitative study of human locomotion began in the
nineteenth century. Duchenne conducted the first scientific systematic
evaluation of muscle function. His findings were published in the
monumental work, Physiologie des Mouvements, published in 1867. Leland Stanford, governor of California and horse breeder, hired Eadweard Muybridge in 1872
to determine whether a trotting horse had all four feet off the ground
at any instant in time. Muybridge placed cameras at regular intervals
along a race track. Thin threads stretched across the track triggered
the shutters. The horse’s hooves triggered cameras in order, and a
series of photographs clearly depicted the gait sequence. Muybridge
subsequently compiled a detailed photographic expose of human and
animal locomotion, which was published in three volumes (original work
published in 1887).
became interested in measuring the motion of human body segments. They
placed Geissler tubes, containing a rarified nitrogen gas, on various
limb segments of a human subject dressed in black. Electrical circuits
connected to the tubes created incandescence, and cameras recorded the
illuminated tubes as the subject walked. Experiments were carried out
at night because there was no means to darken the room in which studies
were performed. It took 10 to 12 hours to put this apparatus on the
subject, whereas data collection was completed in minutes using four
cameras. The images were digitized using a precision optical device.
Coordinate geometry was used to extract three-dimensional coordinates.
Equations needed to calculate resultant forces and moments at the
joints of a 12-segment rigid body model were formulated. Their
quantitative results were published in 1895 and are still valid today.
recordings with electromyography (EMG) in the mid-1900s. Their
pioneering work in limb prosthetic research laid the foundation for
modern gait analysis. Their accumulated experience was published in
1981 as a textbook, Human Walking, which represents the seminal textbook in the field.
into developing the needed technology for human movement analysis.
Automated movement tracking systems have replaced hand digitization.
Advances in the aerospace industry have been utilized for the
development of force plates for kinetic analysis. Computerized
electromyography systems have replaced hand palpation. Currently, the
technology and knowledge for gait analysis has advanced to a level that
permits rapid analysis. Gait analysis laboratories now exist in many
different centers, and gait analysis is used for orthopedic surgery,
clinical rehabilitation, sports medicine, and industrial ergonomics.
simplest form of gait analysis is observational gait analysis. A
systematic approach for observational gait analysis was developed at
the Rancho Los Amigos Medical Center in Downey, California. An
experienced observer can detect many gait deviations during both stance
and swing phases. However, an obvious limitation of observation in gait
analysis is the difficulty of observing multiple events and multiple
body segments interacting concurrently. Further, it is not possible to
visualize the location of force vectors in space or electromyographic
activity of muscles. Events happening faster than

of a second (83 ms) cannot be perceived by the human eye. More
consistent observations are obtained when motion videotapes are
reviewed in slow motion. Three expert observers rated video footage of
15 children who had lower limb disability and wore braces. Pearson’s
correlation coefficient was 0.6 within observers
and less between observers. Thus, observational gait analysis is a convenient, but only moderately reliable technique. Saleh and Murdoch (1985)
utilized experienced observers to study the gait of transtibial
amputees. The prosthetic limbs of the amputees were intentionally
misaligned in the sagittal plane. The agreement of experienced
observers with a biomechanical model was 22%. In a similar study, 54
licensed physical therapists with varying amounts of clinical
experience rated three patients with rheumatoid arthritis. Generalized
Kappa coefficients ranged from 0.11 to 0.52 indicating that clinician
assessments are only slightly to moderately reliable. Thus, it is easy
to see that limitations in observational gait analysis can lead to
misinterpretation of the patient’s locomotion capabilities. Hence, it
is important to utilize advances in gait analysis techniques to more
precisely quantify the patient’s functional status. Extensive
instrumentation has been developed for recording the various parameters
used to describe gait.
segments are studied as rigid links moving through space. These rigid
links are assumed to be interconnected through a series of frictionless
joints. Measurement systems that are aimed at capturing the spatial
trajectories of body segments usually involve a camera system or an
electromagnetic system that tracks a series of body-fixed markers.
coordinate systems affixed to each body segment, whose axes define the
position of these body segments. With a camera-based system, either
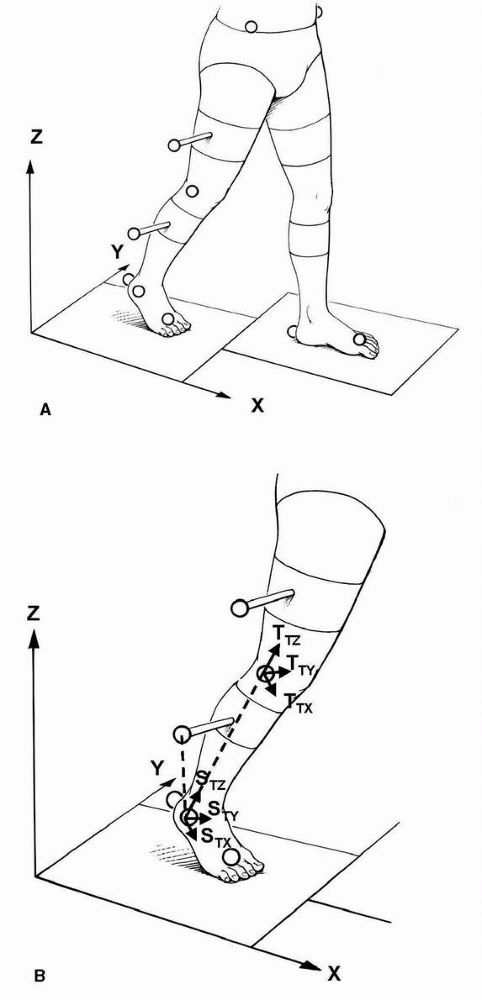
passively reflective or actively illuminated markers are used (Figure 3-1A).
These markers are commonly attached to the subjects as either discrete
points or rigid clusters with multiple markers on each cluster.
Placement of these external markers on the surface of the body segments
are aligned with particular bony landmarks. As the patient walks along
a marked walkway, the cameras track and record the marker trajectories.
Using stereophotogrammetric principles, the planar projections of
markers viewed by each camera are used to reconstruct the
three-dimensional instantaneous position of the markers relative to an
inertially fixed laboratory coordinate
system.
If the position of at least three noncolinear points fixed to the body
segment can be obtained (and the body segment is assumed to be rigid),
then the 6 degrees of freedom associated with the position and
orientation of each segment can be obtained. Initially, a body-fixed
coordinate system is computed for each body segment (Figure 3-1B). For instance, consider the markers on the shank at an instant in time. A vector, STZ,
can be formed from the lateral malleolus (B) to the lateral knee marker
(A). Another vector can be formed from the lateral malleolus to the
marker on the shank wand (C). The vector cross-product of these two
vectors is a vector STX, which is perpendicular to the plane containing all three markers. The unit vector, STY, may be determined as the vector cross-product of STZ and STX. Thus, the vectors STX, STY, and STZ
form an orthogonal body fixed coordinate system, called a technical
coordinate system. In a similar manner, the marker based or technical
coordinate system may be calculated for the thigh, that is, TTX, TTY, and TTZ.
These segments are linked and thus lack independence of movement.
Hence, their points of attachment, that is, the joints, are the points
of principal kinematic significance. Once the position of adjacent limb
segments has been determined, it is possible to determine the relative
angle between adjacent limb segments in three dimensions. This assumes
that the technical coordinate systems reasonably approximate the
anatomical axes of the body segments, for example, TTZ approximates along axis of the thigh and STZ
approximates along the axis of the shank. A more rigorous approach
adapts a subject calibration procedure to relate the technical
coordinate systems with pertinent anatomical landmarks. Additional data
can be collected that relates the technical coordinate system to the
underlying anatomical coordinate system. The subject calibration is
performed as a static trial with the subject standing. Additional
markers are typically added to the medial femoral condyle and the
medial maleolli during the static calibration trial. These markers
serve as anatomical references for the knee axis and ankle axis. The
hip center location is estimated from markers placed on the pelvis. The
technical coordinate system is then transformed into alignment with the
anatomical coordinate system for each limb segment, for example, SAX, SAY, SAZ (Figure 3-1C).
The marker system is coupled to a biomechanical model. Once the
position of adjacent limb segments has been determined (and each body
segment is assumed to be rigid), it is possible to determine the
relative angles between adjacent limb segments in three dimensions.
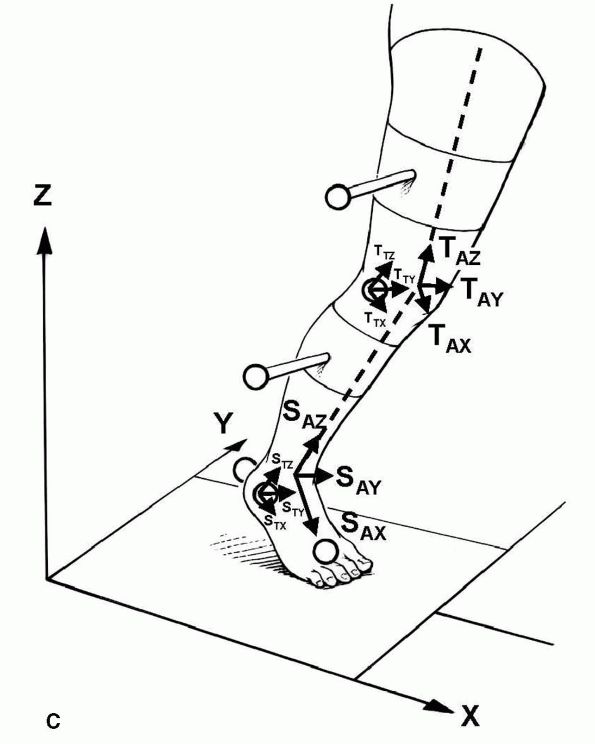
Motion measurements are made in reference to the joint centers. The
Euler/Cardan system is the most commonly used method for describing
three-dimensional motion (Figure 3-2). It describes angular motion as a sequence of ordered
rotations about the axes of the Cartesian coordinate system. Although
the rotations are sequence dependent, the Cardan angle description
defines relative joint motion in a manner that is physically meaningful
and clinically relevant.
 |
|
FIGURE 3-1. Body-fixed reflective markers used for establishing anatomical coordinate systems. (A)
Video camera motion measurement systems calculate the location of external markers placed on the body segments and aligned with specific bony landmarks. (B) A body-fixed external coordinate system is then computed from three or more markers on each body segment. (C) Subsequently, a subject calibration relates the external coordinate system with an anatomical coordinate system through the identification of anatomical landmarks, for example, the medial and lateral femoral condyles and medial lateral malleoli. |
 |
|
FIGURE 3-1C. (Continued)
|
 |
|
FIGURE 3-2.
Description of knee joint motion using Eulerian angle system. An axis fixed to the distal femur defines flexion-extension motion, Φ. An axis fixed to proximal tibia along its anatomical axis defines internal-external rotation, Ψ. A floating axis is orthogonal to the other two axes and used to measure abduction-adduction, Θ. (Reproduced with permission from Chao, 1980) |
industry that will have future applications in the biomechanics field.
Computerized motion analysis systems have been developed that provide
marker trajectory data in real time. These systems are now available
for applications in biomechanics. These applications make it possible
to obtain results of gait analysis studies much faster and will make
gait analysis much more clinically available.
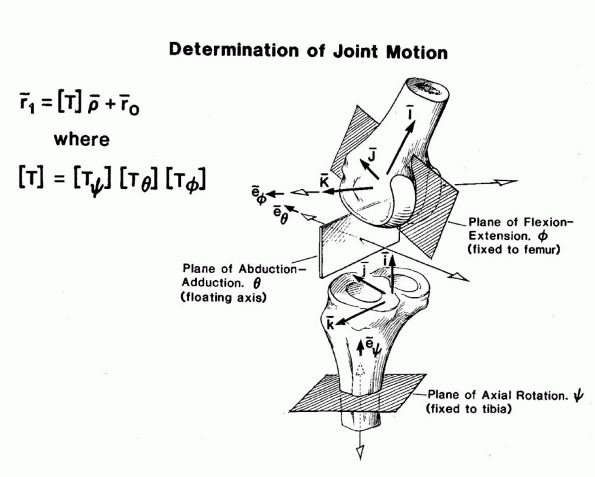
human motion is an electromagnetic tracking system. Electromagnetic
systems detect the motion of sensors placed on each segment using an
electromagnetic field. A three-axis magnet dipole source and a
three-axis magnetic sensor are used (Figure 3-3).
The excitation of the source and the resulting sensor output are
represented as vectors. The source excitation pattern is composed of
three sequential excitation states, each of which produces an
excitation vector that is linearly independent of the other two. The
sensor is connected to a system controller through a cable. The sensor
outputs are pre-amplified, multiplexed, and transmitted to a system
electronics unit. The resultant set of three sensor output vectors
contains information sufficient to determine both the position and
orientation of the sensor relative to the source. Thus, these systems
can provide real-time 6 degree-of-freedom movement data. The use of
this equipment is growing in areas of human motion analysis. The
instrumentation is simple to use and is insensitive to limb
interference. The limitations are the sampling frequency and the
sensitivity to magnetic interference from nearby ferromagnetic metallic
structures such as a total joint replacement. Nonetheless, as these
electromagnetic system capabilities increase, it is expected that these
devices will be used more frequently for movement analysis.
 |
|
FIGURE 3-3.
System block diagram of an electromagnetic tracking system. The 3-axis magnetic source emits three sequential excitation states that are picked up by the 3-axis magnetic sensor. The resultant set of sensor excitation vectors is used to calculate the position and orientation of the sensor relative to the source. |
cause the observed movement and the assessment of their effect on
locomotion (kinetic analysis). Kinetics is the branch of mechanics
focusing on the forces and moments transmitted across the joints of the
body. Forces acting on the human body can be divided into internal and
external forces. The external forces represent all physical
interactions between
the
body and the environment. These forces include gravitational, ground
reaction forces, and inertial forces. The internal forces are those
transmitted by body tissues that include muscular forces, ligament
forces, and forces transmitted through joint contact.
movements, force plates simultaneously measure the force generated by
the interaction of the foot with the ground. This resultant force is
referred to as the ground reaction force (GRF). Current force plates
typically use strain gauge or piezoelectric transducers. These devices
are embedded in the walkway of the laboratory and measure the magnitude
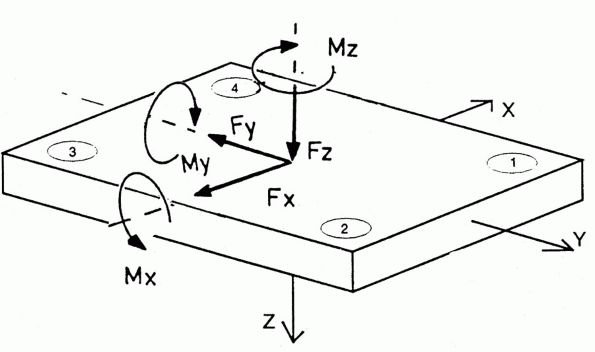
and direction of the resultant GRF applied to the foot by the ground (Figure 3-4).
The GRF vector is three dimensional and consists of a vertical
component plus two shear components acting along the force plate
surface. The shear forces are applied parallel to the ground and
require friction. These shear forces are usually resolved in the
anterior-posterior and medial-lateral directions. An additional
variable, the center of pressure, is needed to define the location of
this GRF vector. The center of pressure is defined as the point about
which the distributed force has zero moment when applied to the foot.
It is found by determining the line of action of the forces measured by
the platform and calculating where that line intersects the surface of
the force platform.
Newton’s second law to calculate the intersegmental forces and moments
causing motion (Figure 3-5). The process of
proceeding from known kinematic data and external forces to obtain
intersegmental joint forces and moments is called the inverse dynamics
approach. The gravitational forces acting on each body segment are
determined from the relevant mass and location of the center of mass
for each segment. These quantities are calculated along with the
segmental mass moments of inertia using prediction techniques from
anthropometric dimensions. The inertial forces are obtained from
calculations of angular and linear position, as well as velocity and
acceleration of the body segments with respect to either a fixed
laboratory coordinate system or referenced to another body segment
using kinematic data. This information is then combined to solve the
inverse dynamics problem (Figure 3-6). Joint
power may also be calculated. This data provides an understanding of
the subtle musculoskeletal adaptations, which are utilized by patients
to maintain dynamic balance during gait. Kinetic data is available at
the hip, knee, and ankle joint. When the position of this force line
with respect to joint center has been established by combining force
and movement data, the extrinsic joint moment, which is the product of
lever arm and the ground reaction force, plus gravity and inertia is
calculated. This moment is of great importance because the lower
extremity muscles act during load bearing. Thus, the external moment
defines the requirements for intrinsic (muscle) force. For example,
when the force line falls behind the knee joint center, quadriceps
muscle
action
is required to prevent knee collapse, and when the force line falls in
front of the knee, extensor muscle force is not needed. When surgical
intervention or nonsurgical treatment such as an orthoses is prescribed
for a patient, the kinetic parameters offer insight into the treatment
effectiveness.
 |
|
FIGURE 3-4.
A force plate is used to measure the location and magnitude of the ground reaction force. Transducers are located in the four corners of the plate. The ground reaction force is divided into three force (Fx, Fy, Fz) and three moment (Mx, My, Mz) components. Fx and Fy are shear forces. Fz is the vertical force. Some force plates only measure the moment around the vertical axis, that is, Mz. This assumes that no tensile forces are imposed on the force plate; that is, the foot does not stick to the plate. Under this assumption, the other moments are zero. |
 |
|
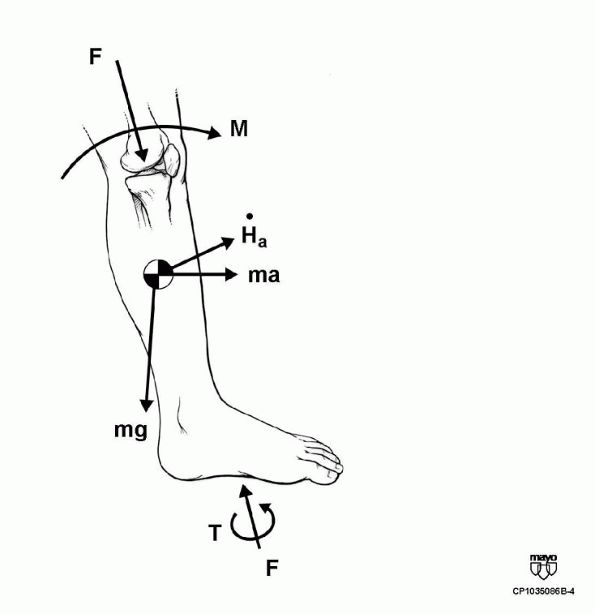
FIGURE 3-5.
The joint dynamics, which include the intersegmental forces and moments, are computed through the use of Newtonian mechanics. The computation accounts for the external loads applied at the foot, for example, the ground reaction forces, F and T, the weight of the limb segment, mg, and the inertial loads, ma and Ha, in order to calculate the intersegmental force, F, and moment, M. |
 |
|
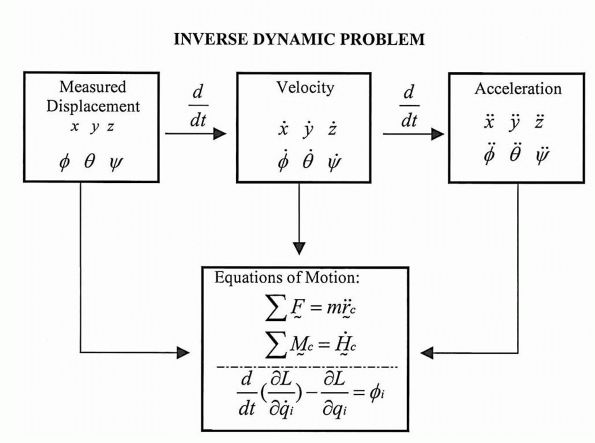
FIGURE 3-6.
Solution process for inverse dynamics problem. Displacement information must be differentiated twice to yield acceleration. Either Newtonian or Lagranian formulations can be used to formulate the equations of motion. |
external joint forces are balanced by the internal joint forces. The
measurement of internal forces requires sophisticated techniques that
are invasive. Analytical procedures have been developed for estimating
internal joint forces. These analytical approaches use classical
mechanics and mathematical optimization routines. These analytical
approaches require the use of simplifying assumptions about the
mechanical structure and knowledge of muscle physiology principles.
Thus, the accuracy of the analytical predictions depends not only on
the quality of the input data but also on the validity of the
assumptions. In general, it is necessary to evaluate the estimated
quantities by comparing them with experimental observations. Typically,
electromyographic data is obtained to provide information regarding
muscle activation patterns.
activity during muscle contraction. Neuromuscular coordination is
required to adjust the varying muscular and ligamentous forces
interacting with the abundant degrees of freedom in the joints and
other parts of passive locomotive system to obtain dynamic balance
during gait. Electromyographic data is useful to provide information
about the timing of muscle activity and the relative intensity of
muscle contraction. Both surface and fine-wire electrodes have been
used for gait kinesiologica EMG. Each type of electrode has its
advantages and disadvantages. Surface electrodes are convenient, easy
to apply to the skin, and do not cause irritation or discomfort to the
subject. However, they pick up signals from other active muscles in the
general area of application. This feature makes surface electrodes the
ideal choice for analysis of global activity in superficial muscles or
muscle groups. In addition, surface electrodes are sensitive to
movement of the skin under the electrodes and have poor specificity.
They are influenced by significant muscle “cross-talk,” in which the
electrode signals of one muscle interfere with the signals from
another. Thus, the activity of adjacent muscle groups can interfere and
lead to false results. However, a double differential technique has
been shown to reduce cross-talk in surface EMGs. The major advantage of
fine-wire electrodes is selectivity to measure the activity of specific
muscles. The influence of electrical activity of nearby muscles is
greatly reduced. Nonetheless, a number of disadvantages are associated
with fine-wire electrodes. Patient discomfort on insertion, the
difficulty of accurate placement, wire movement with muscle
contraction, and the need for licensure to utilize wire electrodes are
some of the drawbacks. Electrical stimuli is usually given to confirm
the accuracy of fine-wire placement. Furthermore, subjects with
in-dwelling electrodes walk more slowly after insertion of the
electrodes. Because needle electrodes are inserted transcutaneously,
they must be sterilized and sufficiently
strong
to resist breakage. Commonsense considerations, such as time, expense,
discomfort experienced, the tolerance of the subject to multiple needle
insertions, and the influence of in-dwelling electrodes on walking,
necessitate a selection of the muscles most relevant to the specific
movement abnormalities. Large muscles near the surface can be studied
well with surface electrodes, whereas small muscles and those
surrounded by other muscles require insertion of fine-wire electrodes.
EMG systems are available in either hardwired or telemetry versions.
The hardwired versions now send multiple signals on a single cable.
These systems are reliable and less expensive than telemetry. Telemetry
systems do not encumber the subject with cables but are susceptible to
electromagnetic interference.
further to provide information about the timing of muscle activity and
the relative intensity of the muscle activity. The EMG data is recorded
throughout the gait cycle. The gait cycle is indicated either with
synchronization of the kinematic data, foot-switch information, or
force plate data to indicate each foot strike and toe-off. Analysis of
the EMG is done by a phase-time plot of the activity of the muscle
against events of the gait cycle. The raw EMG signal can be analyzed or
processed further. The most common methods of EMG signal processing are
full wave rectification, linear envelope, and integration of the
rectified EMG. The linear envelope is created by low-pass filtering the
full wave rectified signal. Integrated processing of the rectified
signal is usually performed over short duration, that is, 2% gait
cycle, and then the integration is reset and accumulated again.
Normalization schemes may also be used to aid in analysis.
Normalization may be based on the maximum manual muscle test or maximum
EMG signal obtained during gait. The muscle is considered to be
activated when at least 5% of the maximum electrical activity obtained
during a manual muscle test is present for 5% of the gait cycle.
activity. The signals that result from action potentials and muscle
fibers are stochastic and nonstationary, adding to uncertainty in
interpretation. While the ultimate source of locomotor activity is
muscle force, no study has established that electromyographic signals
represent muscle force. The EMG signal is a measure of the bioelectric
events that occur in conjunction with contraction of the muscle fibers.
Thus, it is a phenomenon related to the initiation of muscle
contraction rather than an effect of the muscles mechanical action.
There are many difficulties in correlating the EMG signal amplitude
with muscle force magnitude. Both linear and nonlinear relationships
between the force level of skeletal muscles and the EMG signal have
been reported. Consequently, the EMG is commonly used in clinical gait
analysis to determine phasic patterns for individual muscles or muscle
groups. It is possible to examine simple on/off patterns, or the EMG
can be processed to find a graduation of signal level, after which EMG
patterns are examined as defined by the level of activity over the gait
cycle. In the latter process, it is common to normalize the signal as a
percentage of voluntary maximum muscle contraction. The process of
detecting when a muscle is “turned on or off” is usually one of testing
whether the average level of the signal is above some predefined limit.
This limit is often defined as a percentage of the maximum voluntary
muscle contraction. The determination of on/off time is often done by
calculating the EMG level and then testing for occasions when the level
exceeds some threshold value. EMG on/off times are generally more
variable from step to step than either kinematic or kinetic gait
measurements.
electromyographic activity as a measure of muscle functional
capability. A dynamic force produced by a muscle is not proportional to
the degree of muscular activity. Other factors may affect the muscle
force, such as a change of the muscle length, change of the contraction
velocity, the rate and type of muscle contraction, joint position, and
muscle fatigue. It is desirable to find an alternative measurable
mechanical parameter related to muscle force. The electromyographic
signal does not assess the tension produced by a muscle, because the
tension reflects the sum of both the active contraction and the passive
stretch. A technique that may provide information about muscle force is
measurement of intramuscular pressure. A new microsensor has been
developed for measuring intramuscular pressure. The pressure
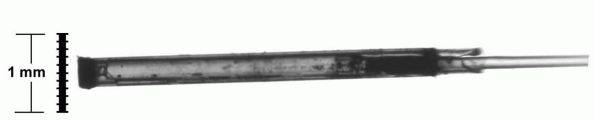
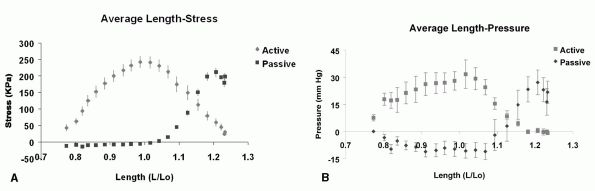
microsensor has a 360 µm diameter (Figure 3-7). It has an accuracy, repeatability, and linearity better than 2% full scale output (FSO) and the hysteresis of 4.5% FSO.
that is proportional to muscle tension. The relationship between IMP
and active and passive
muscle
tension has been quantified. The fiber length-isometric tension curve
was characterized by an “ascending limb” at a length less than muscle
optimum length (L0) and a “descending limb” at lengths greater that L0 (Figure 3-8A).
The shape of this curve presumably represents a scaled and distorted
version of a sarcomere length-tension curve previously published.
Passive muscle tension increased in a fairly exponential fashion at
lengths >L0. The length-pressure relationship generally
mimics the shape of the length-tension curve with an ascending limb at
lengths less than L0 and descending limb at length greater that L0 (Figure 3-8B).
A positive linear relationship has been found between IMP and muscle
stress for both the ascending and descending limbs. Further, the IMP
accurately reflects the muscle passive tension. These data indicate
that IMP measurement provides an accurate index of muscle tension under
both active and passive conditions.
 |
|
FIGURE 3-7. Microscopic view of a pressure microsensor for measuring intramuscular pressure.
|
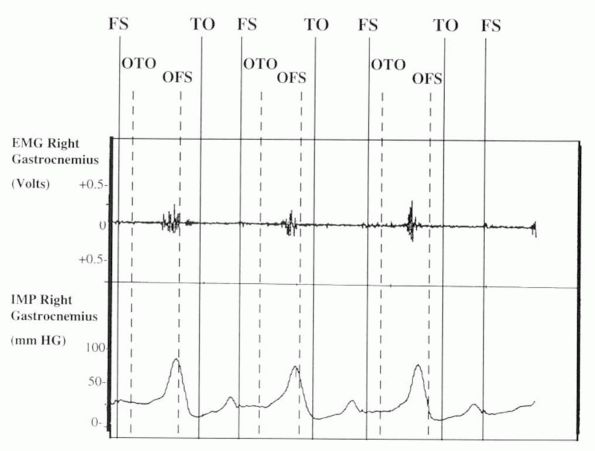
and relate these measurements to the timing and intensity of muscle
contraction. IMP increased at the beginning of single-limb stance
(opposite toe-off) (Figure 3-9). The increase
on IMP corresponded with the increase in electromyographic activity of
the gastrocnemius. The greatest muscle activity in the plantar flexors
was required near the end of single-limb stance to meet the high
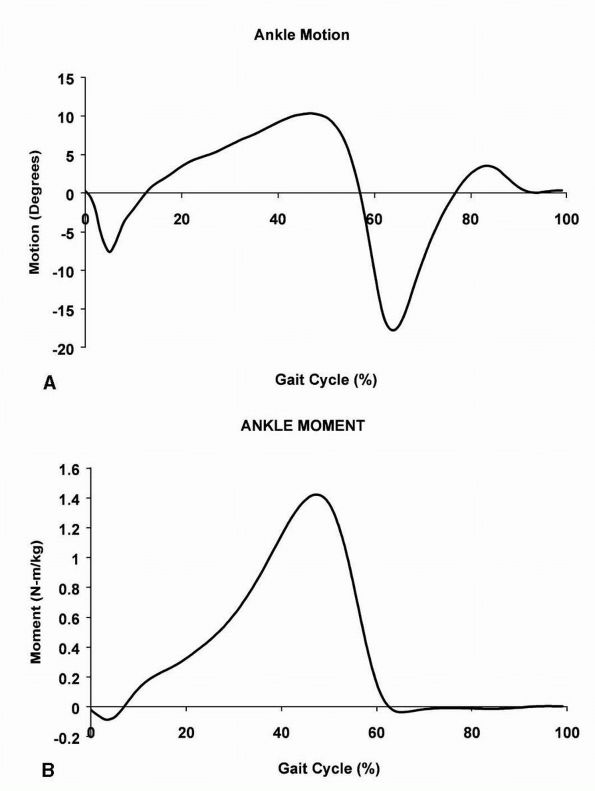
intrinsic plantarflexion moment occurring at the ankle joint (Figure 3-10B) and to reverse the direction of ankle movement (Figure 3-10A).
It should be noted that the IMP reading continued briefly after
cessation of the EMG. Furthermore, it can be noted that lower levels of
IMP are recorded during the swing phase of gait. During the stance
phase of gait, the peak IMP recording corresponds to the time when the
ankle moment is at a maximum (opposite foot strike) (Figure 3-10B).
Furthermore, during the swing phase of gait, the peak of IMP
corresponds to the point of time when the ankle is at peak dorsiflexion
(Figure 3-10A). Thus, the peaks in IMP during
gait can be correlated with the peaks of active contraction and passive
stretch of the gastrocnemius.
 |
|
FIGURE 3-8. Relationship between relative muscle length (L/L0) and (A) isometric force, or (B)
intramuscular pressure. The intramuscular pressure reflects both the active and passive tension characteristics of muscle. (Reproduced with permission from Davis, Kaufman, and Lieber, 2003) |
patient’s gait has been collected, the most crucial step of
interpreting the data remains to be performed. Gait analysis produces a
large number of measurements. The data must be synthesized and
integrated in order to supply clinically relevant information. Human
locomotion is very complex and multifaceted. The clinical
interpretation of pathological gait disorders involves holding in human
memory a large number of graphs, numbers, and clinical tests from data
presented on hard copy, chart radiographs, video, and computer
generated three-dimensional graphics from multiple trials of a subject
walking. Further, comparisons must be made to data from an able-bodied
normal population in order to identify the potential movement problems
for a given individual. The referring clinician, who may not be an
expert in gait analysis, is
overwhelmed
by the magnitude of the number of measurements included in a typical
gait report. The person interpreting the data must integrate this
information. While data collection techniques for gait analysis have
continually evolved over the last 50 years, the method of data
presentation has not changed over this time. The data is still reported
in two-dimensional charts with the abscissa usually defined as a
percentage of the gait cycle and the ordinate displaying the gait
parameter.
 |
|
FIGURE 3-9.
Raw data for a single subject during gait. Both EMG and intramuscular pressure are being recorded from the gastrocnemius muscle. The stance phase of gait occurs from FS to TO. The swing phase of gait occurs from TO to FS. Single-limb stance occurs from OTO to OFS. Peaks in intramuscular pressure during gait can be correlated with peaks of active contraction and passive stretch of the gastrocnemius. (Reproduced with permission from Kaufman and Sutherland, 1995) |
 |
|
FIGURE 3-10. Ankle motion (A) and moment (B)
during gait. The gait cycle is defined as the events that occur between successive footsteps of the same foot. The gait cycle begins with foot strike, continues through stance and swing phases, and ends with foot strike of the same foot. |
possible to apply advanced methods to visualize human movements. The
large volume of variables currently found in a typical clinical report
could
be replaced with a few graphic images that succinctly provided the
needed information. It is difficult to fully appreciate and understand
the relationships between motion dynamics and biomechanical variables
without scientific graphic visualization. Presently, computer software
packages have advanced to the stage where it is possible to provide a
gait analysis report using animation of fully three-dimensional,
realistic graphical depictions of human locomotion. The format used for
reporting test results is a matter of considerable importance. The data
must be presented in an accurate, clear, and concise format. If the
results are not communicated in an effective format, they will be of
little use to the clinician regardless of quality.
gait patterns, disease progression, and treatment effectiveness.
Pathological gait results from a number of different clinical
conditions. There are four main causes of pathological gait: (1)
structural (i.e., skeletal deformities or lower limb amputation); (2)
joint and soft tissue pathology (i.e., arthritis or ligament
deficiency); (3) myopathic disorders (i.e., muscular dystrophy); and
(4) neurologic disorders (i.e., progressive or nonprogressive pathology
of the peripheral or central nervous system).
to measure the dynamic functional limitations of the patient. Careful
assessment of this data provides objective selection criteria for
different management options. For example, gait analysis can be used to
determine if an orthoses is providing functional support for a patient.
Similarly, an equinovarus foot deformity can result from several
distinct dynamic patterns, for example, overactivity of the tibialis
anterior or tibialis posterior, which can be differentiated with gait
analysis and dynamic EMG. For patients with myopathic disorders, gait
analysis can identify transitional stages of disease progression and
provide objective evidence of quadriceps insufficiency requiring
long-leg bracing. In chronic neurological impairment, gait analysis can
be used to differentiate fixed contracture, that is, static deformity,
from muscular overactivity, or, dynamic deformity. Thus, gait analysis
is useful for determining the appropriate treatment intervention.
to differentiate between the primary causes and compensations for the
patient’s functional problems. If the treatment is directed at
compensation, the patient will lose their ability to compensate and
their movement problems will worsen. A patient may display adaptations
in their gait pattern due to their pain, injury, deformity,
instability, and/or inappropriate muscle activation patterns. The
ramifications of these problems cannot be fully assessed without an
instrumented gait study. Patients can undergo dynamic adaptation
related to the biomechanics of walking, which must be factored into the
treatment algorithm. For example, it has been shown that when planning
corrective osteotomy knee surgery, patients with the same bony
deformity will have differing knee loading due to dynamic adaptations.
These dynamic adaptations will have a direct effect on surgical
outcome. The patients who dynamically compensated for their
malalignment had a better long-term outcome. For patients with
progressive disorders, these dynamic adaptations will also change with
time as the disease progresses. It is possible to use motion analysis
studies to quantify these dynamic changes in locomotor patterns.
services, the ability to document the need and effectiveness of a
particular treatment will assume an increasingly important role.
Managed care will require validation for many types of therapeutic
interventions. Pre- and posttreatment measurement will become
mandatory. Outcomes will have to be compared. Practitioners and
facilities will be rated on their outcomes. Maximizing anticipated
outcomes will be required to document that a treatment plan is
worthwhile. Objective gait analysis is an essential tool to meet these
demands. The technology is at a level where it is both feasible and
affordable to provide an objective form of patient assessment.
instrumentation and procedures to aid in a differential diagnosis and
treatment of patients. Further, information is required to objectively
document patient response to treatment. The ability to diagnose,
prescribe treatment, and document results is common to all areas of
medical care. However, the technology available in different medical
specialties varies widely. This is particularly evident when the
current medical technology for treating patients with cardiovascular
conditions is compared to the technology for treating patients with
neuromuscular
conditions (Table 3-1).
For both types of patients the technology can be divided into three
levels: static examinations, dynamic examinations, and invasive
procedures. Typically, the approach is to utilize the technology
available at the lowest level that will meet the requirements for
aiding in differential diagnosis and treatment planning. When a patient
reports to a physician that he or she is experiencing chest pain and
the risk factors for a myocardial infarction exist, the patient is
monitored with an electrocardiogram. In some centers, a computed
tomography (CT) scan is obtained to assess the amount of
arteriosclerosis in the vessels of the heart muscle. These tests are
obtained while the patient is either sitting or lying down. Hence,
these constitute static exams. Other static modalities include MRI,
PET, ultrasound, and nuclear imaging. If the physician has a high index
of suspicion, dynamic tests may be undertaken. These tests include a
stress test or echocardiography. Finally, angiography may be utilized
as an invasive procedure to further examine the heart.
|
TABLE 3-1. Current Medical Technology
|
||||||||||||||||||||
|---|---|---|---|---|---|---|---|---|---|---|---|---|---|---|---|---|---|---|---|---|
|
||||||||||||||||||||
dysfunction, most of the modalities utilized are static modalities.
Current modalities include radiograph, CT, MRI, and nuclear imaging. It
is also common to obtain diagnostic electromyography (EMG) to further
elucidate the neuromuscular status of the patient. However, during all
these examinations, the patient is static and non-weight bearing.
Dynamic assessment of patients with neuromuscular dysfunction can only
be obtained using motion analysis techniques along with acquisition of
kinesiological EMG.
too costly. However, this objection is unfounded. In terms of
cost-benefit ratio, the most compelling consideration is the high cost
of inappropriate treatment. It is important to remember that
unsuccessful treatment results in unfavorable changes in function and
may require subsequent procedures to deal with the original problem.
There is, of course, no assurance that gait studies performed prior to
treatment planning ensures favorable outcome, but careful planning,
based on objective data, provides a solid foundation for decision
making. Posttreatment studies give the information required for
objective evaluation of treatment results. The rate at which gait
analysis technologies become more common depend on the market, the
manufacturers, and managed care requirement. Objective patient
assessment using gait analysis techniques facilitates the
identification of optimal treatment regimens and provides a solid
foundation for clinical decision making.
studies of movement. The modern motion analysis laboratory that has
evolved with technological advances has the potential for opening new
opportunities for progress in the treatment of patients. Current gait
analysis laboratories offer sophisticated automatic tracking systems,
force platforms, and electromyographic activity measurements. When
coupled with a biomechanical model, this analysis technique is able to
provide a complete, three-dimensional, dynamic description of the
patient’s gait along with information on the timing and intensity of
muscle activity. The function of a motion analysis laboratory is to
objectively measure the dynamic aspects of an individual patient’s
performance
that cannot be assessed in the clinical setting. Gait dysfunction is,
most often, multifactorial in etiology. This quantitative data can
facilitate the differentiation of functional deficits from
compensations for the deficits. Appropriate intervention requires a
thorough understanding of the pathophysiology of the gait deviations
along with the appropriate treatment options. Interpretation of this
data makes it possible to integrate morphology and functional
adaptations. Sound clinical judgment is also indispensable for the
management of gait dysfunction. The clinician and gait specialist form
an essential team for elucidating the factors contributing to
pathological gait and the selection of effective treatment options.
Institutes of Health Grant R01 HD31476. Appreciation is also expressed
to Barb Iverson-Literski for her careful assistance with manuscript
preparation.
KN, Jacobsen MC, Berglund LJ, et al. Application of a magnetic tracking
device to kinesiologic studies. J Biomech, 1988;21(7):613-620. This is the first article to describe the use of a magnetic tracking device for application in biomechanical research.
AL, Pedersen DR, and Brand RA. Prediction of hip joint centre location
from external landmarks. Hum Movement Sci 1989;8:3-16. This article provides a method to locate the hip center based on measurements from the ASIS and PSIS landmarks.
RA, Barnes LA, and Perry J. Computer algorithms to characterize
individual subject EMG profiles during gait. Arch Phys Med Rehabil
1992;73(9):835-841. This article describes a computer program for automated analysis of electromyographic signals during gait.
A, Catani F, Croce UD, et al. Position and orientation in space of
bones during movement: anatomical frame definition and determination.
Clin Biomech 1995;10(4):171-178. This article
describes a method for converting technical coordinate systems to
anatomical coordinate systems using a subject calibration procedure.
EYS. Determination of applied forces in linking systems with known
displacements: with special application to biomechanics. Iowa City:
University of Iowa, 1971. The first description of the inverse dynamics techniques for use in biomechanics.
J, Kaufman KR, and Lieber RL. Correlation between active and passive
isometric force and intramuscular pressure in the isolated rabbit
tibialis anterior muscle. J Biomech 2003;36(4): 505-512. This article demonstrates that intramuscular pressure reflects both active and passive muscle tension.
GBA. Physiologie des mouvements démontrée a l’aide de l’expérimentation
électrique et de l’observation clinique et applicable a l’étude des
paralysies et des déformations, J.B. Bailliere ed. Paris, 1867. This classic article describes how muscles function during gait.
ME, Arvidson J, Snyder-Mackler L, et al. Interrater reliability of
videotaped observational gait-analysis assessments. Phys Ther
1991;71(6):465-472. This article demonstrates
that the inter-rater reliability of videotaped observational gait
analysis assessments are only slightly to moderately reliable.
AM, Huxley AF, and Julian FJ. The variation in isometric tension with
sarcomere length in vertebrate muscle fibres. J Phys (Lond)
1966;184:170-192. This classic article describes the sarcomere length-tension relationship.
ES, and Suntay WJ. A joint coordinate system for the clinical
description of three-dimensional motions: application to the knee. J
Biomech Eng 1983;105(2):136-144. This article is often quoted to describe the Eulerian angle system.
MP, Ramakrishnan HK, and Wootten ME. Measurement of lower extremity
kinematics during level walking. J Orthop Res 1990;8(3):383-392. This article describes a biomechanical model that is commonly used in gait analysis, the so-called Helen Hayes marker set.
KR, and Sutherland DH. Dynamic intramuscular pressure measurement
during gait. Oper Tech in Sports Med 1995;3(4):250-255. This article demonstrates that intramuscular pressure reflects both active and passive muscle tension in vivo.
KR, An KN, and Chao EY. A comparison of intersegmental joint dynamics
to isokinetic dynamometer measurements. J Biomech
1995;28(10):1243-1256. This article contains a rigorous mathematic description of inverse dynamics.
KR, An KW, Litchy WJ, et al. Physiological prediction of muscle
forces—I. Theoretical formulation. Neuroscience 1991;40(3):781-792. A rigorous description of the optimization technique for predicting muscle and joint forces.
PV. Relationship between muscle tension, EMG, and velocity of
contraction under concentric and eccentric work. New Developments in
Clinical Neurophysiology. J.E. Desmet, ed. Basel, Switzerland: Karger,
1973. This article illustrates that EMG is not a
direct measure of muscle force. The EMG varies for the same muscle
force during dynamic muscle contraction.
study presents the within-rater and between-rater reliability of
observational gait analysis in a pediatric sample of patients wearing
ankle-foot orthoses.
J, Easterday CS, Antonelli DJ. Surface versus intramuscular electrodes
for electromyography of superficial and deep muscles. Phys Ther
1981;61(1):7-15. The relative selectivity of
surface electrodes was compared to fine-wire electrodes. The EMG values
obtained with surface electrodes reflect a composite of electrical
activity from the target muscle and muscles in proximity to the target
muscle, that is, cross-talk.
CC, Andriacchi TP, and Galante JO. A relationship between gait and
clinical changes following high tibial osteotomy. J Bone Joint Surg Am
1985;67(8):1188-1194. This article demonstrates
that patients can have the same anatomical alignment and can have
different clinical outcomes because they alter their dynamic knee joint
loading during gait.
FH, Blood EB, Steiner TO, et al. Magnetic position and orientation
tracking system. IEEE Transactions on Aerospace and Electronic Systems
1979;AES-15(5):709-718. This article describes the mathematical principles of a magnetic tracking system.
PMH, and Westbury DR. The effects of length and stimulus rate on
tension in the isometric cat soleus muscle. J Physiol (Lond)
1969;204:443-460. The classic article describes the length-tension relationship in whole muscle.
M, and Murdoch G. In defence of gait analysis. Observation and
measurement in gait assessment. J Bone Joint Surg [Br]
1985;67(2):237-241. This report demonstrates the
inadequacy of visual observation as a diagnostic method. It emphasizes
the need for objective measurements.
DH, Olshen R, Cooper L, et al. The pathomechanics of gait in Duchenne
muscular dystrophy. Dev Med Child Neurol 1981;23(1):3-22. This
classic article classifies patients with Duchenne muscular dystrophy
into three groups: early, transitional, and late, based on their gait
characteristics. It describes changes in gait patterns of these
subjects during disease progression.
JW, Kuo KN, Andriacchi TP, et al. The influence of walking mechanics
and time on the results of proximal tibial osteotomy. J Bone Joint Surg
1990;72(6):905-909. This is a follow-up to the
Prodromos et al. (1985) study. The article describes the relationship
between the magnitude of a knee adduction moment during walking and the
outcome of proximal tibial osteotomy. The patients with a low adduction
moment have less recurrence of varus deformity over a greater period of
time.
RL, Frazier J, Garland DE, et al. Electromyographic gait analysis
before and after operative treatment for hemiplegic equinus and
equinovarus deformity. J Bone Joint Surg 1982;64(2):284-288. This
article demonstrates that it is necessary to obtain dynamic EMG in
order to differentiate between the action of tibialis anterior and
tibialis posterior contributing to equinovarus foot deformity.
JJ, and Bigland-Ritchie B. Linear and nonlinear surface EMG/force
relationships in human muscles. Amer J Phys Med Rehab
1983;62(6):287-299. This article reports how it is possible to have both linear and nonlinear relationships between EMG and muscle force.
ME, Kadaba MP, and Cochran GUVB. Dynamic electromyography. II. Normal
patterns during gait. J Orthop Res 1990;8:259-265. A description of the mathematical technique for analyzing changes in electromyographic activity level during gait.
CC, Rose SE, Biden EN, et al. The effect of surface and internal
electrodes on the gait of children with cerebral palsy, spastic
diplegic type. J Orthop Res, 1989;7(5): 732-737. This
study demonstrates that the addition of electromyographic recording
apparatus causes a change in the gait of subjects being studied.