Articular Cartilage


7 – Articular Cartilage

Chapter 7
Articular Cartilage
Hollis G. Potter
Li Foong Foo
Introduction to Cartilage Imaging
Currently, standardized cartilage-sensitive pulse sequences are available for all joints and should be included as a part of all joint imaging protocols. Cartilage-sensitive imaging using magnetic resonance (MR) imaging is a dynamic process, and ongoing research continues to refine the techniques, providing detailed evaluation of traumatic, inflammatory, and degenerative patterns of cartilage loss. Volumetric (quantitative) MR imaging is likely to become more available to standardized work stations, permitting the longitudinal assessment of cartilage volume over time. It is important to remember, however, that although MR imaging provides superior soft-tissue contrast compared to traditional imaging techniques, standardized radiographs are also a valuable element in cartilage assessment, particularly in the setting of planning for cartilage repair. Indeed, standing hip to ankle films may be essential for providing information on the mechanical axis of the limb and for disclosing any associated preexisting deformity that could limit the clinical success of cartilage repair.
Attention to technique is important for successful cartilage-sensitive MR imaging, since associated instrumentation may create magnetic susceptibility. In this setting, fast spin-echo sequences have been proven more effective than standardized gradient-echo techniques. Similarly, the use of short tau inversion recovery (STIR) sequences to detect bone marrow edema pattern may provide more uniform fat suppression. Additional techniques that assess the extracellular matrix, such as the proteoglycan- or collagen-directed techniques, provide further information and some degree of tissue characterization and may eventually obviate the need for biopsy.
Introduction to Cartilage Structure
The unique structure of articular cartilage reflects its function, including the ability to distribute joint loads over a wide area, thus decreasing contact stresses on the subchondral bone, as well as permitting movement of opposing surfaces with minimal friction and wear.1 Cartilage is a metabolically active tissue, with metabolic homeostasis being maintained by the chondrocytes, which are responsible for sustaining a stable extracellular matrix. Chondrocytes represent less than 10% of cartilage tissue volume,2,3,4 and thus the integrity of the extracellular matrix provides much of cartilage function, including the ability to withstand

P.1100


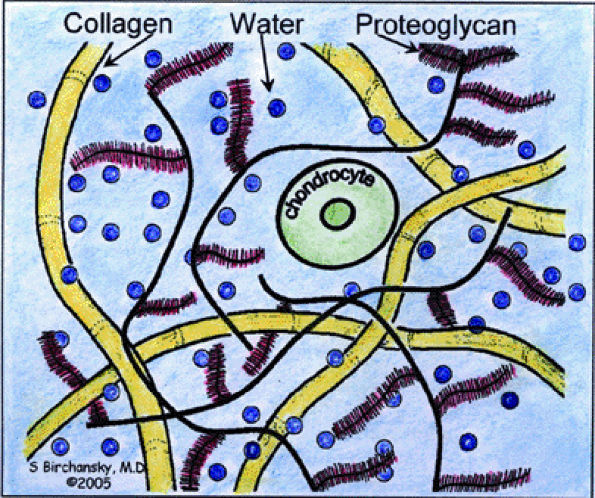
both compressive and tensile loads. The solid collagen fibers are of importance in maintaining tensile stiffness and strength.1 However, given their ratio of length to thickness in structure, collagen is unable to withstand high compressive loads, which is a property maintained by the integrity of the proteoglycan component.

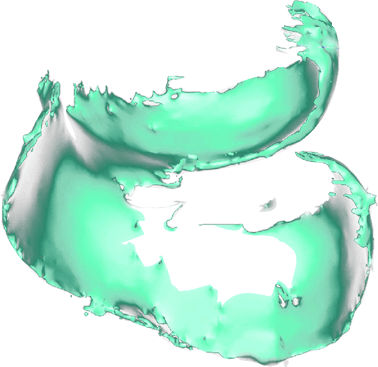
FIGURE 7.1 ● Schematic diagram of cartilage structure.
Water is the most abundant component of articular cartilage, accounting for its unique ability to be imaged using MR. The majority of water is contained within an interstitial space created by the matrix elements, including collagen and proteoglycan, which are large protein—polysaccharide molecules that exist either as monomers or aggregates.5,6 Proteoglycan monomers are often depicted schematically as having a “bottlebrush-like” structure with negatively charged glycosaminoglycans (chondroitin sulfate and keratan sulfate) that radiate in a perpendicular direction from the protein core. These negatively charged monomers bind to hyaluronic acid to form larger macromolecular aggregates, which resist compression of cartilage due to their hydrophilic structure (Fig. 7.1). The negative charge of the glycosaminoglycan components of proteoglycan may be exploited in indirectly assessing the proteoglycan component of cartilage structure using MR imaging techniques.
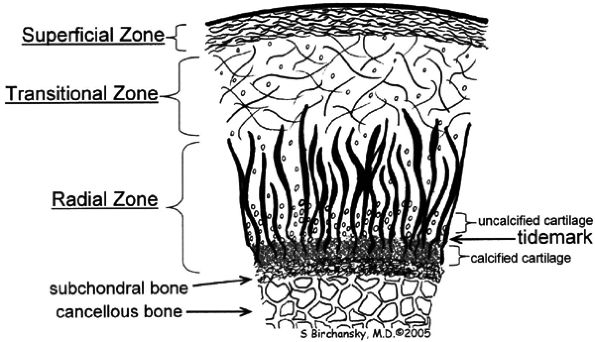
FIGURE 7.2 ● Schematic diagram of cartilage zonal histology.
The structure of these vital matrix elements varies as a function of depth, and the well-described orientation of different matrix elements allows cartilage to be divided structurally and functionally into four zones: superficial, transitional, deep or radial, and calcified (Fig. 7.2):
  • The most superficial or tangential zone (lamina splendens) represents 10% to 20% of the total thickness of cartilage, reflecting collagen fibers that are oriented parallel to the articular surface. The superficial zone resists shear and has the highest collagen content of all zones.1 Chondrocytes in this layer differentially express proteins with lubricating and protective functions, yielding little proteoglycan content.7 Despite the importance of the superficial zone, it is typically not visualized as separate from the transitional zone on standardized cartilage imaging performed at clinically relevant field strengths.
  • In the transitional or middle zone, representing 40% to 60% of the cartilage thickness, collagen fibers are randomly oriented.1 The inhomogeneity of fiber orientation acts to distribute stress more uniformly across loaded tissue.8
  • The deep or radial zone represents 30% of the cartilage thickness and has highly ordered fibers that are perpendicular to the articular surface. The radial orientation of the collagen fibers coalesces as bundles; they then cross the tidemark, defined as the interface between the arular cartilage and the calcified cartilage beneath it, forming a system that anchors the cartilage to underlying bone.9
  • P.1101


  • The calcified zone is separated from the radial zone by its boundary tidemark. The tidemark also represents a potential shear plane for articular cartilage defects in the adult skeleton. Deep to the calcified cartilage lies the subchondral bone plate.10
All three major elements of cartilage—water, proteoglycan, and collagen—account for the signal characteristics of cartilage on MR imaging. Because of its concentration in soft tissue, hydrogen is typically used as the targeted magnetic dipole to image cartilage in the clinical setting. As such, it is important to consider the relative different “pools of water” that exist (including free water, which accounts for the bulk of the signal), the component that is electrostatically bound to proteoglycan, and the component that is associated with collagen. An understanding of the normal structural integrity of cartilage is important to accurately identify both intact and degraded articular cartilage, as well as to provide some insight into new cartilage repair techniques.
Cartilage Imaging
Pulse Sequence Selection
Traditional (Conventional) Spin-Echo and Gradient-Echo Techniques
The ability of MR to noninvasively assess cartilage is one of more important advances in orthopaedic imaging. Many pulse sequences have been developed to detect cartilage (Table 7-1). The “ideal” cartilage pulse sequence provides differential contrast among synovial fluid, fibrocartilage (such as meniscus and labrum), and hyaline cartilage, combined with relatively high in-plane and slice resolution. The ability to detect changes in the adjacent subchondral bone is also clinically useful. It is essential to note, however, that traditional T1- and T2-weighted images are not suitable for the assessment of cartilage. Indeed, the use of traditional pulse sequences with poor in-plane resolution results in ineffective visualization of articular cartilage that has been proven inaccurate compared to arthroscopic inspection and correlates poorly with clinical evaluation.11,12,13,14,15 Image characteristics on traditional T1- and T2-weighted sequences include the following:
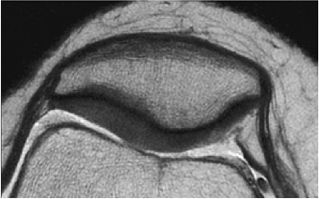
  • With a traditional T1-weighted sequence, fluid is of intermediate to lower signal intensity with poor contrast against the intermediate-signal-intensity articular cartilage.
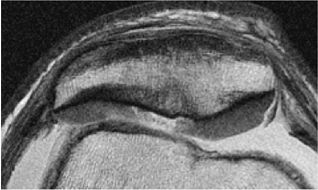
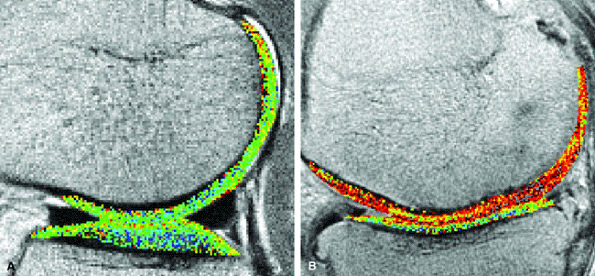
  • Heavily T2-weighted sequences, with echo times in excess of 80 msec, depict the cartilage as being relatively hypointense compared to high-signal-intensity fluid. It is important to remember, however, that because of the normal stratification of the extracellular matrix in cartilage, T2 values are shorter in the radial zone (closer to the subchondral plate) than in the transitional zone, where the collagen is more randomly oriented and T2 values are prolonged. This normal stratification can be perceived on appropriate cartilage-sensitive scans and provides insight into the cartilage ultrastructure (Fig. 7.3).
  • With longer echo times there is poor delineation between the basilar components of the cartilage and the subchondral plate. This may account for factitious thickening of the subchondral plate and thinning of the cartilage (see Fig. 7.3).
Three-dimensional T1-weighted gradient-echo imaging was one of the first techniques to provide cartilage-sensitive imaging that was considered to be accurate based on comparison with arthroscopic findings. Disler et al. have shown that fat-suppressed T1-weighted 3D gradient-echo sequences (T1-weighted 3D spoiled gradient echo) were considerably more sensitive than standard MR imaging: 93% versus 53% in one study16 and 75% to 85% versus 29% to 38% in another.17 These authors also measured interobserver agreement, crucial for MR imaging to be used as a substitute for diagnostic

P.1102


arthroscopy in cartilage evaluation, and found that images acquired using the gradient-echo sequences provided excellent interobserver and intraobserver agreement (kappa = 0.72 – 1.0), with the exception of the lateral tibial plateau, which showed moderate to substantial agreement (kappa = 0.56 – 0.72). The more convex architecture of the lateral tibial plateau may make evaluation in this location subject to partial volume errors and reduced accuracy.18

TABLE 7.1 ● Comparison of Commonly Used Pulse Sequences in Cartilage Imaging
  2D Fat-Suppressed*
Moderate TE FSE
2D Non–Fat-Suppressed
Moderate TE FSE
3D Fat-Suppressed
T1-Weighted Gradient Echo
Signal intensity characteristics of:      
   Joint fluid High High Low
   Cartilage Intermediate Intermediate High
   Fat in subchondral bone marrow Low High Very low
Ability to see meniscus and ligament Good Good Poor
Scan time + + ++
Signal-to-noise Good Good Fair
Subject to chemical shift misregistration No Yes No
Image quality in presence of instrumentation Fair Good Poor
* Frequency selective fat suppression
May be minimized by the use of wider receiver bandwidth
These are general observations only. Actual measurements of signal-to-noise will depend on specific parameters, including slice thickness and spatial resolution.
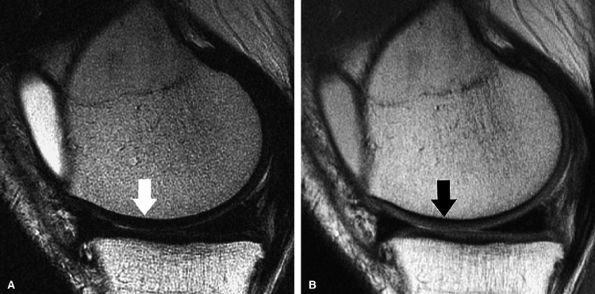
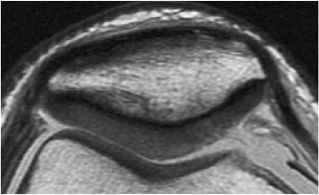
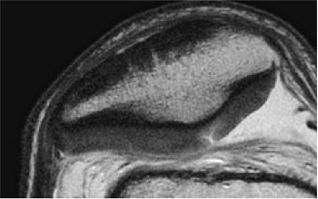
FIGURE 7.3 ● (A) Sagittal fast spin-echo MR image of the knee in a 39-year-old man performed on a high-field system (1.5 Tesla) demonstrates poor distinction between the subchondral plate and adjacent basilar components of cartilage at a TE of 110 msec (white arrow). (B) Corresponding image with all acquisition parameters held the same except for a moderate TE of 27.5 msec demonstrates improved cartilage–subchondral bone distinction (black arrow).
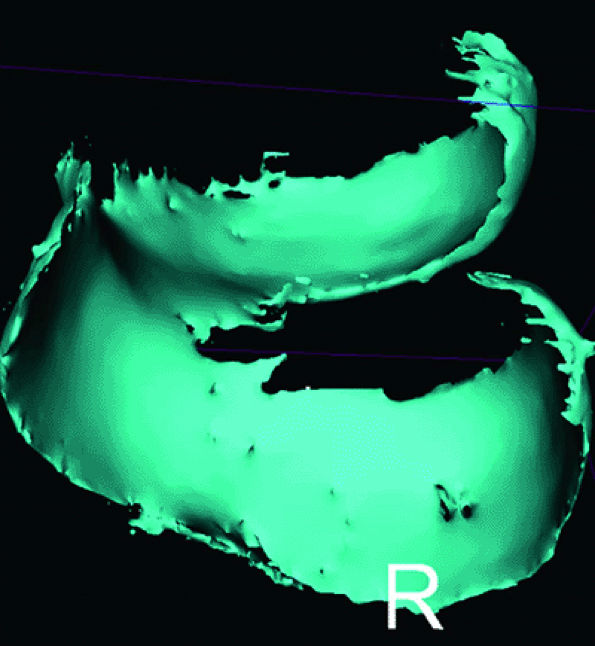
FIGURE 7.4 ● Three-dimensional cartilage model built from a semi-automated segmentation algorithm, with the cartilage subtracted from the subchondral bone. MR data were obtained from a 3D fat-suppressed, T1-weighted gradient-echo acquisition. These models may eventually prove helpful in surface replacement techniques.
Cartilage Segmentation Analysis
Fat-suppressed T1-weighted gradient-echo techniques provide high contrast between bone and cartilage but are not fluid-sensitive. Three-dimensional gradient-echo sequences with high contrast boundaries between bone and cartilage are more amenable to semiautomatic segmentation algorithms, thus providing reproducible assessment of cartilage thickness and volume (Fig. 7.4).19,20
The ability to perform segmentation analysis of gradient-echo images makes these pulse sequences suitable for monitoring disease progression over time and assessment of cartilage volume in osteoarthritis (OA). The chosen pulse sequence parameters should be based on a suitable standard and should have high precision or reproducibility.21 Routine, standardized cartilage imaging for clinical assessment is generally performed with a slice resolution between 3 and 4 mm and an in-plane resolution between 300 and 350 microns. However, gradient-echo sequences necessary to quantify cartilage often need higher resolution, requiring a slice thickness on the order of 1 to 2 mm, at a pixel size of less than 300 microns.21

P.1103


Attention to echo time is also important. For fat-suppressed T1-weighted gradient-echo sequences, given the relatively short T2 relaxation times of cartilage, fairly short echo times (preferably 10 msec) are generally recommended. As Eckstein et al. reported, an echo time of 11 msec led to underestimation of tibial cartilage thickness (compared to CT arthrography as the standard).22

With standardized modern gradient platforms, a cartilage volume technique in a single plane may be acquired in less than 13 minutes. As a result of partial volume effects encountered in tomographic imaging of a curved articular surface, more accurate thickness assessment is obtained if computations are performed in all three planes.21 Unfortunately, universal application of such techniques is limited by the extensive time required for optimal scan acquisition and post-processing. In an attempt to find a method to reduce post-image processing time, Zhai et al. compared assessment of a whole slab of 1.5-mm-thick slices with measurement of every second to fourth slice.23 Using the inclusive slice estimate as the standard, the authors found that decreasing the number of slices by extracting one in two to one in four slices led to little over- or underestimation in cartilage volume over the plateau and patella (femoral cartilage volume was not assessed).23 Others have used a double echo steady state (DESS) gradient-echo sequence at 3 Tesla to analyze cartilage morphology in the femorotibial joint.24 The inherently higher signal-to-noise ratio in this protocol permitted thinner slices (0.7 mm) and accurate analysis of cartilage morphology.
Assessment of cartilage volume is dependent on thickness and surface area. Therefore, longitudinal changes are affected by alterations in cartilage thickness (elevation or reduction) as well as alterations in cartilage surface area (osteophyte formation). Due to these variables, standardization of cartilage segmentation techniques is needed, with strict attention to pulse sequence parameters and in-plane and slice resolution. To obtain cartilage volume, segmentation must be performed either manually (a lengthy, time-consuming process) or by semiautomatic algorithms based on computerized recognition of tissue contrast edge boundaries. These techniques often delineate the line of the steepest gradient between the hyperintense cartilage and the hypointense (fat-suppressed) bone, as well as between the hyperintense cartilage and the hypointense meniscus or capsule.25 Some correction at low-contrast interfaces, as well as the application of smoothing algorithms after segmentation, may be required. Although some degree of expertise is necessary to maintain reproducibility, in general, automatic segmentation provides superior reproducibility in the assessment of cartilage volume and thickness.26
In a study of cartilage segmentation prior to knee arthroplasty, Graichen et al. compared results from quantitative MR imaging with those obtained by direct image analysis of surface area, cartilage thickness, and volume of the explants. Quantitative MR imaging provided accurate assessment of OA, with correlation coefficients ranging between 0.92 for thickness and 0.98 for volume.25 Segmentation of the central and weight-bearing areas of the femoral condyles have been shown to be more accurate than analysis of boundary and non-weight-bearing regions.27 Others have studied lesions at varying field strengths. Comparing 1.5- to 3-Tesla units and using a gradient peak method to define focal cartilage, no statistically significant differences were found between the two field strengths or in the accuracy of the measurements of depth, diameter, area, and focal thickness compared to manual measurements.28
Quantitative MR imaging is an attractive addition to the longitudinal study of OA, providing noninvasive assessment of cartilage morphology and/or response to pharmaceutical intervention. Comparing radiographic evidence of osteoarthritis, including joint space narrowing and osteophytes, with segmentation techniques, Cicuttini et al. noted a strong negative linear association between tibial cartilage volume and increasing joint space narrowing.29,30 More recently, evaluation of patients with knee OA using quantitative MR imaging and joint space width on radiographs showed a modest but significant correlation between joint space and medial tibiofemoral cartilage volume; no correlation in longitudinal changes over a 2-year follow-up period, however, was found.30 The authors suggested that 3D assessment of cartilage volume may be superior to 2D assessment using radiographs.30
The use of quantitative MRI in the longitudinal evaluation of osteoarthrosis may be affected by transient deformation in cartilage as a response to load (which affects cartilage volume).31 In one study a diurnal variation in cartilage thickness over the patellofemoral and femorotibial contact zones has been noted during a day of standing activity.32 There is also a statistically significant decrease in patella cartilage volume in response to physical exercise, suggesting that a period of rest may be indicated prior to imaging of subjects in a longitudinal assessment.33
Although the study of mechanical deformation of cartilage in normal and abnormal joint loading conditions is of interest, the relationship between alterations in overall cartilage volume and function remains unclear. It has been suggested that because of variations in the relative size of subchondral bone, cartilage volume alone may not be suitable as a criterion for patient evaluation, and that a ratio of cartilage volume to bone interface may prove a more suitable measure.21 In a 2-year study of patients with knee arthritis, Raynauld et al. found that there was no statistical correlation between loss of cartilage volume on MR imaging with radiographic changes, or between changes in cartilage volume and alterations in clinical variables, including components of the Western Ontario and McMaster University Osteoarthritis Questionnaire (pain, stiffness, and function) and the “Short Form 36” (SF36) health quality assessment technique.34
Fast Spin-Echo Imaging
Although suitable for volumetric assessment, one of the pitfalls of imaging with gradient-echo techniques is susceptibility to image degradation in the presence of orthopaedic instrumentation or metallic debris following diagnostic arthroscopy. Fast spin-echo techniques, with the ability to directly visualize articular cartilage despite adjacent hardware, have proven more useful in the setting of instrumentation.35 One of the greatest advantages of fast spin-echo imaging of articular cartilage is the ability to generate images suitable for detection of subchondral bone, ligaments, and the surrounding soft-tissue

P.1104


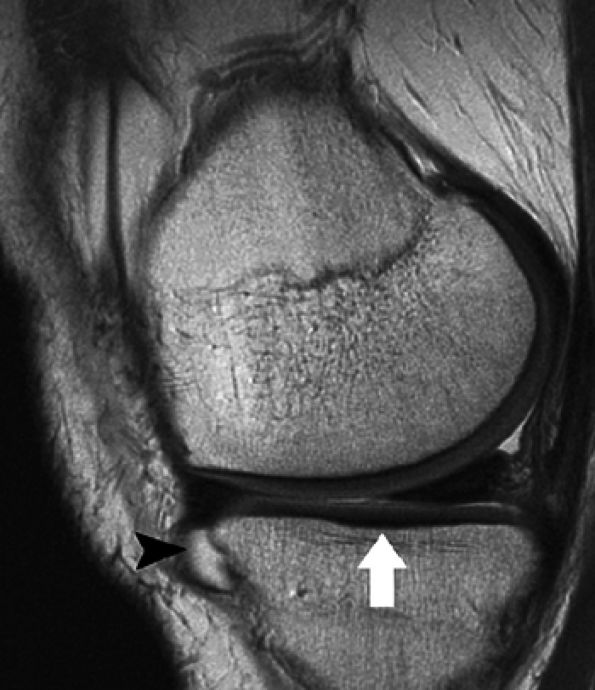
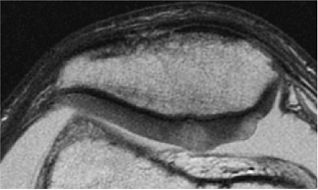
envelope, providing more efficient use of imaging time. Fast spin-echo images are cartilage-sensitive due to an inherent magnetization transfer contrast and exchange of off-resonance magnetization between slices, the net effect of which is to saturate the bound pool of hydrogen nuclei, resulting in a decrease in signal intensity from the free pool.36 This exchange results in relatively high signal intensity from fluid compared to the lower signal intensity of articular cartilage, providing an effective differential contrast among menisci, articular cartilage, and fluid in the meniscosynovial recesses (Fig. 7.5). With arthroscopy as a standard, Potter et al. found that articular surface evaluation using spin-echo sequences had a sensitivity of 87%, a specificity of 94%, and an accuracy of 92%, with minimal interobserver variability (kappa = 0.93).18 These findings of reproducibility support the use of MR imaging as a noninvasive and objective outcome measure of surgically manipulated cartilage and in the longitudinal evaluation of traumatic and degenerative cartilage lesions.

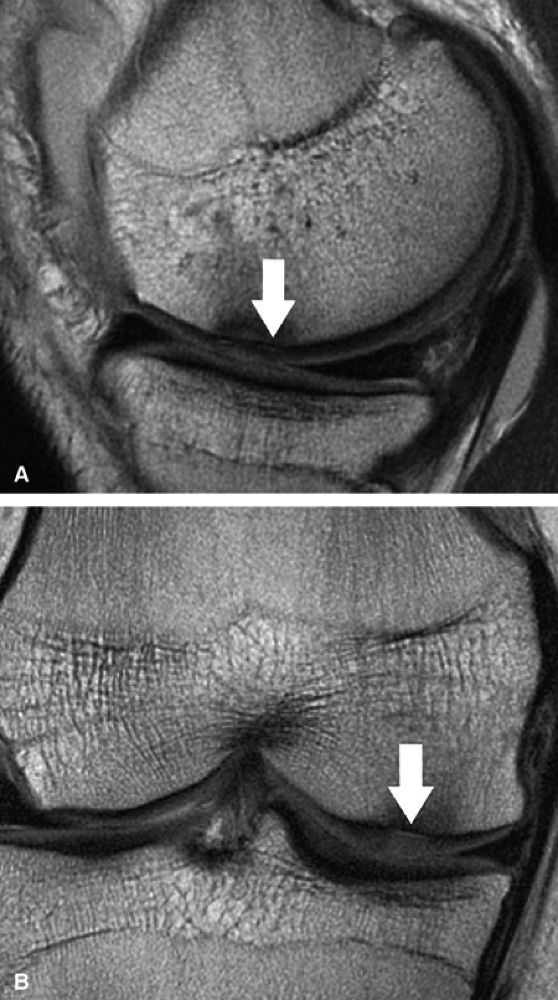
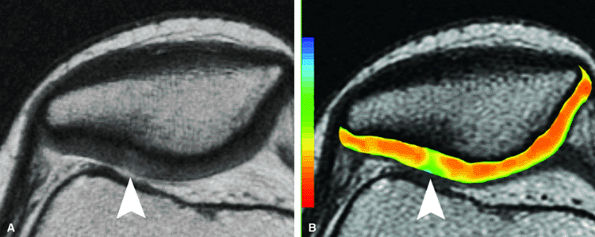
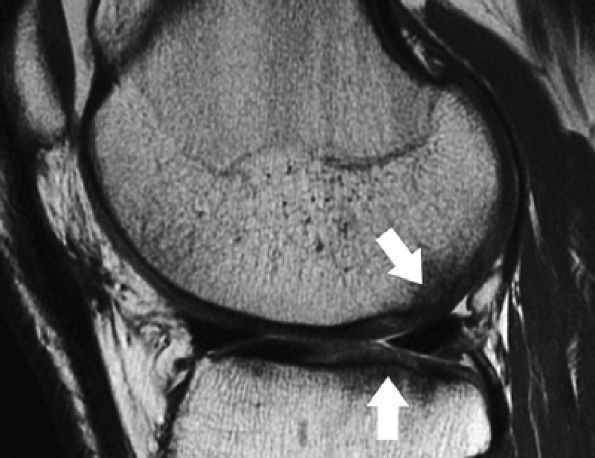
FIGURE 7.5 ● Sagittal fast spin-echo MR image of the knee in a 50-year-old patient demonstrates differential contrast for the high-signal-intensity joint fluid within the meniscosynovial recess (arrowhead), the intermediate signal intensity of hyaline cartilage, and the low signal intensity of meniscal fibrocartilage. Over the tibial plateau cartilage, note the gray-scale stratification (arrow) with lower signal intensity in the basilar components.
Fast spin-echo sequences use a relatively long repetition time (TR) (on the order of 3,500–5,000 msec) with a moderate to intermediate echo time (TE) (30–34 msec) for central K-space filling. High in-plane resolution (on the order of 250–350 μ in the frequency direction) imparts superior spatial resolution, which can make partial-thickness lesions more conspicuous compared to the gradient-echo techniques (Fig. 7.6). An essential element is the use of a wider receiver bandwidth

P.1105


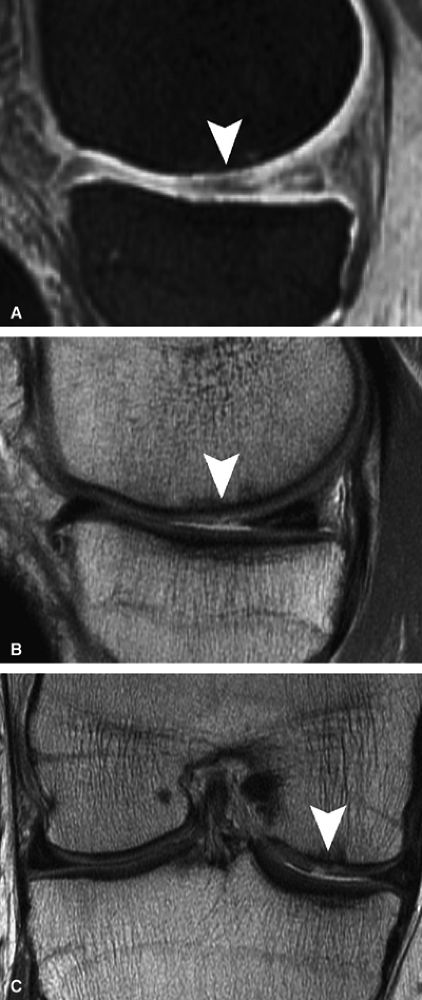
to minimize chemical shift misregistration as well as to reduce inter-echo spacing. Decreasing inter-echo spacing will minimize the edge blurring routinely encountered with fast spin-echo techniques performed at correspondingly narrower bandwidths with wider inter-echo spacing. The effect of chemical shift causes a misregistration at the interface between fat (subchondral bone) and water (cartilage), resulting in factitious loss of the subchondral plate, abnormal signal hyperintensity in the adjacent cartilage (due to the frequency shift summation), and inaccurate assessment of cartilage morphology (Fig. 7.7).

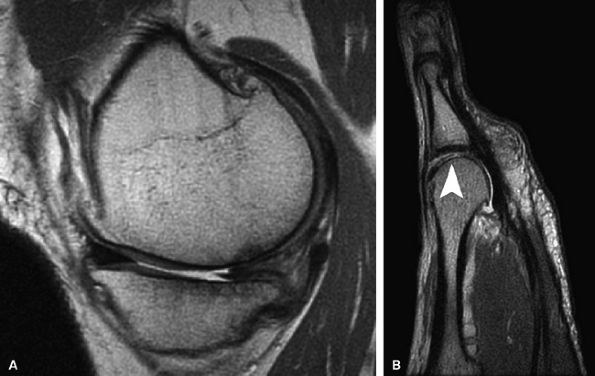
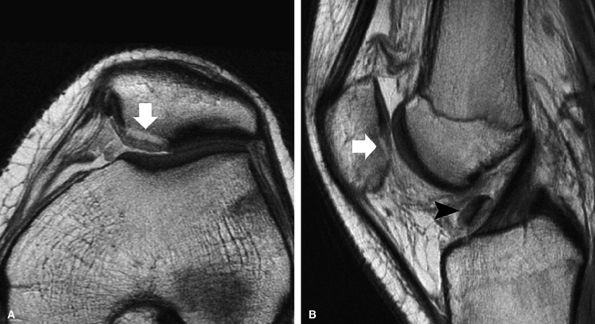
FIGURE 7.6 ● (A) Sagittal fat-suppressed T1-weighted gradient-echo MR image sequence of the knee demonstrates a focal high-grade partial-thickness cartilage defect overlying the medial femoral condyle (arrowheads). In the equivalent time required to acquire this single pulse sequence, cartilage-sensitive fast spin-echo MR sequences in two planes—sagittal (B) and coronal (C)—can be obtained, in which the depth of the lesion is much better delineated. (Reprinted by permission of SAGE Publications, Inc., from Am J Sports Med, in press.)
FIGURE 7.7 ● Sagittal fast spin-echo MR images of the knee in a 28-year-old man performed on a high-field system (3 Tesla). (A) There is chemical shift misregistration and image blurring at a receiver bandwidth of 10 kHz (arrowhead). (B) Corresponding image acquisition with all parameters held the same except for the use of a wider receiver bandwidth of 62.5 kHz. Attention to imaging technique is imperative to provide reproducible cartilage imaging.
The chemical shift effect may be minimized by the use of a wider receiver bandwidth and can be largely eliminated by the use of fat-suppression techniques. In a study comparing arthroscopy findings with coronal and axial moderately T2-weighted fast spin-echo images with frequency-selective fat suppression, Bredella et al. reported that MR imaging has a sensitivity of 94%, a specificity of 99%, and accuracy of 98%.37
Fast spin-echo techniques are well suited to discernment of both intrasubstance changes in the cartilage based on the gray-scale contrast and morphologic changes that may be correlated with pathologic and arthroscopic inspection using standardized grading scales (Table 7-2).38
Newer Gradient Echo Techniques
Additional pulse sequences have also been recommended for evaluation of cartilage, most of which are based on modified gradient-echo techniques that yield good fluid-to-cartilage contrast. Examples include driven equilibrium Fourier transform (DEFT) imaging, double echo steady state (DESS) imaging, refocused steady state free precession (SSFP), water selective balanced steady state free precession pulse sequences (WS-bSSFP), and projection reconstruction imaging:
  • Driven equilibrium Fourier transform (DEFT) imaging uses an additional 90° RF pulse to drive the recovery of longitudinal magnetization, resulting in high signal intensity from tissues with long T1 relaxation times, such as the synovial fluid adjacent to the articular cartilage. Gold et al. compared 3D DEFT imaging with proton density-weighted and T2-weighted fast spin-echo imaging and reported that sensitivity for full-thickness lesions was 50% for the fast spin-echo images compared to 67% for the 3D DEFT images; specificity was 80% for the FSE images compared to 100% for the 3D DEFT images.39 The authors also noted that artifacts were accentuated on the 3D DEFT sequence compared to the fast spin-echo images.39 The 3D DEFT images, however, subjectively provided superior cartilage-to-fluid contrast compared to more traditional cartilage-sensitive techniques.40
  • Several gradient-echo pulse sequences achieve cartilage-to-fluid contrast by the use of a steady state, including DESS, SSFP, and WS-bSSFP. Double echo steady state (DESS) acquires and combines two gradient echoes, providing both high T2 contrast and representative joint morphology.41 Refocused steady state free precession (SSFP)

    P.1106


    P.1107


    techniques (also known as True-FISP, FIESTA, and balanced FFE) require all imaging gradients to be fully re-wound between excitation pulses, resulting in high transverse coherence and relative T2/T1 weighting.42 Fat suppression may also be used in the steady state free precession pulse sequences, providing optimal cartilage-to-fluid contrast at the expense of signal-to-noise. Relative fat and water separation may be achieved with phase-sensitive techniques without the expense of the increased scan time needed when using frequency-selective fat suppression.43 Water selective balanced steady state free precession pulse sequences (WS-bSSFP) have also been explored. Kornaat et al. compared WS-bSSFP with moderately low in-plane resolution fast spin-echo techniques in 10 patients with arthritis and determined that the contrast-to-noise between cartilage and surrounding tissue was optimized with a 20° to 25° flip angle; the contrast-to-noise ratio was higher on the WS-bSSFP sequences than on fast spin-echo protocols or on T1-weighted gradient-echo techniques.44 In a comparison study of 3D T1-weighted gradient-echo and 3D SSFP imaging, Reeder et al. noted superior fat/water separation with good cartilage-to-fluid contrast and reduced acquisition times using 3D SSFP sequencing in a small cohort of 10 knees of five volunteers.45

  • Multiple echo techniques, in which a series of identically phase-encoded gradient echoes are sampled per line in K-space and unipolar readout gradients are used to avoid off-resonance effects, have also been developed.46 In a study evaluating the patellar joint using a slice thickness of 3 mm (1.5-mm gap) and arthroscopy as the standard, these techniques had a sensitivity of 79%, a specificity of 82%, and accuracy of 81% in detecting grade 2 or higher lesions.46 Interobserver agreement was also good (kappa = 0.68).46
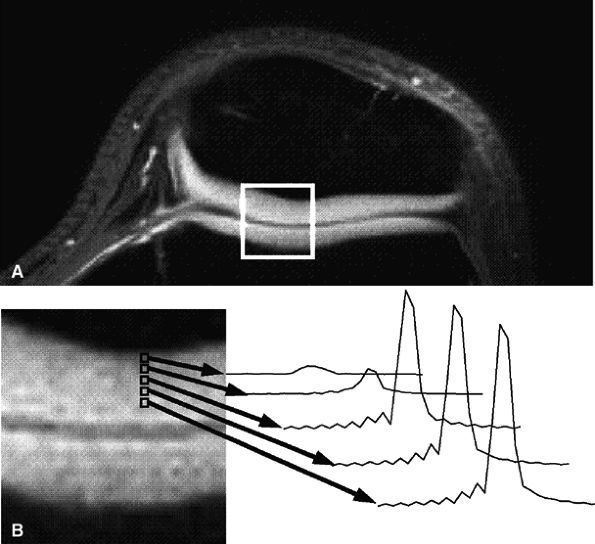
  • Short echo time projection reconstruction imaging of cartilage is a technique to detect ultrashort species in cartilage, potentially improving visualization of cartilage structure.47 Gold et al. described a method to obtain information from ultrashort echo time species in cartilage using projection-reconstruction spectroscopic imaging, disclosing spectra from voxels across the zones of articular cartilage that are reconstructed at the water frequency (Fig. 7.8).48 The latter technique also uses fat suppression to minimize chemical shift misregistration.
TABLE 7.2 ● Arthroscopic and MRI Correlation
Pathologic
Change
Arthroscopic Findings
(Modified Outerbridge
Classification)
MR Findings MR Image
Superficial lesions:
   Chondral softening
Grade 1: Softening to probe Increased signal in articular cartilage image
Superficial lesions extending down to 50% of cartilage depth Grade 2: Fissures/fibrillation involving <50% thickness Linear to ovoid foci of increased signal image
Cartilage defects extending down >50% of depth but not through subchondral bone Grade 3: Blisters/fissures/fibrillation involving >50% thickness Fissures extending more than 50% through cartilage signal but not to bone image
    Diffusely increased signal with surface bulge image
Ulceration to subchondral bone Grade 4: Exposed sub-chondral bone Complete loss of articular cartilage
Surface flap
image
Modified from the International Cartilage Research Society© classification.
FIGURE 7.8 ● Axial MR images of the patellofemoral joint in a 25-year-old healthy volunteer using projection-reconstruction spectroscopic imaging sequence (TE = 200 μsec). (A) Water-frequency image. (B) Magnified image of articular cartilage from box in (A), along with spectra of the patellofemoral cartilage. Note the decreasing line width and increasing peak area as voxels progress from the cartilage–bone interface to the articular surface. (Reprinted by permission of

American Roentgen Ray Society, from Am J Roentgenol. 1998; 170:1223-1226.

)

Contrast Techniques
Contrast agents, either intra-articular or intravenous saline or gadolinium, have also been used to improve the depiction of articular cartilage.49 The disadvantages of contrast administration, however, are the conversion of an otherwise noninvasive MR imaging study into an invasive technique and, at times, increasing the cost of the examination. More detailed information on the use of contrast media in the evaluation of cartilage architecture is provided in the section on delayed gadolinium-enhanced MR imaging of cartilage (dGEMRIC) later in this chapter.

P.1108


Cartilage Imaging at Different Field Strengths
Traditional low-field open or dedicated extremity units have not proven effective in the evaluation of cartilage, and higher-field open or dedicated units are more applicable to standardized cartilage pulse sequences (Fig. 7.9). In a comparison of the diagnostic performance of a dedicated 0.18-Tesla MR system to a conventional whole-body 1.0-Tesla system using a variety of pulse sequences (including a combination of spin-echo and 2D and 3D gradient-echo, water excited 3D double echo steady state [DESS], and 3D fat-suppressed T1-weighted imaging on the high-field unit), Woertler et al. found that images obtained on the 1.0-Tesla unit demonstrated significantly superior diagnostic performance compared to the low-field images, particularly for depicting moderate- and high-grade partial-thickness cartilage lesions.50 In another study using a 1.0-Tesla dedicated extremity unit and protocols including fat-suppressed fast spin-echo proton density-weighted and coronal STIR sequences, Roemer et al. found good to excellent agreement between individual observers, suggesting that these units may be acceptable for cartilage imaging on an open construct.51
With the advent of even higher clinical field strengths, superior in-plane resolution and contrast-to-noise may be achieved while maintaining adequate signal-to-noise due to greater recruitment of protons (Fig. 7.10).52 Comparison of the diagnostic accuracy of images acquired using 3.0- to 1.5-Tesla units in animal models has demonstrated superior signal and contrast-to-noise, resulting in improved chondral detection and more accurate cartilage lesion assessment at 3 Tesla.53,54
Laminar Appearance of Articular Cartilage
Depending on the pulse sequence used, a bilaminar or trilaminar appearance of cartilage may be noted, largely due to the more highly ordered structure of the collagen of the deeper radial zone, which yields shorter T2 relaxation times and corresponding lower signal intensity. The laminar appearance of cartilage has been well documented on very high field strength (7 Tesla) MR microscopy systems, and three zones that correlate with the three histologic zones of cartilage have been identified:55
  • A relatively hypointense radial zone
  • A higher-signal-intensity transitional zone
  • A thinner, hypointense superficial zone
The distinction among these laminae is accentuated with prolonged echo times.55 The different collagen orientation within the cartilage zones has been confirmed by transmission electron microcopy.56 Some investigators have suggested that the laminar appearance of articular cartilage may be a function

P.1109


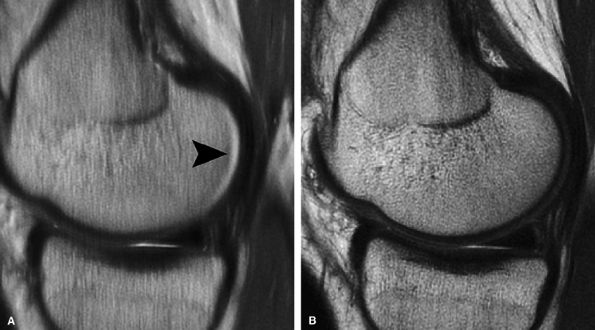
of truncation during the Fourier transform, resulting in a factitious laminar appearance that is accentuated on short TE gradient-echo sequences, particularly those with relatively low in-plane resolution.57 Truncation artifact occurs at high signal interfaces and is most typically seen in the spinal cord at the spinal fluid–cord interface, creating a “pseudo-syrinx.” It is important to remember that the laminar appearance of cartilage is markedly different on clinical MR imaging systems compared with high-field microscopy systems (or clinical systems fitted with special gradient inserts and/or optimized small sample coils). It is our experience that a trilaminar appearance of cartilage on microscopy systems indeed reflects the ultrastructure of the cartilage, and with an in-plane resolution of 300 to 350 μ, a consistent bilaminar appearance is seen on fast spin-echo techniques (with or without frequency-selective fat suppression). In most cases, however, the resolution of the superficial zone (representing approximately 10% of the overall cartilage thickness) is beyond that of standardized clinical protocols.

FIGURE 7.9 ● Fast spin-echo MR images obtained in a 0.7-Tesla open unit. (A) Sagittal image of the knee in a 40-year-old patient demonstrates a chronic tear of the posterior horn of the medial meniscus, full-thickness cartilage loss, and sclerotic changes in the subchondral bone over the medial compartment. (B) Sagittal image of the forefoot in a 48-year-old patient demonstrates active cartilage delamination (arrowhead) and flap formation over the head of the second metatarsal.
FIGURE 7.10 ● Sagittal (A) and coronal (B) fast spin-echo MR images of the knee in a 24-year-old professional football player. There is hyperintensity in the radial zone, indicating deep surface delamination (arrow), adjacent to the tidemark with no flap formation. There is also associated sclerosis of the subchondral plate. The patient underwent microfracture with a good clinical outcome.
Imaging of Articular Cartilage Structure
Although the MRI signal properties of articular cartilage reflect its ultrastructure, the spatial resolution of standardized MR imaging using conventional units demonstrates only gross morphologic and signal alterations.58 As previously mentioned, the laminar appearance of articular cartilage noted on some fast spin-echo and steady-state gradient-recalled sequences reflects the relatively shorter T2 values of the highly ordered cartilage in the radial zone, compared to the more random orientation of the collagen in the transitional zone. The bulk of the signal derives from the free water content of the cartilage. However, specific MR imaging techniques may be used to assess matrix changes by targeting additional “bound” components of the extracellular matrix, specifically proteoglycan or collagen. Loss of the negatively charged glycosaminoglycan components of proteoglycan may cause alterations in the fixed charge density of cartilage. Both traumatic cartilage injury and OA have been associated with loss of negatively charged glycosaminoglycan, and these changes may be tracked with MR imaging techniques, including positively charged sodium (23Na) MR imaging, T1 rho (T1ρ) imaging, and

P.1110


the use of negatively charged gadolinium salt contrast agents (delayed gadolinium-enhanced MR imaging of cartilage [dGEMRIC]).

These MRI techniques for assessment of matrix changes represent a dynamic field that is under development, and further review, in both longitudinal clinical studies and nonclinical studies with histologic validation, is necessary. In addition, standardization of techniques is necessary to provide reproducibility between MR imaging systems and post-processing algorithms. Clearly, no single technique will serve as a panacea for detecting early changes in cartilage degeneration, and comprehensive evaluation will likely require a combination of sequences and techniques.
Sodium MR Imaging
Like 1H, 23Na is a suitable nucleus for MR imaging. The presence of negatively charged glycosaminoglycan in cartilage generates an attraction toward the positively charged 23Na, allowing for relative measurement of fixed charge density in cartilage.59,60 Although sodium MR imaging is not in widespread clinical use, the ability to detect early OA changes as a result of proteoglycan loss may allow earlier and more accurate diagnosis of disease progression.
Reddy et al., evaluating knee cartilage in human volunteers as well as in enzyme-degraded cartilage explants,61 found decreased signal intensity on the 23Na images of the enzyme-degraded specimens and suggested that this reduced signal reflected loss of proteoglycan from the tissue. The clinical feasibility of 23Na imaging was also demonstrated in the volunteer group.61 In another study of enzyme-degraded cartilage explants, Borthakur et al. compared the results of 23Na MR imaging to spectrophotometric assay-determined proteoglycan concentrations and noted that the signal change on 23Na imaging correlated well with the observed proteoglycan loss, suggesting that 23Na MR imaging was both sensitive and specific in the detection of proteoglycan concentration.62 Interestingly, there was no correlation between proteoglycan loss and changes in proton T1 and T2 relaxation times.62 Wheaton et al. studied fixed charge density maps calculated from 23Na MR imaging in both healthy volunteers and patients with clinical symptoms of early-stage OA. Focal areas of decreased fixed charge density could be found in those with symptomatic OA, suggesting the loss of proteoglycan from the matrix.63
The lower signal-to-noise noted in 23Na imaging compared to proton MR imaging reflects the natural lower abundance of 23Na.63 Requirements for special transmit and receive coils, as well as relatively long scan times, may limit its application to clinical cartilage imaging.64,65
T1 rho (T1ρ) Imaging
There has been increased interest in the recent literature in the use of T1 rho (T1ρ) imaging to detect an alteration in fixed charge density and regional variation of proteoglycan content. The spin-locking pulse sequence uses a cluster of RF pulses:
  • A 90° pulse to flip magnetization into the y axis
  • A spin-locking pulse along the y axis, “locking” the magnetization in the transverse plane
  • A second 90° pulse to drive the magnetization back to the z axis
T1ρ or spin-lattice relaxation in the rotating frame has been used to investigate low-frequency interactions between hydrogen nuclei in macromolecules and free water.66 Although incorporation of a spin-lock pulse into clinical MR imaging protocols has been suggested, it has not become common because of concern over the increased tissue specific absorption rate (SAR) associated with these special pulses.67 SAR is increased because T1ρ imaging requires more RF power than conventional pulse sequences. Unlike spin-spin relaxation (T2), however, which is inherently susceptible to local field inhomogeneities and susceptibility variations, the effect of the spin-locking pulse minimizes spin dephasing and thus reduces the effect of regional inhomogeneities and susceptibility artifact.66 The spin-locking pulse promotes phase coherence along the locked spins during contrast evolution time, thus making these images potentially less susceptible to artifact.67
Correlation of T1ρ with fixed charge density has been performed in both enzyme-degraded bovine and osteoarthritic human explants. Plots of normalized T1ρ rates were found to be strongly correlated to fixed charge density and to corresponding loss of proteoglycan, as confirmed by histologic tissue inspection.68 Some investigators, however, have questioned the specificity of T1ρ in the detection of proteoglycan alterations. In molecular suspensions without a matrix, both T2 and T1ρ demonstrate an exponential decrease with increasing collagen and glycosaminoglycan concentration, with the effects of collagen dominating.68
T1ρ has been studied in an animal model in which OA was induced by intra-articular injection of recombinant interleukin-1β (IL-1β), causing degradation of proteoglycan via increasing expression and activation of matrix metalloproteinases (MMPs).69 In this animal model, the T1ρ relaxation rate (R 1βρ = 1/T1ρ) of the IL-1β–treated patellae was, on average, 25% lower than that found in control (saline-injected) patellae; fixed charge density (as measured via correlative 23Na MR imaging) was also found to be reduced by an average of 49%.69 These studies demonstrate the potential application of noninvasive MR imaging techniques in the assessment of matrix alteration and provide further support for the clinical use of MRI in the study of degraded cartilage and the eventual development of tissue-engineered cartilage.
In a clinical setting, studies have shown the feasibility of performing T1ρ measurements in cartilage without exceeding the FDA limits of SAR. In one study, images obtained with fat suppression at 1.5 Tesla were compared to standardized T2-weighted images.70 Although findings suggested that T1ρ is more effective than T2 in highlighting chondral abnormalities,70 the T2-weighted sequence used was not an optimized cartilage technique. Additional studies have shown that T1ρ imaging at 1.5 Tesla is feasible and that T1ρ relaxation times are significantly elevated in symptomatic compared to asymptomatic patients.71 Additional studies will be necessary to gain greater clinical acceptance of these techniques. In addition, ready availability of the spin-locking RF pulses for clinical scanners is needed before T1ρ imaging can be widely used.

P.1111


dGEMRIC Techniques
Articular cartilage structure and fixed charge density can also be assessed using gadolinium contrast. In this technique, the negatively charged gadolinium salts diffuse from the synovial fluid into the cartilage as a function of regional fixed charge density, with increasing concentration of negatively charged gadolinium salts in areas of relatively depleted negatively charged proteoglycans. MR imaging at 8.4 Tesla and sodium spectroscopy in intact, enzyme-degraded, and IL1-induced cartilage degeneration showed good correlation with histologic evidence of proteoglycan depletion,72 and there are differences in T1-weighted and T1-calculated images in the presence of negatively charged gadolinium agents, but not in the presence of a neutral (nonionic) contrast agent.73
Clinical protocols for cartilage evaluation involve the intravenous injection of 0.2 mmol/kg gadopentetate dimeglumine, followed by mild exercise for 10 minutes to facilitate transport of contrast into the cartilage, followed by an 80-minute wait period. A series of T1-weighted images are then acquired with a fast inversion recovery pulse.74 This technique, known as delayed gadolinium-enhanced MRI of cartilage (dGEMRIC), creates an index of relative glycosaminoglycan distribution (the T1Gd index) (Fig. 7.11). The T1Gd index can be used to evaluate OA and other disorders involving articular cartilage.74,75,76 Reproducible findings can be found for standardized regions of interest (ROIs), when a large ROI is drawn over the weight-bearing segment of the condyles, using the meniscus in the sagittal plane as a guide.75 The dGEMRIC index was found to have a higher correlation with clinical symptoms on the Western Ontario and McMaster University Osteoarthritis Questionnaire than the presence of arthrosis on radiographs. This finding suggests that MR imaging techniques are more suitable than secondary bony changes and joint space narrowing on radiographs in assessing the magnitude of OA.76
FIGURE 7.11 ● Sagittal T1 gadolinium-enhanced images of the knee demonstrate global and focal ranges of glycosaminoglycan distribution (T1Gd) index. (A) The lateral compartment in a 26-year-old female professional dancer shows high-range (blue-green) T1Gd values for the tibial plateau and the weight-bearing zones of the femoral condyle compartments. (B) The medial compartment in a 78-year-old woman with moderately severe OA demonstrates low-range T1Gd values (red). (Reprinted by permission of

American Roentgen Ray Society, from AJR Am J Roentgenol. 2004; 182:167-172.

)

T2 Mapping
T2 mapping can be used to reflect the collagen component of the extracellular matrix. T2 mapping is a well-described MR imaging technique that reflects the internuclear (spin-spin) dephasing that occurs as a result of transverse relaxation of the excited hydrogen nuclei. To a large extent, the stratification of gray scale seen in fast spin-echo imaging of articular cartilage reflects the orientation of the collagen in the extracellular matrix. The spatial variation of cartilage T2 follows the architectural arrangement of the collagen fibril network as assessed by polarized light microscopy,77 much as MR microscopy zones based on T2 profiles are based on collagen fiber orientation.78 In addition, there is no observed change in regional T2 in areas of mechanically undamaged cartilage with decreased proteoglycan content.79
Quantitative assessment of T2 relaxation time is also influenced by the structural anisotropy of collagen within the matrix. In highly ordered structures such as normal tendons and ligaments, the diminished signal intensity is largely due to enhanced dipole–dipole interactions, with short T2 relaxation. The magic angle effect in articular cartilage describes the mathematical relationship between the spinning hydrogen nuclei within the collagen component of cartilage and the long axis of the magnetic field, which in a closed unit runs

P.1112


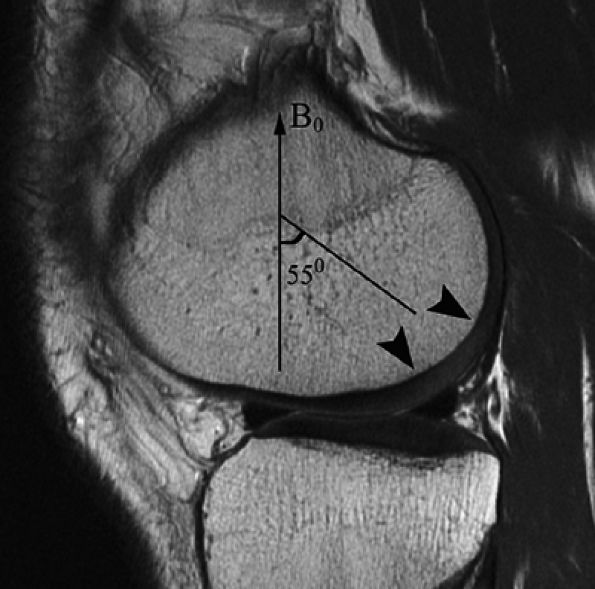
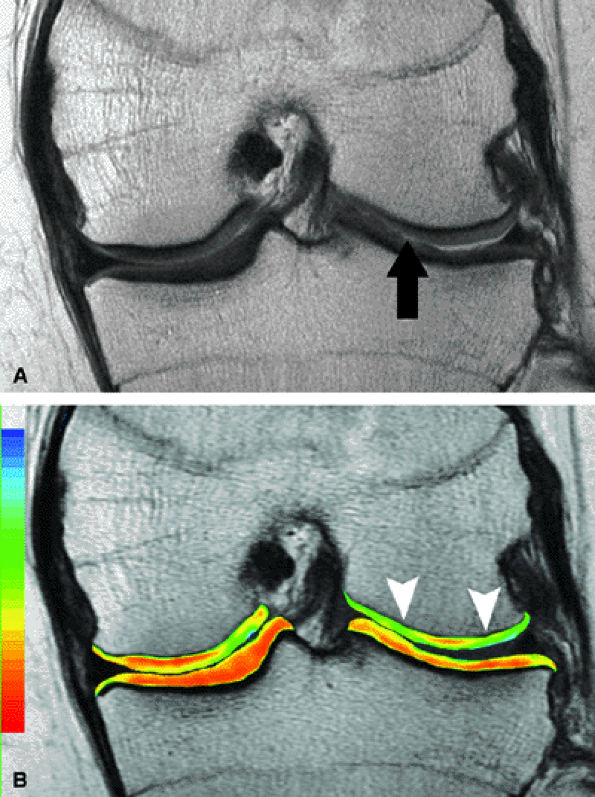
parallel to the long axis of the patient.80 When the angle between the external field and the hydrogen nuclei in collagen reaches approximately 55°, there is a corresponding prolongation of T2 relaxation time according to the relationship 1/T2 = k(3cos2&thetas; – 1). In the radial zone, where the collagen is highly ordered, expected prolongation of T2 has been noted in both high field strength microscopy systems at 7 Tesla as well as in images acquired on 1.5-Tesla units.80 Recognition of the magic angle effect in cartilage is important since it may produce apparent increased signal intensity in the radial zone at 55° (Fig. 7.12). Since the magic angle effect may hamper the measurement of cartilage regions of interest, caution should be used to avoid sampling T2 values at the magic angle.

FIGURE 7.12 ● A sagittal fast spin-echo MR image of the knee in a 26-year-old man demonstrates the magic angle effect (arrowheads), causing prolongation of T2 with focal loss of gray-scale stratification at 55° relative to the external magnetic field (B0), indicating highly ordered structure components in the cartilage matrix. Note the normal gray-scale stratification of the remaining medial femoral condyle and tibial plateau.
Regional differences in cartilage T2 have also been noted. In one study of cartilage T2 as a function of orientation to the magnetic field, the largest variation in T2 was reported to have occurred in the transitional rather than the radial zone.81 These regional variations in T2 may be due to differences in the degree of cartilage compression, with resulting alteration in collagen fiber orientation, causing an attenuation of the magic angle effect.81,82 Others have noted increased T2 in both the radial and transitional zones at 55°, suggesting that the collagen fiber orientation in the transitional zone was not entirely random.83 Goodwin et al. noted a complex, 3D joint geometry in which there was a continuous macrostructure radiating from the subchondral bone into the plane of the joint surface, similar to that noted on fracture sectioning, and suggested that this structure could account for the regional differences in T2 (Fig. 7.13).84 The bulk curvature of cartilage also appears to create a depth-dependent variation in fiber orientation, and T2 differences may be related to the finding that the transitional layer appears to be much thicker in the submeniscal zone of tibial plateau compared to the central portion of plateau, where there is an apparent increase in the thickness of the radial zone.84 In evaluating T2 mapping obtained from different areas of a joint, it is important not to mistake longer T2 values that reflect regional variation in collagen macrostructure for prolonged T2 in the setting of cartilage damage.36,84
The method by which quantitative data is attained can also affect measurements.85,86 Although multiecho pulse sequences are more efficient in obtaining individual echo information, variations in the 180° refocusing pulses may generate both T1 and T2 contrast. Care should be taken, therefore, when using a multiecho, multislice sequence in which there are both stimulated echo contributions in the slice direction (increasing measured T2 values) and magnetization transfer between slices (decreasing measured T2 values).85 Chemical shift misregistration through the interface between fat (bone) and water (cartilage) can also generate errors in quantitative measurements.
In the evaluation of OA, T2 mapping can provide information about cartilage permeability and breakdown in collagen structure.87,88 When collagen is destroyed, hydrogen dipoles become more mobile and T2 values increase, resulting in corresponding loss of stratification (Fig. 7.14). Using MR imaging with a spin-echo sequence at 1.5 Tesla, David-Vaudey et al. confirmed that increased T2 is correlated with histologic degeneration of cartilage.89 In studies of OA using

P.1113


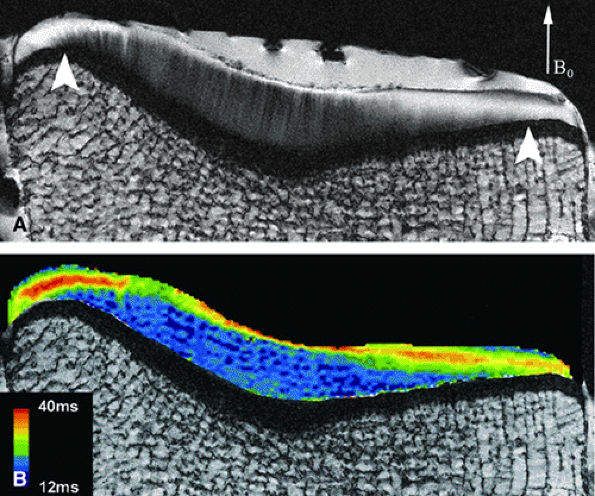
a 7-Tesla magnet, several changes, including a decrease in superficial zone thickness, an increase in total cartilage thickness over the submeniscal regions, and a shift in the maximum T2 of the articular surface were found. These findings indicate that the collagen of the superficial zone is disrupted in early stages of OA.90 Further, the increasing T2 of the superficial zone was detected in OA specimens obtained from portions of the tibia covered by meniscus, suggesting that these regions may show earlier signs of cartilage degeneration, before it is evident in other (more central) areas of the joint. These regional differences are most likely due to alteration in structural properties related to weight-bearing areas of the joint.84,90

FIGURE 7.13 ● (A) Lateral tibial plateau of a 35-year-old woman. B0 = main magnetic field. In the central region of the plateau, prominent radial striations extend across a thick deep layer. Minor fibrillation is seen at the low-signal-intensity surface. In submeniscal and tibial eminence regions (arrowheads), the transitional layer is much thicker. (B) On a corresponding T2 map, changes in T2 parallel changes in signal intensity. Peak T2 values are located in the middle of transitional layer. (Reprinted by permission of

American Roentgen Ray Society, from AJR Am J Roentgenol. 2004; 182:311-318.

)

Changes in Young—s modulus (mechanical properties) as well as alterations in polarized light microscopy correlate well with T2 mapping.90 When the relationship of T2 relaxation time and dGEMRIC is compared to static and dynamic compressive moduli, there is a statistically significant correlation

P.1114


between MRI and mechanical parameters, especially between T2 and Young—s modulus.91 Similarly, it has been shown that prolongation of T2 occurs early following meniscectomy, correlating with observable biomechanical changes using indentation probe testing as well as polarized light microscopy.92

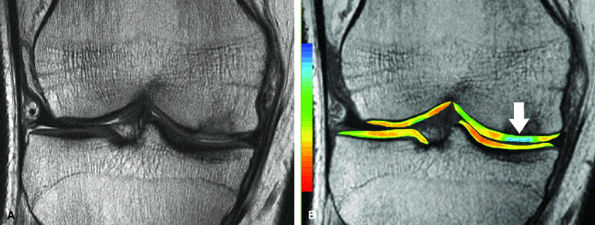
FIGURE 7.14 ● (A) Axial fast spin-echo MR image of the knee in a 25-year-old avid marathoner with anterior knee pain demonstrates focal increased signal (arrowhead) affecting normal-thickness cartilage of the lateral patella facet with subchondral sclerosis. (B) Corresponding quantitative T2 relaxation time map demonstrates geographic loss of stratification and prolongation in T2 values (arrowhead) throughout the thickness of the cartilage at this site.
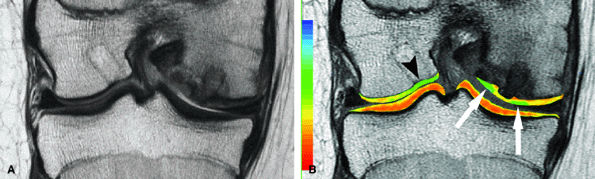
FIGURE 7.15 ● (A) Coronal fast spin-echo MR image of the knee in a 15-year-old girl with a previous partial meniscectomy demonstrates mild fibrillation of the cartilage overlying the lateral tibial plateau (arrow). (B) Corresponding quantitative T2 relaxation time map of the femorotibial articular cartilage coded to capture T2 values ranging from 0 to 100 msec demonstrates prolongation of T2 values over the plateau, but with unexpected prolongation over the lateral femoral condyle (arrowheads), which appeared normal on standard fast spin-echo cartilage-sensitive imaging. Green and blue reflect longer T2 values, yellow intermediate, and orange the shorter values.
The use of T2 mapping techniques may prove helpful in detecting changes in the structure of cartilage prior to significant loss of cartilage thickness or gross signal alterations in the cartilage gray scale, potentially optimizing the timing of surgical procedures, such as meniscal transplantation and patellofemoral realignment, which are aimed at delaying the progression of OA (Fig. 7.15). In a study comparing subjects who were considered healthy, as having mild OA, or as having severe OA, T2 mapping was combined with anatomic gradient-echo models of the femorotibial joint, allowing for comparison of cartilage T2, volume, and thickness.93 Although no significant difference was found between patients with mild and severe OA, all cartilage compartments except the lateral tibial plateau showed a significant increase in T2 values between healthy subjects and OA patients.93
T2 mapping may also be useful in the evaluation of patients with chondromalacia patellae. Spatial variation in T2 has been found as a function of both age and symptoms, with age being associated with an asymptomatic increase in T2 within the transitional zone of cartilage.94 An age-dependent increase in T2 was not observed in the radial zone, which the authors attributed to the higher tissue anisotropy of this region.94

P.1115


Clinical Cartilage Imaging
Cartilage Imaging in Traumatic Lesions
MR imaging following injury provides noninvasive evaluation of cartilage. With MR imaging it is possible to detect clinically relevant lesions such as a displaced cartilage flap or shear that can mimic a displaced meniscal tear in the knee or a displaced labral tear in the hip (Fig. 7.16). Preoperative knowledge of such lesions is important since it can aid in preoperative planning as well as in preparing for postoperative rehabilitation.36 Careful scrutiny of traumatic cartilage injury is necessary to distinguish an isolated cartilage shearing injury from an osteochondral fracture, the latter of which is amenable to direct repair. Osteochondral injuries are recognized either by the presence of hyperintense fatty marrow attached to the cartilage fragment or, more commonly, by the absence of the thin, low-signal-intensity subchondral plate between the cartilage and the bone (Fig. 7.17).
In the setting of anterior cruciate ligament (ACL) disruption, information about the natural history of associated cartilage injuries helps provide better insight into their significance and the potential need for chondral protection. A bone bruise associated with tibial translation and the pivot shift has been recognized as a reflection of substantial damage to normal

P.1116


articular cartilage homeostasis, with biopsy samples demonstrating degeneration of chondrocytes with loss of matrix as well as osteocyte necrosis and empty lacunae.95 Spindler et al., in a prospective evaluation of patients who underwent ligament reconstruction, found cartilage lesions, most commonly located over the lateral femoral condyle, in 46%.96 Although there does not seem to be a correlation between articular cartilage lesion size and postoperative clinical outcome, patients with a high-grade partial or complete cartilage defect seen at the time of reconstruction had significantly lower subjective scores compared to those without defects.97 MR follow-up studies demonstrate cartilage thinning adjacent to the site of the initial osteochondral lesion.98

FIGURE 7.16 ● Coronal fast spin-echo MR image of the hip in a 28-year-old patient with active cartilage delamination and flap formation (arrowhead) over the weight-bearing aspect of the femoral head.
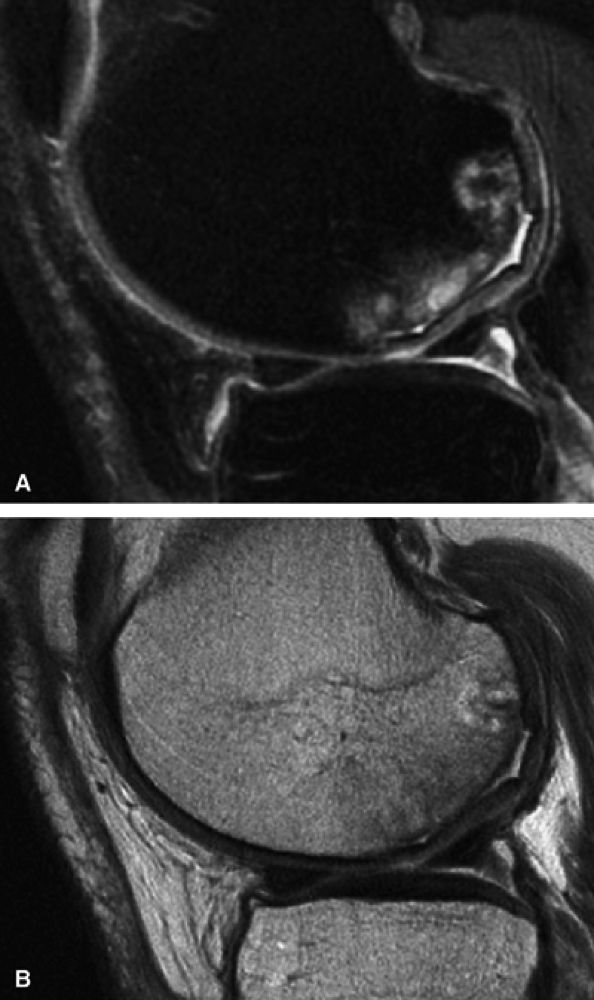
FIGURE 7.17 ● Axial (A) and sagittal (B) fast spin-echo MR images of the knee in a 15-year-old boy following a patellar dislocation demonstrate an osteochondral fracture of the medial facet (arrows). The displaced osteochondral fragment is seen against the synovial reflection of the ACL (arrowhead). Note the presence of high-signal-intensity bone marrow, low-signal-intensity subchondral plate, and intermediate-signal-intensity cartilage in the displaced fragment, distinguishing it from an isolated chondral shear.
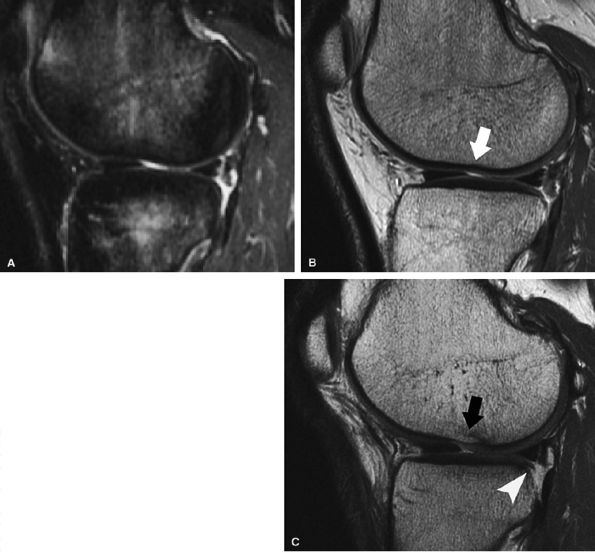
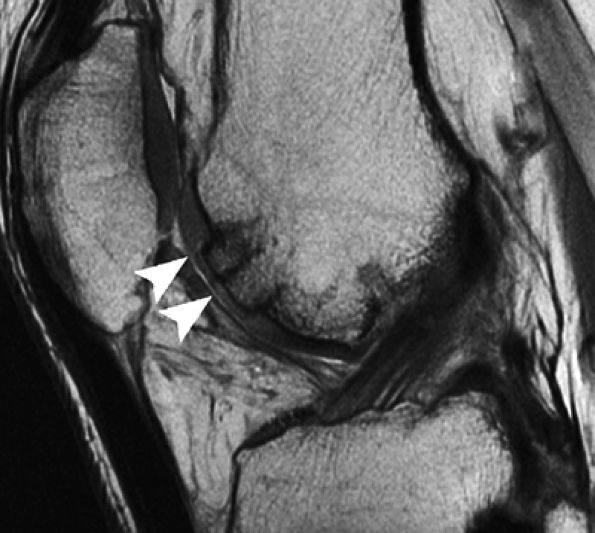
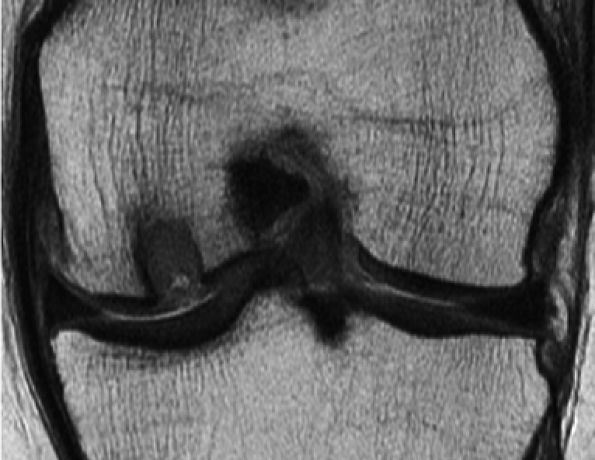
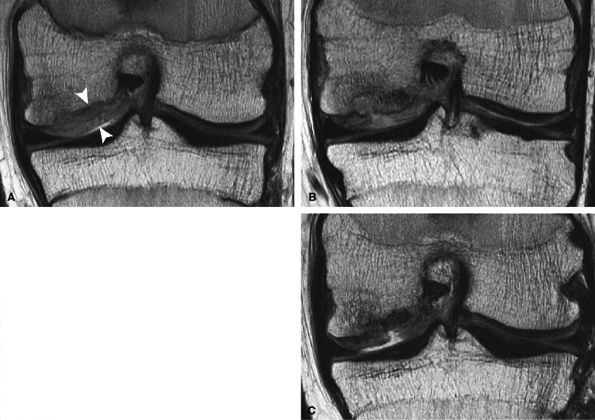
FIGURE 7.18 ● Prospective MR evaluation of a bone bruise in the knee of a 28-year-old man with a complete ACL tear. Sagittal fat-suppressed (A) and fast spin-echo (B) MR images obtained at the time of injury demonstrate characteristic bone marrow edema with compression of cartilage over the lateral femoral condyle (white arrow). A sagittal MR image obtained 19 months later (C) demonstrates proud subchondral bone with focal cartilage loss over the condyle (black arrow), as well as flap formation over the tibial plateau (arrowhead). (Reprinted by permission of SAGE Publications, Inc., from Am J Sports Med, in press.)
In our experience, with careful scrutiny and appropriate pulse sequencing, all complete ACL tears can be seen to be consistently associated with some degree of cartilaginous injury (Fig. 7.18). It is important to note that many of the subtle, eccentrically located cartilage injuries seen on MR imaging may be arthroscopically occult.36 In addition, dGEMRIC imaging in ACL injury has demonstrated a decreased relative glycosaminoglycan content over the bone bruise of the lateral femoral condyle.99 Of interest, a decrease in glycosaminoglycan content was also seen in the medial femoral condyle, where no bone bruise was seen, suggesting that there may be a global alteration in regional cartilage biology leading to matrix depletion.99

P.1117


Cartilage Imaging in Osteoarthritis
The bone marrow edema pattern is a nonspecific MR imaging finding that does not necessarily indicate a traumatic cartilage injury. Indeed, in chronic OA, subchondral bony remodeling in the face of significant cartilage loss generates a bone marrow edema pattern that should not be misinterpreted as tumor infiltration of bone or osteonecrosis, particularly in the absence of a segmental subchondral fracture or demarcation of a necrotic–viable bone interface (Fig. 7.19).100 Correlation of findings on pre-arthroplasty fast spin-echo and STIR imaging with histologic evaluation of post-arthroplasty explants disclosed that the bone marrow edema pattern reflects a number of noncharacteristic histologic findings, including bone marrow fibrosis as well as unremarkable fatty marrow and trabeculae.101 It is important to remember that in many cases the bone marrow edema pattern is a sign of mobilization of the free water that is normally restricted from movement by the radio-frequency pulses, rather than an overall increase in regional water content. Nonetheless, it has been suggested that OA patients with a bone marrow edema pattern are at risk for further cartilage deterioration, as evidenced by radiographic progression of OA in these patients. The changes may be partially explained by the presence of associated varus or valgus malalignment.102
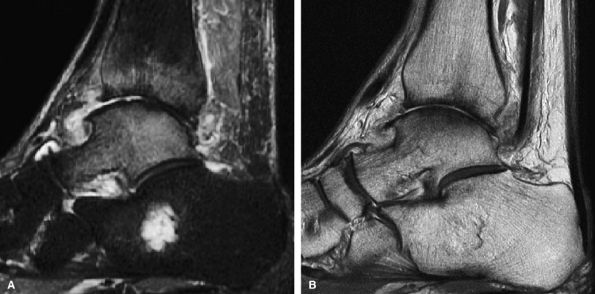
FIGURE 7.19 ● (A) Sagittal fat-suppressed MR image of the ankle in a 64-year-old man with OA of the tibiotalar joint demonstrates bone marrow edema pattern over both sides of the joint. (B) The corresponding cartilage-sensitive MR image demonstrates full-thickness cartilage loss, anterior osteophyte formation, and subchondral sclerosis. The presence of bone marrow edema over both sides of a joint in the setting of OA does not indicate superimposed fracture or osteonecrosis.
There has been increasing interest in the use of MR imaging in the longitudinal evaluation of cartilage in epidemiologic and clinical studies of OA. Peterfy et al. have proposed a semiquantitative scoring system for OA using fat-suppressed 3D T1-weighted gradient-echo images and fat-suppressed T2-weighted fast spin-echo images.103 Scores were based on multiple factors, including:
  • Signal intensity and cartilage morphology (thickness)
  • Subchondral bone marrow edema or cysts
  • Subchondral flattening or depression
  • Osteophytes
  • Synovial thickening/joint effusion
  • Loose bodies
  • Integrity of the cruciate ligaments, collateral ligaments, and menisci103
Although there is relatively high interobserver agreement for scoring using this system, it is felt that further studies are necessary before MR imaging can be used as a primary endpoint for evaluating patients— response to therapy targeted to OA.103,104
Cartilage Imaging in Smaller Joints
Proper evaluation of the articular cartilage of joints such as the shoulder, elbow, wrist, and feet requires meticulous attention to pulse sequence parameters, such as the choice of higher in-plane and slice resolution to detect partial-thickness defects in the thinner cartilage lining these joints. Greater demands are also placed upon the surface coil design, particularly when imaging off center, close to the sides of the imaging bore, and using concomitant frequency-selective fat suppression. With adherence to proper technique, reproducible, accurate imaging of the cartilage of these joints is possible (Figs. 7.20 and 7.21).

P.1118


P.1119


Cartilage Imaging in Repair
Because of the avascular nature of hyaline cartilage, there is little to no inherent capacity for spontaneous repair.105 Lesions suitable for repair range from isolated, “well-shouldered” defects created by traumatic shear to large segments of secondary cartilage delamination created by collapse of the subchondral bone from necrosis (Fig. 7.22). The rapidly expanding field of cartilage repair encompasses different approaches and resurfacing techniques, including simple debridement, abrasion chondroplasty and microfracture,106 autologous osteochondral transplantation,107 allograft transplantation,108,109 and tissue-engineered constructs, such as autologous chondrocyte implantation.
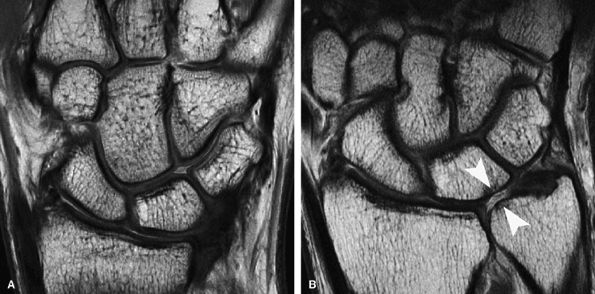
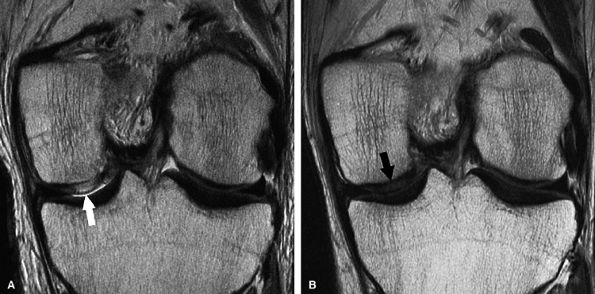
FIGURE 7.20 ● (A) Coronal fast spin-echo MR image of the wrist in a 28-year-old patient with normal articular cartilage. (B) A 61-year-old patient with ulnolunate impaction syndrome demonstrates full-thickness cartilage loss over the distal ulna and proximal pole of the lunate (arrowheads), with sclerotic change in the subchondral bone. Note also the full-thickness central defect in the articular disc.
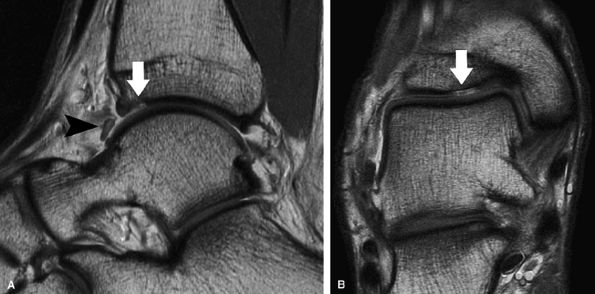
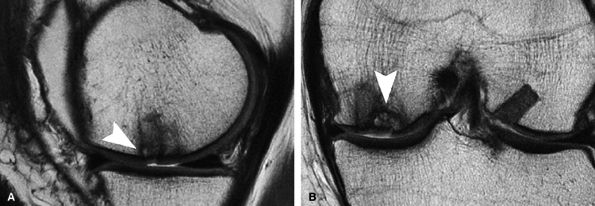
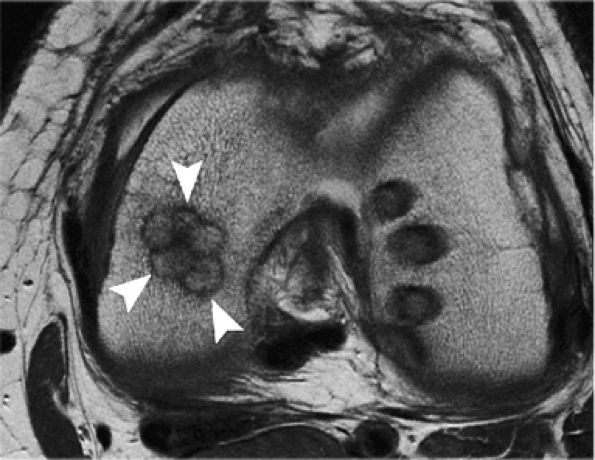
FIGURE 7.21 ● Sagittal (A) and coronal (B) fast spin-echo MR images of the ankle in a 16-year-old patient demonstrate an osteochondral shearing injury (arrows) over the anterior margin of the tibial plafond. A free cartilaginous fragment (arrowhead) in the anterior recess is present. Cartilage over the talar dome is preserved.
Microfracture
One of the most popular resurfacing techniques is microfracture, which entails drilling very small holes (“microfractures”) into the subchondral bone beneath the denuded cartilage. The technique prompts release of multipotential stem cells from the marrow, which create a covering of largely reparative fibrocartilage with smaller elements of hyaline-like cartilage over the defect (Fig. 7.23).110 The best results are correlated with good MRI fill grade, low body mass index (BMI), and short duration of preoperative symptoms.111
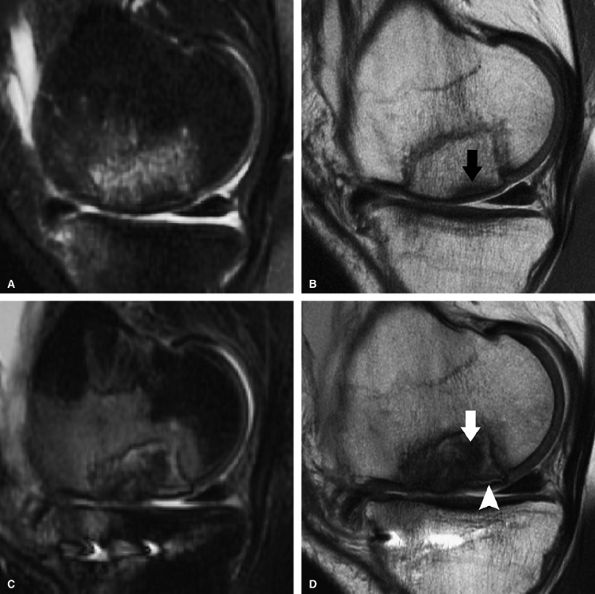
FIGURE 7.22 ● Sagittal fat-suppressed (A) and fast spin-echo (B) MR images of the knee in a 57-year-old man with extensive osteonecrosis and subchondral collapse of the posterior margin of the lateral femoral condyle. Note the secondary delamination of the overlying cartilage with fluid imbibition between subchondral bone and cartilage.
The signal characteristics of microfracture largely reflect the time interval between repair and MR imaging. In the initial postoperative period, the signal characteristics are largely hyperintense to native cartilage, consistent with increased mobility of water due to a less organized matrix.111,112,113 In addition to the early appearance of hyperintense repair

P.1120


P.1121


cartilage, Mithoefer et al. noted an underlying bone marrow edema pattern, followed by progressive filling and a decreasing bone marrow edema pattern.111 Overgrowth of subchondral bone has also been described following microfracture,111,112 resulting in corresponding thinning of the overlying repair cartilage as well as the potential for impaction of the opposing surface of the joint during active loading. Although osseous overgrowth is a not uncommon finding, it does not correlate with a statistically significant worsening in clinical outcome.111 The significance of subchondral bone overgrowth is not yet certain, but it might reflect excessive removal of the subchondral bone during debridement and removal of the calcified cartilage layer, thus providing a stimulus for enchondral ossification (Fig. 7.24).114 Postoperative peripheral integration may be incomplete, and discernible fissures can be seen in the majority of patients on postoperative MR imaging.111

FIGURE 7.23 ● Sagittal inversion recovery (A) and axial fast spin-echo (B) MR images of the knee in a 31-year-old patient obtained 7 weeks following microfracture over the trochlea. Note the hyperintense reparative fibrocartilage over the defect (arrows). Sagittal fast spin-echo MR image (C) also demonstrates basilar delamination of cartilage without flap formation (arrowhead) adjacent to the area of microfracture, over the lateral margin of the trochlea.
FIGURE 7.24 ● Sagittal fast spin-echo MR image of the knee in a 19-year-old patient, performed 15 months following microfracture of the posterior margin of the lateral femoral condyle and 12 months following microfracture of the lateral tibial plateau, demonstrates proud subchondral bone formation (arrows) and hyperintense reparative fibrocartilage over the sites of cartilage repair.
T2 mapping techniques can be used to assess cartilage repair. In our experience, T2 mapping obtained following microfracture has markedly prolonged T2 relaxation times compared to the adjacent and opposite hyaline cartilage (Fig. 7.25).
FIGURE 7.25 ● (A) Coronal fast spin-echo MR image of the knee in a 24-year-old professional basketball player obtained 3 months following microfracture of the medial femoral condyle demonstrates good fill by hyperintense reparative fibrocartilage. (B) Corresponding quantitative T2 relaxation time map coded to capture T2 values ranging from 0 to 100 msec demonstrates prolongation of T2 relaxation times (arrow), reflecting the reparative fibrocartilage and a less organized matrix. Green and blue reflect longer T2 values, yellow intermediate, and orange the shorter values.

P.1122


Osteochondral Autografts and Allografts
The term OATS, originally used as an acronym for osteochondral autograft transplantation or transfer system, is used to refer not only to autografts (autograft OATS) but also to osteochondral allografts (allograft OATS) and to transplantation with tissue scaffolds (scaffold OATS). In autograft OATS, one or more plugs are harvested from a “less important” portion of the joint (typically the intercondylar notch or far anterior margin of the condyles) and transferred into a defect over the weight-bearing margin of the joint. Autografts require careful operative planning to duplicate the geometry of the joint, and they also create some donor-site morbidity. In osteochondral allograft transfers (allograft OATS or OCA), cadaveric bone–cartilage plugs are implanted into a defect. They are most suitable for very large defects, such as those created by areas of osteonecrosis with collapse or by osteochondritis dissecans.
Although assessment of patient outcome, as judged by pain and function scores, is clinically relevant, objective evaluation of repair provides insight into the natural history of cartilage resurfacing techniques. Traditionally, objective assessment was made by histologic evaluation of biopsy specimens.115 MR imaging, however, is extremely well suited to noninvasive evaluation of cartilage repair, since it not only displays the 3D geometry of joints with high in-plane as well as slice resolution but also demonstrates superior soft-tissue contrast. The information gained from MR imaging studies is thus complementary to more subjective clinical data.112 Brown et al. have proposed an MR imaging assessment system for cartilage transplantation and microfracture that includes several variables, including:112
  • Relative signal intensity from the repair cartilage using a standardized ROI on an MR imaging workstation
  • Presence or absence of delamination
  • Nature of the interface with the native cartilage (presence or absence and/or size of fissures)
  • P.1123


  • Percentage fill of the lesion using both coronal and sagittal images
  • Assessment of the integrity of the articular cartilage in the surrounding environment, including cartilage in the adjacent and opposite surfaces
As it is with microfracture, peripheral integration is a challenge with both autologous osteochondral transfer and osteochondral allograft transplantation. When peripheral integration was studied in a canine model using cartilage-sensitive MR imaging and T2 mapping, trabecular incorporation (defined as apparent osseous integration with no residual bone marrow edema pattern) was found in 89% of specimens at 6 months. On histologic inspection, however, both allograft and autograft specimens demonstrated a cleft at the host–graft cartilage interface, indicating incomplete peripheral integration at the articular surface. These findings support the evidence that articular cartilage cannot regenerate across a physical gap.116 In addition to peripheral integration and osseous incorporation of the plug, the degree of restoration of the geometry of subchondral bone is another challenge encountered with osteochondral transfer.
MR imaging of the site of cartilage repair provides a tomographic assessment of the degree of offset of the subchondral plate and also an evaluation of the articular surface, providing more detailed information than can be obtained at second-look arthroscopy (Fig. 7.26).117 T2 mapping techniques can be very helpful in assessing not only the orientation of the collagen over the site of the cartilage repair but also the response of the adjacent cartilage to the surgically manipulated cartilage (Fig. 7.27). Unlike T2 mapping obtained following microfracture, T2 relaxation times observed

P.1124


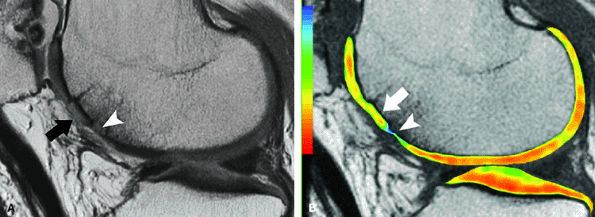
with autologous osteochondral transplantation are closer to that of the remaining portion of the joint (Fig. 7.28).

FIGURE 7.26 ● Sagittal MR image of the knee in a 37-year-old patient obtained 12 months following autologous osteochondral transfer to the trochlea demonstrates that although the osseous components of the plugs are proud relative to subchondral bone, the repair cartilage is flush with that of the native cartilage, with restoration of the radius of curvature of the joint surface. Note the high signal intensity at the repair–native cartilage interface (arrowheads).
FIGURE 7.27 ● (A) Coronal fast spin-echo MR image of the knee in a 13-year-old girl obtained 3 months following autologous osteochondral transfer for osteochondritis dissecans of the medial femoral condyle. Despite the relatively thin cartilage over the proud osseous component of the osteochondral plug, there is good restoration of the radius of curvature of the articular surface. Note that the donor site in the lateral femoral condyle close to the notch is filled with autologous bone, covered by reparative material that is hyperintense to native cartilage. (B) Corresponding quantitative T2 relaxation time map coded to capture T2 values ranging from 5 to 100 msec demonstrates prolongation of T2 relaxation times at the margins of the osteochondral lesion (arrows). There is prolongation of T2 values at the margins of the plugs (arrows) and over the donor site (arrowhead), reflecting reparative fibrocartilage and a less organized matrix. Green and blue reflect longer T2 values, yellow intermediate, and orange the shorter values. (Reprinted by permission of SAGE Publications, Inc., from Am J Sports Med, in press.)
FIGURE 7.28 ● (A) Sagittal fast spin-echo MR image of the knee in a 53-year-old patient, obtained 2 years following autologous osteochondral transfer of the central trochlea. Note the hyperintensity of the cartilage of the osteochondral plug (black arrow) and adjacent inferior trochlear groove chondral loss (white arrowhead). (B) Corresponding quantitative T2 relaxation time map demonstrates mild prolongation of T2 values (white arrow) relative to the remaining normal cartilage within the joint, with preservation of T2 stratification. Note the full-thickness cartilage loss at the inferior margin of the plug, where there is marked prolongation of the T2 values (white arrowhead).
Another important element in osteochondral transfer is restoration of the radius of curvature, which is important in maintaining the biomechanical integrity of the plugs. Koh et al. noted that peak contact pressures were significantly elevated (approximately 20%) after creation of a defect, were reduced to normal when the plugs were flush, and were significantly increased when the plugs were elevated.118 Of note, contact pressures with depressed plugs were significantly higher than with intact cartilage, but were lower than those associated with an empty defect (Fig. 7.29).118 Others have noted that proud plugs may undergo “repositioning” due to the effects of weight bearing, but subchondral cavitations were often present, suggesting excessive motion between the graft and recipient site.119
Assessment of trabecular incorporation is based on visualization of bony continuity from the plug to the host bone,

P.1125


restoration of the normal fatty signal intensity of the plug, and lack of displacement. The use of both cartilage-sensitive and fat-suppressed imaging is therefore essential in assessing not only the integrity of the articular surface but also the degree of host subchondral bone turnover at the site of plug incorporation. The presence of low signal intensity on all pulse sequences strongly suggests loss of bone viability, which may lead to eventual implant failure (Fig. 7.30). Often multiple plugs are used, sometimes requiring instrumentation, and appropriate modification of pulse sequence parameters is necessary to reduce the associated susceptibility artifact in the case of metallic fixation. Alternatively, a “press fit” fixation

P.1126


may be used, and in this situation care must be taken to avoid mistaking the low-signal-intensity compression of trabeculae at the side wall of the implant for failure of the plug to incorporate (Fig. 7.31).

FIGURE 7.29 ● Sagittal (A) and coronal (B) fast spin-echo MR images of the knee in a 41-year-old patient obtained 3 months following autologous osteochondral transfer using multiple plugs. There is overall good bony incorporation of the osteochondral plugs, but with focal cystic change and collapse of subchondral bone centrally (arrowhead in A and B). Note that the donor site (B) over the lateral aspect of the intercondylar notch is filled with hyperintense material, likely representing reparative fibrocartilage.
FIGURE 7.30 ● Sagittal inversion recovery (A) and fast spin-echo (B) MR images of the knee in a 36-year-old patient performed 1 year following fresh-frozen allograft transplantation in the medial femoral condyle. The allograft is slightly proud with persistent bone marrow edema pattern, both within the graft and at the graft-host interface, associated with mild subchondral collapse (black arrow in B). Corresponding inversion recovery (C) and fast spin-echo (D) MR images obtained a year and a half later, with interval tibial osteotomy, demonstrate further collapse of the allograft bone, with the areas suspicious for the presence of nonviable bone (white arrow), which is of low signal intensity on both pulse sequences. Note also the fluid imbibition (arrowhead in D) beneath the graft subchondral plate.
FIGURE 7.31 ● Axial fast spin-echo MR image of the knee performed 3 months following autologous osteochondral transfer using multiple plugs to restore a large osteochondral defect of the medial femoral condyle. Note consolidation of trabeculae (linear low signal intensity) around the plugs (arrowheads) as a result of the “press fit” fixation. Donor sites are seen in the lateral femoral condyle, close to the notch.
Delayed incorporation may be related to allograft rejection. Sirlin et al. studied 36 shell osteochondral allografts, comparing MR findings to immunohistochemistry, and noted that antibody-positive patients demonstrated a greater degree of bone marrow edema pattern than antibody-negative patients.120 Antibody-positive patients also demonstrated a higher proportion of surface collapse.120 These findings suggest that a biologically predictable response of recipient to allograft bone may account for delayed integration on MR imaging, and this information may prove predictive of eventual collapse and implant failure.
Concerns about donor-site morbidity associated with autologous osteochondral transfers and disease transmission associated with allografts have prompted the increasing use of newer bone graft substitute implants, which are often composed of a co-polymer with calcium sulfate. The signal characteristics of these agents are distinctly different from those of autologous tissue (Fig. 7.32), and since they are not representative of native or cadaveric bone, they may be mistaken for delayed biologic incorporation on MR studies. In the absence of back-fill using synthetic plugs, the donor site typically fills in with autologous bone from the periphery and the surface material is typically hyperintense to native cartilage (see Fig. 7.27).
Autologous Chondrocyte Implantation
Tissue engineered cartilage involves three key elements:
  • A matrix scaffold
  • Cells
  • Signaling molecules, including growth factors or genes105
FIGURE 7.32 ● Coronal fast spin-echo MR image of the knee in a 61-year-old patient obtained 3 months following placement of a synthetic scaffold bone graft substitute. Note the intermediate signal intensity characteristics of the synthetic plug.

P.1127


Although the composition of the matrix in tissue-engineered cartilage is variable, requirements include:
  • Porosity for cell migration
  • Biodegradability for physiologic remodeling
  • Bonding to allow for peripheral integration
  • Biocompatibility with the surrounding environment105
Matrices of varying chemical composition have been used, including carbohydrate-based polymers such as polylactic acid and protein-based polymers, including fibrin and collagen. Additional components of tissue-engineered cartilage may include chondroprogenitor cell pools, such as those found in the cambial layer of periosteum and perichondrium, mesenchymal stem cells from the bone marrow or synovial membrane, or chondrocytes themselves.
An example of a tissue engineering type of technique is autologous chondrocyte implantation (ACI),121 a two-stage technique involving the arthroscopic harvest of autologous chondrocytes, cloning in tissue culture, and reimplantation at arthrotomy with a covering of autologous periosteum. Compared with microfracture, postoperative evaluation of ACI demonstrates consistently better fill. However, graft hypertrophy is not uncommon, accounting for some post-procedure morbidity.112 Hypertrophy of ACI grafts occurs most commonly in the first 6 months following transplantation (Fig. 7.33).112,122 In the initial few months following ACI, the repair cartilage is hyperintense relative to native cartilage, most likely due to its relatively immature matrix and increased mobility of water. This matrix can be discerned by the low-intensity periosteum (Fig. 7.34).112,117 Verstraete et al. described an evolution of signal intensity changes after ACI:
  • Hyperintense repair cartilage in the early period of 0 to 8 weeks
  • A transitional phase of 3 to 6 months with lower, more inhomogeneous signal intensity
  • A remodeling phase with the signal approaching that of the adjacent cartilage123
FIGURE 7.33 ● Coronal fast spin-echo MR images of the knee in a 15-year-old boy obtained following ACI for osteochondritis dissecans of the medial femoral condyle. (A) At the 3-month follow-up, the repair cartilage is proud and hyperintense relative to native cartilage, consistent with graft hypertrophy (arrowheads). (Reprinted by permission of

Lippincott Williams & Wilkins, from Clin Orthop Rel Res. 2004;422:214-23.

) (B) At the 8-month follow-up, there is further focal increased signal intensity of the graft, now associated with subchondral bony overgrowth. (C) At 27 months of follow-up, a focal full-thickness defect with partial delamination is demonstrated.

The presence of persistent fluid signal intensity between the repair tissue and subchondral bone suggests impending delamination,124 which is most commonly encountered in the early postoperative period of 6 months following repair.112,124 Complete delamination of the ACI graft has also been described as a potential complication.112,124
dGEMRIC techniques have also been used to evaluate autologous cartilage implantation. Some researchers have noted that in grafts less than 12 months old, the relative glycosaminoglycan levels appeared to be lower than the comparative hyaline cartilage. In grafts imaged after 12 months, relative

P.1128


glycosaminoglycan levels were more comparable to the adjacent and remote hyaline cartilage.125

FIGURE 7.34 ● Coronal fast spin-echo MR images of the knee in a 31-year-old man obtained following ACI. (A) Six weeks following surgery the graft is hyperintense relative to the intact, hypointense overlying periosteal cover (arrow). (B) Twenty months following surgery there is incorporation of periosteum to what is now isointense reparative cartilage, such that periosteal cover is no longer distinct (arrow). (Reprinted by permission of

Lippincott Williams & Wilkins, from Clin Orthop Rel Res. 2004;422:214-23.

)

Peripheral integration in ACI can also be assessed and is potentially one of the most important factors in evaluating cartilage repair. The use of a fluid-sensitive pulse sequence is essential to differentiate the hypertrophic synovium from fluid intensity in fissures, and the use of high in-plane resolution is necessary to evaluate the integrity of the interface.117 Verstraete et al. noted that edge integration of transplanted cartilage can take up to 2 years and, when complete, is seen as a lack of fluid intensity between the native and repair cartilage.123
References
1. Mow VC, Proctor CS, Kelly MA. Biomechanics of articular cartilage. In: Nordin M, Frankel VH, eds. Basic biomechanics of tissues and structures of the musculoskeletal system. Philadelphia: Lea & Febiger; 1989:31-58.
2. Stockwell RS. Biology of cartilage cells. Cambridge: Cambridge University Press; 1979.
3. Muir H. The chemistry of the ground substance of joint cartilage. In: Sokoloff L, ed. The joints and synovial fluid. Vol. II. New York: Academic Press; 1980:27-94.
4. Muir H. Proteoglycans as organizers of the intercellular matrix. Biochem Soc Trans 1983;11:613-622.
5. Rosenberg L. Structure of cartilage proteoglycans. In: Burleigh PMC, Poole AR, eds. Dynamics of connective tissue macromolecules. Amsterdam: North-Holland Publishing, 1975:105-128.
6. Rosenberg L, Hellmann W, Kleinschmidt AK. Electron microscopic studies of proteoglycan aggregates from bovine articular cartilage. J Biol Chem 1975;250:1877-1883.
7. Wong M, Wuethrich P, Eggli P, Hunziker E. Zone-specific cell biosynthetic activity in mature bovine articular cartilage: a new method using confocal microscopic stereology and quantitative autoradiography. J Orthop Res 1996;14:424-432.
8. Askew MJ, Mow VC. The biomechanical function of the collagen ultrastructure of articular cartilage. J Biomech Eng 1978;100:105.
9. Bullough PG, Jagannath A. The morphology of the calcification front in articular cartilage. Its significance in joint function. J Bone Joint Surg [Br] 1983;65:72-78.
10. Bullough P, Goodfellow J. The significance of the fine structure of articular cartilage. J Bone Joint Surg [Br] 1968;50:852-857.
11. Blackburn WD Jr, Bernreuter WK, Rominger M, Loose LL. Arthroscopic evaluation of knee articular cartilage: a comparison with plain radiographs and magnetic resonance imaging. J Rheumatol 1994;21:675-679.
12. Link TM, Steinbach LS, Ghosh S, et al. Osteoarthritis: MR imaging findings in different stages of disease and correlation with clinical findings. Radiology 2003; 226:373-381.
13. Speer KP, Spritzer CE, Goldner JL, Garrett WE Jr. Magnetic resonance imaging of traumatic knee articular cartilage injuries. Am J Sports Med 1991;19:396-402.
14. Hayes CW, Sawyer RW, Conway WF. Patellar cartilage lesions: in vitro detection and staging with MR imaging and pathologic correlation. Radiology 1990;176:479-483.
15. Ochi M, Sumen Y, Kanda T, et al. The diagnostic value and limitation of magnetic resonance imaging on chondral lesions in the knee joint. Arthroscopy 1994;10:176-183.
16. Disler DG, McCauley TR, Wirth CR, Fuchs MD. Detection of knee hyaline cartilage defects using fat-suppressed three-dimensional spoiled gradient-echo MR imaging: comparison with standard MR imaging and correlation with arthroscopy. AJR Am J Roentgenol 1995;165:377-382.
17. Disler DG, McCauley TR, Kelman CG, et al. Fat-suppressed three-dimensional spoiled gradient-echo MR imaging of hyaline cartilage defects in the knee: comparison with standard MR imaging and arthroscopy. AJR Am J Roentgenol 1996;167:127-132.
18. Potter HG, Linklater JA, Allen AA, et al. Magnetic resonance imaging of articular cartilage in the knee: an evaluation with use of fast spin echo imaging. J Bone Joint Surg [Am] 1998;80:1276-1284.
19. Eckstein F, Schnier M, Haubner M, et al. Accuracy of cartilage volume and thickness measurements with magnetic resonance imaging. Clin Orthop Rel Res 1998;352:137-148.
20. Eckstein F, Westhoff J, Sittek H, et al. In vivo reproducibility of three-dimensional cartilage volume and thickness measurements with MR imaging. AJR Am J Roentgenol 1998;170:593-597.
21. Eckstein F, Glaser C. Measuring cartilage morphology with quantitative magnetic resonance imaging. Semin Musculoskelet Radiol 2004;8:329-353.
22. Eckstein F, Stammberger T, Priebsch J, et al. Effect of gradient and section orientation on quantitative analysis of knee joint cartilage. J Magn Reson Imaging 2000;11:161-167.

P.1129


23. Zhai G, Ding C, Cicuttini F, Jones G. Optimal sampling of MRI slices for the assessment of knee cartilage volume for cross-sectional and longitudinal studies. BMC Musculoskelet Disord 2005;6:10.
24. Eckstein F, Hudelmaier, Wirth W, et al. Double echo steady state (DESS) magnetic resonance imaging of knee articular cartilage at 3 Tesla: a pilot study for the Osteoarthritis Initiative. Ann Rheu Dis 2005:26 [Epub ahead of print].
25. Graichen H, von Eisenhart-Rothe R, Vogl T, et al. Quantitative assessment of cartilage status in osteoarthritis by quantitative magnetic resonance imaging: technical validation for use in analysis of cartilage volume and further morphologic parameters. Arthritis Rheum 2004;50:811-816.
26. Stammberger T, Eckstein F, Michaelis M, et al. Interobserver reproducibility of quantitative cartilage measurements: comparison of B-spline snakes and manual segmentation. Magn Reson Imaging 1999;17:1033-1042.
27. Koo S, Gold GE, Andriacchi TP. Considerations in measuring cartilage thickness using MRI: factors influencing reproducibility and accuracy. Osteoarthritis Cartilage 2005;13:782-789.
28. Lee KY, Masi JN, Sell CA, et al. Computer-aided quantification of focal cartilage lesions using MRI: accuracy and initial arthroscopic comparison. Osteoarthritis Cartilage 2005;13:728-737.
29. Cicuttini FM, Wluka AE, Forbes A, Wolfe R. Comparison of tibial cartilage volume and radiologic grade of the tibiofemoral joint. Arthritis Rheum 2003;48:682-688.
30. Cicuttini F, Hankin J, Jones G, Wluka A. Comparison of conventional standing knee radiographs and magnetic resonance imaging in assessing progression of tibiofemoral joint osteoarthritis. Osteoarthritis Cartilage 2005;13:722-727.
31. Herberhold C, Faber S, Stammberger T, et al. In situ measurement of articular cartilage deformation in intact femoropatellar joints under static loading. J Biomech 1999;32:1287-1295.
32. Waterton JC, Stolloway S, Foster JE, et al. Diurnal variation in the femoral articular cartilage of the knee in young adult humans. Magn Reson Med 2000;43:126-132.
33. Eckstein F, Tieschky M, Faber SC, et al. Effect of physical exercise on cartilage volume and thickness in vivo: MR imaging study. Radiology 1998;207:243-248.
34. Raynauld JP, Martel-Pelletier J, Berthiaume MJ, et al. Quantitative magnetic resonance imaging evaluation of knee osteoarthritis progression over two years and correlation with clinical symptoms and radiologic changes. Arthritis Rheum 2004;50:476-487.
35. Potter HG, Rodeo SA, Wickiewicz TL, Warren RF. MR imaging of meniscal allografts: correlation with clinical and arthroscopic outcomes. Radiology 1996;198:509-514.
36. Potter HG, Foo LF. Magnetic resonance imaging of articular cartilage: trauma, degeneration and repair. Am J Sports Med [in press].
37. Bredella MA, Tirman PF, Peterfy CG, et al. Accuracy of T2-weighted fast spin echo MR imaging with fat saturation in detecting cartilage defects in the knee: comparison with arthroscopy in 130 patients. AJR Am J Roentgenol 1999;172:1073-1080.
38. Kleemann RU, Krocker D, Cedraro A, et al. Altered cartilage mechanics and histology in knee osteoarthritis: relation to clinical assessment (ICRS Grade). Osteoarthritis Cartilage 2005;13:958-963.
39. Gold GE, Fuller SE, Hargreaves BA, et al. Driven equilibrium magnetic resonance imaging of articular cartilage: initial clinical experience. J Magn Reson Imaging 2005;21:476-481.
40. Hargreaves BA, Gold GE, Lang PK, et al. MR imaging of articular cartilage using driven equilibrium. Magn Reson Med 1999;42:695-703.
41. Ruehm S, Zanetti M, Romero J, Hodler J. MRI of patellar articular cartilage: evaluation of an optimized gradient-echo sequence (3D-DESS). J Magn Reson Imaging 1998;8:1246-1251.
42. Hargreaves BA, Gold GE, Beaulieu CF, et al. Comparison of new sequences for high-resolution cartilage imaging. Magn Reson Med 2003;49:700-709.
43. Vasanawala SS, Hargreaves BA, Pauly JM, et al. Rapid musculoskeletal MRI with phase-sensitive steady-state free precession: comparison with routine knee MRI. AJR Am J Roentgenol 2005;184:1450-1455.
44. Kornaat PR, Doornbos J, van der Molen AJ, et al. Magnetic resonance imaging of knee cartilage using a water selective balanced steady-state free precession sequence. J Magn Reson Imaging 2004;20:850-856.
45. Reeder SB, Pelc NJ, Alley MT, Gold GE. Rapid MR imaging of articular cartilage with steady-state free precession and multipoint fat-water separation. AJR Am J Roentgenol 2003;180:357-362.
46. Schmid MR, Pfirrmann CWA, Koch P, et al. Imaging of patellar cartilage with a 2D multiple-echo data image combination sequence. AJR Am J Roentgenol 2005;184:1744-1748.
47. Brossmann J, Frank LR, Pauly JM, et al. Short echo time projection reconstruction MR imaging of cartilage: comparison with fat-suppressed spoiled GRASS and magnetization transfer contrast MR imaging. Radiology 1997;203:501-507.
48. Gold GE, Thedens DR, Pauly JM, et al. MR imaging of articular cartilage of the knee: new methods using ultrashort TEs. AJR Am J Roentgenol 1998;170:1223-1226.
49. Vahlensieck M, Peterfy CG, Wischer T, et al. Indirect MR arthrography: optimization and clinical applications. Radiology 1996;200:249-254.
50. Woertler K, Strothmann M, Tombach B, Reimer P. Detection of articular cartilage lesions: experimental evaluation of low- and high-field-strength MR imaging at 0.18 and 1.0 T. J Magn Reson Imaging 2000;11:678-685.
51. Roemer FW, Guermazi A, Lynch JA, et al. Short tau inversion recovery and proton density-weighted fat suppressed sequences for the evaluation of osteoarthritis of the knee with a 1.0 T dedicated extremity MRI: development of a time-efficient sequence protocol. Eur Radiol 2005;15:978-987.
52. Kornaat PR, Reeder SB, Koo S, et al. MR imaging of articular cartilage at 1.5T and 3.0T: comparison of SPGR and SSFP sequences. Osteoarthritis Cartilage 2005;13:338-344.
53. Masi JN, Sell CA, Phan C, et al. Cartilage MR imaging at 3.0 versus that at 1.5 T: preliminary results in a porcine model. Radiology 2005;236:140-150.
54. Fischbach F, Bruhn H, Unterhauser F, et al. Magnetic resonance imaging of hyaline cartilage defects at 1.5T and 3.0T: comparison of medium T2-weighted fast spin echo, T1-weighted two-dimensional and three-dimensional gradient echo pulse sequences. Acta Radiol 2005;46:67-73.
55. Xia Y, Farquhar, Burton-Wurster N, Lust G. Origin of cartilage laminae in MRI. J Magn Reson Imaging 1997;7:887-894.
56. Rubenstein JD, Kim JK, Morova-Protzner I, et al. Effects of collagen orientation on MR imaging characteristics of bovine articular cartilage. Radiology 1993;188:219-226.
57. Erickson SJ, Waldschmidt JG, Czervionke LF, Prost RW. Hyaline cartilage: truncation artifact as a cause of trilaminar appearance with fat-suppressed three-dimensional spoiled gradient-recalled sequences. Radiology 1996;201:260-264.
58. Rubenstein JD, Li JG, Majumdar S, Henkelman RM. Image resolution and signal-to-noise ratio requirements for MR imaging of degenerative cartilage. AJR Am J Roentgenol 1997;169:1089-1096.
59. Lesperance LM, Gray ML, Burstein D. Determination of fixed charge density in cartilage using nuclear magnetic resonance. J Orthop Res 1992;10:1-13.
60. Shapiro EM, Borthakur A, Gougoutas A, Reddy R. 23Na MRI accurately measures fixed charge density in articular cartilage. Magn Reson Med 2002;47:284-291.
61. Reddy R, Insko EK, Noyszewski EA, et al. Sodium MRI of human articular cartilage in vivo. Magn Reson Med 1998;39:697-701.
62. Borthakur A, Shapiro EM, Beers J, et al. Sensitivity of MRI to proteoglycan depletion in cartilage: comparison of sodium and proton MRI. Osteoarthritis Cartilage 2000;8:288-293.
63. Wheaton AJ, Borthakur A, Shapiro EM, et al. Proteoglycan loss in human knee cartilage: quantitation with sodium MR imaging-feasibility study. Radiology 2004;231:900-905.
64. Gold GE, Beaulieu CF. Future of MR imaging of articular cartilage. Semin Musculoskelet Radiol 2001;5:313-327.
65. Borthakur A, Shapiro EM, Akella SVS, et al. Quantifying sodium in the human wrist in vivo by using MR imaging. Radiology 2002;224:598-602.
66. Regatte RR, Akella SVS, Wheaton AJ, et al. T1ρ relaxation mapping of human femoral-tibial cartilage in vivo. J Magn Reson Imaging 2003;18:336-341.
67. Engelhardt RT, Johnson GA. T1ρ relaxation and its application to MR histology. Magn Reson Med 1996;35:781-786.
68. Wheaton AJ, Casey FL, Gougoutas AJ, et al. Correlation of T1ρ with fixed charge density in cartilage. J Magn Reson Imaging 2004;20:519-525.
69. Wheaton AJ, Dodge GR, Borthakur A, et al. Detection of changes in articular cartilage proteoglycan by T1ρ magnetic resonance imaging. J Orthop Res 2005;23:102-108.
70. Duvvuri U, Charagundla SR, Kudchodkar SB, et al. Human knee: in vivo T1ρ-weighted MR imaging at 1.5T: preliminary experience. Radiology 2001;220:822-826.
71. Regatte RR, Akella SVS, Wheaton AJ, et al. 3D-T1ρ-relaxation mapping of articular cartilage: in vivo assessment of early degenerative changes in symptomatic osteoarthritic subjects. Acad Radiol 2004;11:741-749.
72. Bashir A, Gray ML, Burstein D. Gd-DTPA2- as a measure of cartilage degradation. Magn Reson Med 1996;36:665-673.
73. Bashir A, Gray ML, Boutin RD, Burstein D. Glycosaminoglycan in articular cartilage: in vivo assessment with delayed Gd(DTPA)2—enhanced MR imaging. Radiology 1997;205:551-558.
74. Williams A, Gillis A, McKenzie C, et al. Glycosaminoglycan distribution in cartilage as determined by delayed gadolinium-enhanced MRI of cartilage (dGEMRIC): potential clinical applications. AJR Am J Roentgenol 2004;182:167-172.
75. Tiderius CJ, Tjornstrand J, Akeson P, et al. Delayed gadolinium-enhanced MRI of cartilage (dGEMRIC): intra- and interobserver variability in standardized drawing of regions of interest. Acta Radiol 2004;45:628-634.
76. Kim YJ, Jaramillo D, Millis MB, et al. Assessment of early osteoarthritis in hip dysplasia with delayed gadolinium-enhanced magnetic resonance imaging of cartilage. J Bone Joint Surg [Am] 2003;85:1987-1992.
77. Nieminen MT, Rieppo J, Toyras J, et al. T2 relaxation reveals spatial collagen architecture in articular cartilage: a comparative quantitative MRI and polarized light microscopic study. Magn Reson Med 2001;46:487-493.
78. Xia Y, Moody JB, Burton-Wurster N, Lust G. Quantitative in situ correlation between microscopic MRI and polarized light microscopy studies of articular cartilage. Osteoarthritis Cartilage 2001;9:393-406.
79. Mlynarik V, Trattnig S, Huber M, et al. The role of relaxation times in monitoring proteoglycan depletion in articular cartilage. J Magn Reson Imaging 1999;10:497-502.
80. Xia Y. Relaxation anisotropy in cartilage by NMR microscopy (μMRI) at 14-μm resolution. Magn Reson Med 1998;39:941-949.
81. Mosher TJ, Smith H, Dardzinski BJ, et al. MR imaging and T2 mapping of femoral cartilage: in vivo determination of the magic angle effect. AJR Am J Roentgenol 2001;177:665-669.
82. Rubenstein JD, Kim JK, Henkelman RM. Effects of compression and recovery on b ovine articular cartilage: appearances on MR images. Radiology 1996;201:843-850.
83. Goodwin DW, Wadghiri YZ, Dunn JF. Micro-imaging of articular cartilage: T2, proton density, and the magic angle effect. Acad Radiol 1998;5:790-798.
84. Goodwin DW, Wadghiri YZ, Zhu H, et al. Macroscopic structure of articular cartilage of the tibial plateau: influence of a characteristic matrix architecture on MRI appearance. AJR Am J Roentgenol 2004;182:311-318.
85. Maier CF, Tan SG, Hariharan H, et al. T2 quantitation of articular cartilage at 1.5T. J Magn Reson Imaging 2003;17:358-364.
86. Mendlik T, Faber SC, Weber J, et al. T2 quantitation of human articular cartilage in a clinical setting at 1.5T: implementation and testing of four multiecho pulse sequence designs for validity. Invest Radiol 2004; 39:288-299.

P.1130


87. Maroudas A, Venn M. Chemical composition and swelling of normal and osteoarthrotic femoral head cartilage. II. Swelling. Ann Rheum Dis 1977;36:399-406.
88. Maroudas AI. Balance between swelling pressure and collagen tension in normal and degenerate cartilage. Nature 1976;260:808-809.
89. David-Vaudey E, Ghosh S, Ries M, et al. T2 relaxation time measurements in osteoarthritis. Magn Reson Imaging 2004;22:673-682.
90. Alhadlaq HA, Xia Y, Moody JB, et al. Detecting structural changes in early experimental osteoarthritis of tibial cartilage by microscopic magnetic resonance imaging and polarised light microscopy. Ann Rheum Dis 2004;63:709-717.
91. Lammentausta E, Kiviranta P, Nissi MJ, et al. T2 relaxation time and delayed gadolinium-enhanced MRI of cartilage (dGEMRIC) of human patellar cartilage at 1.5T and 9.4T: relationships with tissue mechanical properties. J Orthop Res [in press].
92. Kelly BT, Potter HG, Deng X, et al. Meniscal allograft transplantation in the sheep knee: evaluation of chondroprotective effects. [submitted]
93. Dunn TC, Lu Y, Jin H, et al. T2 relaxation time of cartilage at MR imaging: comparison with severity of knee osteoarthritis. Radiology 2004;232:592-598.
94. Mosher TJ, Dardzinski BJ, Smith MB. Human articular cartilage: influence of aging and early symptomatic degeneration on the spatial variation of T2– preliminary findings at 3T. Radiology 2000;214:259-266.
95. Johnson DL, Urban WP Jr, Caborn DN, et al. Articular cartilage changes seen with magnetic resonance imaging-detected bone bruises associated with acute anterior cruciate ligament rupture. Am J Sports Med 1998;26:409-414.
96. Spindler KP, Schils JP, Bergfeld JA, et al. Prospective study of osseous, articular, and meniscal lesions in recent anterior cruciate ligament tears by magnetic resonance imaging and arthroscopy. Am J Sports Med 1993;21:551-557.
97. Shelbourne KD, Jari S, Gray T. Outcome of untreated traumatic articular cartilage defects of the knee. J Bone Joint Surg [Am] 2003;85:S8-S16.
98. Faber KJ, Dill JR, Amendola A, et al. Occult osteochondral lesions after anterior cruciate ligament rupture. Six-year magnetic resonance imaging follow-up study. Am J Sports Med 1999;27:489-494.
99. Tiderius CJ, Olsson LE, Nyquist F, Dahlberg L. Cartilage glycosaminoglycan loss in the acute phase after an anterior cruciate ligament injury: delayed gadolinium-enhanced magnetic resonance imaging of cartilage and synovial fluid analysis. Arthritis Rheum 2005;52:120-127.
100. Yamamoto T, Bullough PG. Spontaneous osteonecrosis of the knee: the result of subchondral insufficiency fracture. J Bone Joint Surg [Am] 2000;82:858-866.
101. Zanetti M, Bruder E, Romero J, Hodler J. Bone marrow edema pattern in osteoarthritic knees: correlation between MR imaging and histologic findings. Radiology 2000;215:835-840.
102. Felson DT, McLaughlin S, Goggins J, et al. Bone marrow edema and its relation to progression of knee osteoarthritis. Ann Intern Med 2003;139:330-336.
103. Peterfy CG, Guermazi A, Zaim S, et al. Whole-Organ Magnetic Resonance Imaging Score (WORMS) of the knee in osteoarthritis. Osteoarthritis Cartilage 2004;12:177-190.
104. Abadie E, Ethgen D, Avouac B, et al. Recommendations for the use of new methods to assess the efficacy of disease-modifying drugs in the treatment of osteoarthritis. Osteoarthritis Cartilage 2004; 12:263-268.
105. Hunziker EB. Articular cartilage repair: basic science and clinical progress. A review of the current status and prospects. Osteoarthritis Cartilage 2002;10:432-463.
106. Steadman J, Rodkey W, Briggs K, Rodrigo J. The microfracture technic in the management of complete cartilage defects in the knee joint. Orthopade 1999;28:26-32.
107. Hangody L, Feczko P, Bartha L, et al. Mosaicplasty from the treatment of articular defects of the knee and ankle. Clin Orthop Relat Res 2001;391(Suppl):S328-336.
108. Gross AE, Agnidis Z, Hutchison CR. Osteochondral defects of the talus treated with fresh osteochondral allograft transplantation. Foot Ankle Int 2001;22:385-391.
109. Czitrom AA, Keating S, Gross AE. The viability of articular cartilage in fresh osteochondral allografts after clinical transplantation. J Bone Joint Surg [Am] 1990;72:574-581.
110. Knutsen G, Engbretsen L, Ludvigsen TC, et al. Autologous chondrocyte implantation compared with microfracture in the knee. A randomized trial. J Bone Joint Surg [Am] 2004;86:455-464.
111. Mithoefer K, Williams RJ 3rd, Warren RF, et al. The microfracture technique for the treatment of articular cartilage lesions in the knee. A prospective cohort study. J Bone Joint Surg [Am] 2005;87:1911-1920.
112. Brown WE, Potter HG, Marx RG, et al. Magnetic resonance imaging appearance of cartilage repair in the knee. Clin Orthop Relat Res 2004;422:214-223.
113. Alparslan L, Winalski CS, Boutin RD, et al. Postoperative magnetic resonance imaging of articular cartilage repair. Semin Musculoskelet Radiol 2001;5:345-363.
114. Rubak JM. Reconstruction of articular cartilage defects with free periosteal grafts. An experimental study. Acta Orthop Scand 1982;53:175-180.
115. Mainil-Varlet P, Aigner T, Brittberg M, et al. Histological assessment of cartilage repair: a report by the Histology Endpoint Committee of the International Cartilage Repair Society (ICRS). J Bone Joint Surg [Am] 2003;85(Suppl 2):45-57.
116. Glenn RE Jr, McCarthy EC, Potter HG, et al. Comparison of fresh osteochondral autografts and allografts: a canine model. Am J Sport Med [in press].
117. Potter HG. Foo LF, Pearle AD. MRI of cartilage repair. In: Williams RJ, ed. Cartilage repair: analysis and strategies. Humana Press [in press].
118. Koh JL, Wirsing K, Lautenschlager E, Zhang LO. The effect of graft height mismatch on contact pressure following osteochondral grafting: a biomechanical study. Am J Sports Med 2004;32:317-320.
119. Pearce SG, Hurtig MB, Clarnette R, et al. An investigation of 2 techniques for optimizing joint surface congruency using multiple cylindrical autografts. Arthroscopy 2001;17:50-55.
120. Sirlin CB, Brossmann J, Boutin RD, et al. Shell osteochondral allografts of the knee: comparison of MR imaging findings and immunologic responses. Radiology 2001;219:35-43.
121. Brittberg M, Lindahl A, Nilsson A, et al. Treatment of deep cartilage defects in the knee with autologous chondrocyte transplantation. N Eng J Med 1994;331:889-895.
122. Tins BJ, McCall IW, Takahashi T, et al. Autologous chondrocyte implantation in knee joint: MR imaging and histologic features at 1-year follow up. Radiology 2005;234:501-508.
123. Verstaete KL, Almqvist F, Verdonk P, et al. Magnetic resonance imaging of cartilage and cartilage repair. Clin Radiol 2004;59:674-689.
124. Alparslan L, Minas T, Winalski CS. Magnetic resonance imaging of autologous chondrocyte implantation. Semin Ultrasound CT MR 2001;22:341-351.
125. Gillis A, Bashir A, McKeon B, et al. Magnetic resonance imaging of relative glycosaminoglycan distribution in patients with autologous chondrocyte transplants. Invest Radiol 2001;36:734-748.


This website uses cookies to improve your experience. We'll assume you're ok with this, but you can opt-out if you wish. Accept Read More