Marrow Imaging
-
Conventional radiographic techniques are insensitive to many marrow infiltrations and tumors and are limited in providing accurate bone marrow characterization. As a result, there is frequently significant trabecular or cancellous destruction before disease progression is detected on standard radiographs.
-
Computed tomography (CT), although accurate for detecting gross metastatic disease of the spine, has limited sensitivity in imaging primary and metastatic marrow neoplasms. Changes in the CT attenuation value of medullary bone can be nonspecific and do not occur until pathology is well established.
-
Radionuclide bone scanning, the standard method for screening the skeleton for metastatic disease, is relatively insensitive to certain marrow neoplasms, such as leukemia, lymphoma, and myeloma. In addition, very aggressive metastatic tumors may yield false-negative findings on radionuclide scans.
-
Positron emission tomography (PET) using 2-F18-fluoro-2-deoxy-D-glucose (FDG) has a high sensitivity for the identification of early bone marrow infiltration by malignant neoplasms.1,2
-
Magnetic resonance (MR) imaging has the major benefit of imaging bone marrow directly. Multiplanar MR imaging provides the excellent spatial and contrast resolution necessary to differentiate the signal intensities of fatty (yellow) marrow elements from hematopoietic (red) marrow elements. MR imaging has thus become the diagnostic gold standard for diseases that involve or target the bone marrow.
-
Be aware of normal variations of red marrow patterns and recognize them as normal.
-
Distribution of red marrow can vary from person to person but is usually symmetric in the same person.
-
Subchondral red marrow can be seen in the proximal epiphyses of the humerus and femur.
-
T1-weighted and STIR sequences are most useful in detecting marrow infiltrative processes.
-
Normal red marrow signal is equal to or higher than muscle or disk on T1-weighted images.
-
Abnormal marrow signal is equal to or lower than muscle or disk on T1-weighted images.
-
Consider whole-body MR imaging for metastatic or myeloma survey and for staging of malignant neoplasms and lymphoma.
-
Red (hematopoietic) marrow is hematopoietically active bone marrow located within the spaces defined by the trabeculae. It is semifluid in consistency and is composed of the various hematopoietic stem cells and their progeny in assorted stages of granulocytic, erythrocytic, and megakaryocytic development. Uncommitted lymphocytes, as well as lymphoid nodules, are also present in the red marrow. The hematopoietic cellular elements are supported by reticulum cells and fat cells. Red marrow contains approximately 40% water, 40% fat, and 20% protein.6 The vascular system consists of centrally located nutrient arteries that send out branches that terminate in capillary beds within the bone. Postcapillary venules re-enter the marrow cavity and coalesce to form venous sinuses. Hematopoietic cell production follows the vascular arrangement, forming active hematopoietic islands between the sinusoids. Bone marrow lacks lymphatic channels.10,11
-
Hematopoietically inactive marrow, or marrow not involved in blood cell production, is referred to as yellow marrow. Because yellow marrow is predominantly composed of fat, it is sometimes called fatty marrow. It contains approximately 15% water, 80% fat, and 5% protein.
in the appendicular and axial (i.e., spinal) skeletons. The prevalence of fatty marrow within the spine increases with advancing age. In osteoporosis, fat replacement is associated with loss of cancellous (i.e., trabecular) bone. Early in the normal ossification process, yellow marrow replaces the hyaline cartilage template in the epiphysis and apophysis.
 |
|
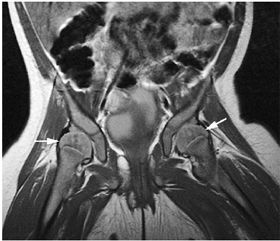
FIGURE 13.1 ● Normal red marrow in an infant. Coronal T1-weighted image demonstrates normal red marrow involving the entire skeleton, including the epiphyses (arrows).
|
 |
|
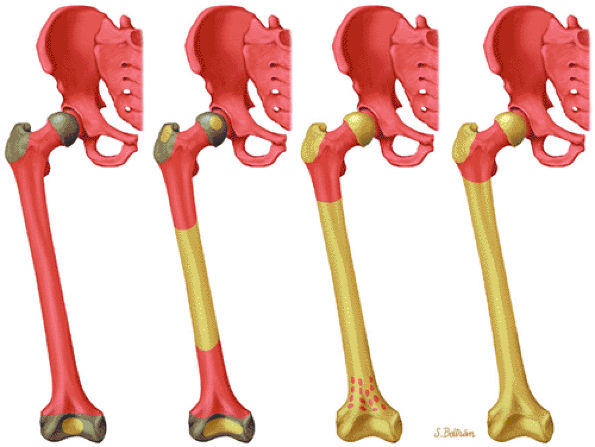
FIGURE 13.2 ● Bone marrow conversion from birth to adulthood. Graphic illustration demonstrating marrow distribution as a function of age with conversion of red marrow to yellow marrow.
|
 |
|
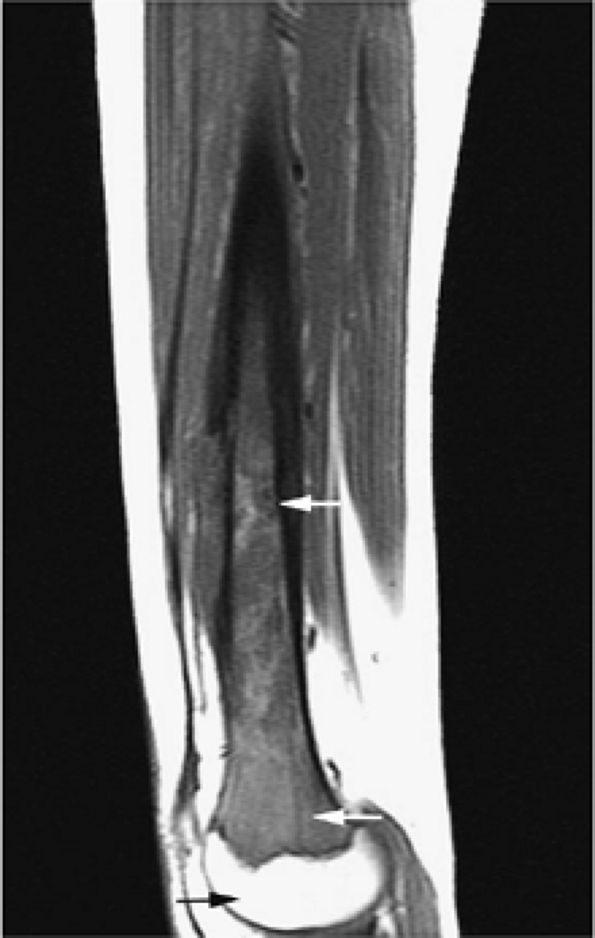
FIGURE 13.3 ● Reconversion of yellow marrow to red marrow in a patient receiving chemotherapy for Ewing sarcoma. This sagittal T1-weighted image demonstrates red marrow involving the metaphysis and diaphysis (white arrows), whereas yellow marrow remains present in the epiphysis (black arrow).
|
-
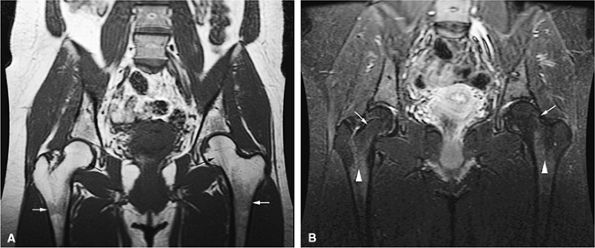
On T1-weighted and conventional T2-weighted images, yellow marrow demonstrates the bright signal intensity of fat.
-
Yellow marrow is low signal intensity on short inversion time recovery (STIR) images, in which signal from fat is nulled (Fig. 13.4). The signal intensity of fat marrow is also reduced on fat-suppressed T2-weighted spin-echo or fat-suppressed T2-weighted fast spin-echo sequences,17 and it appears darker when using fat-suppression techniques with sequences having longer repetition times (TR) and echo times (TE).
-
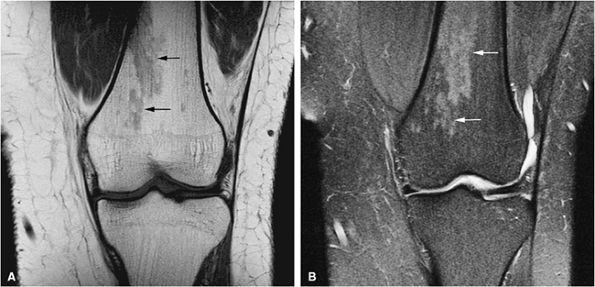
Red marrow demonstrates low signal intensity on T1-weighted images, reflecting its increased water content, and intermediate signal intensity with progressive T2 weighting.
-
Normal red marrow demonstrates T1 signal that is equal to or higher than adjacent muscle or intervertebral disks.
-
Red and yellow marrow contrast differences become less distinct on heavily T2-weighted protocols with TR greater than 2,500 msec.
-
With suppression of the signal from fat on STIR images, areas of red marrow demonstrate higher signal intensity than areas of yellow marrow.
addition, the sacral lateral masses demonstrate brighter signal intensity in male than in female subjects.
 |
|
FIGURE 13.4 ● (A) Coronal T1-weighted image shows normal yellow marrow of the proximal femurs (black arrows). Residual red marrow in the femoral metaphyses is of intermediate signal (white arrows). (B) Yellow marrow is dark on the corresponding coronal STIR image (arrows). Areas of red marrow demonstrate higher signal intensity than areas of yellow marrow (arrowheads).
|
 |
|
FIGURE 13.5 ● (A) Residual metaphyseal red marrow is seen as patchy regions of low signal intensity (black arrows) on a T1-weighted coronal image. (B) The red marrow is hyperintense on the corresponding fat-suppressed T2-weighted fast spin-echo image (white arrows).
|
 |
|
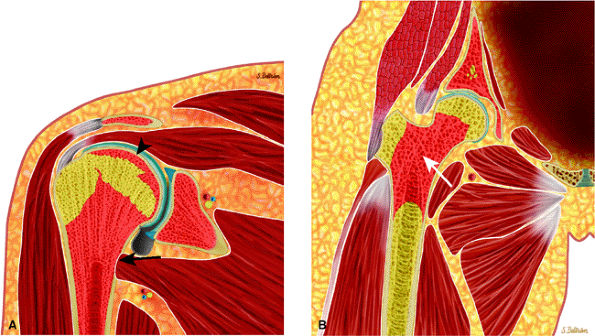
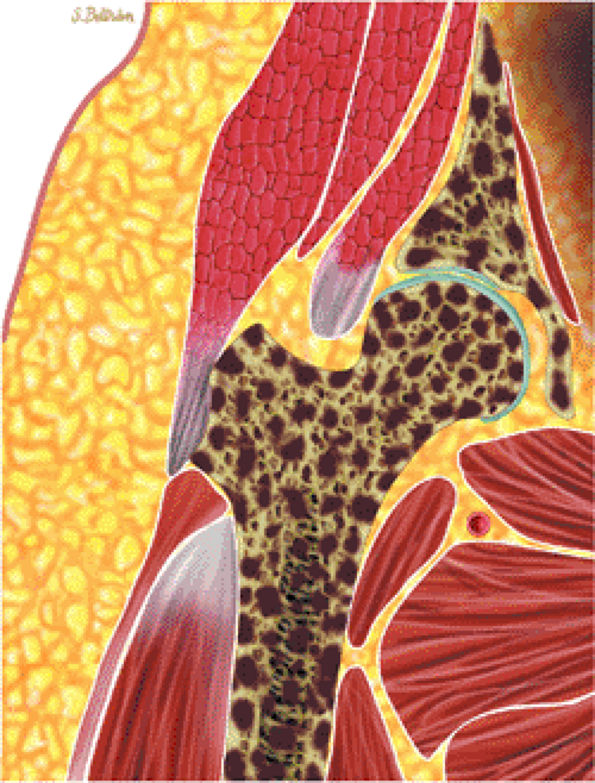
FIGURE 13.6 ● Normal red marrow. Coronal graphic illustrations of the shoulder (A) and hip (B) demonstrate the normal appearance of residual red marrow in the humeral (black arrow) and femoral (white arrow) metaphyses. Note the curvilinear distribution of red marrow involving the medial humeral head (black arrowhead), a normal finding.
|
 |
|
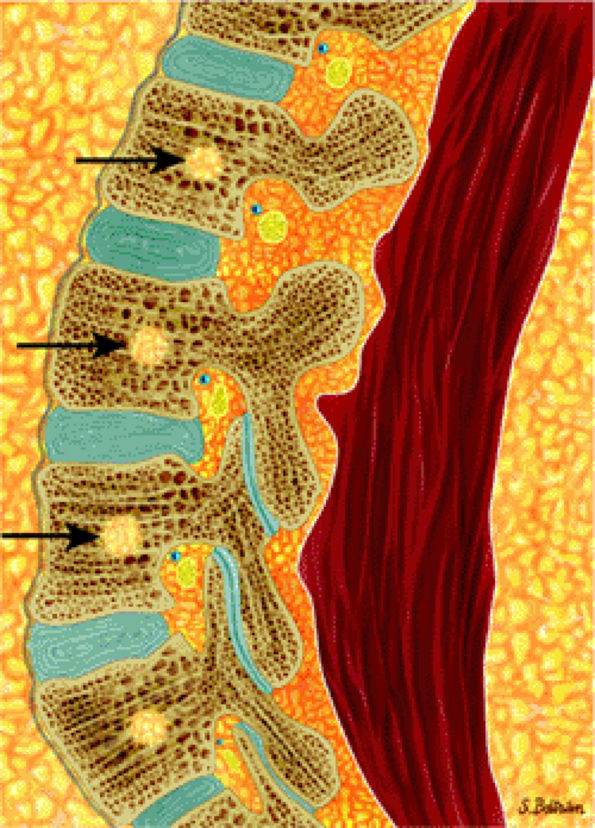
FIGURE 13.7 ● Sagittal graphic illustration of the lumbar spine shows normal marrow heterogeneity with foci of fatty marrow in the vertebral bodies (arrows).
|
detected; it has therefore proven to be highly sensitive for diseases within the medullary space of bone. The following STIR characteristics give rise to the clinical advantages:
-
Additive T1 and T2 contrast
-
Marked suppression of the high signal from fat
-
Twice the magnetization range of spin-echo sequences
-
Fat is black.
-
Combinations of red and yellow marrow are light gray (i.e., intermediate).
-
Most marrow tumors are bright white.
-
Although red marrow demonstrates increased signal intensity on STIR images, most pathologic conditions involving marrow replacement or infiltration generate greater signal intensities. Fibrous tissue, calcification, and hemosiderin deposits are low in signal intensity, whereas fluid, edema, or recent hemorrhage are bright. Muscle remains intermediate in signal intensity.
-
STIR sequences reflect the age-dependent differences in the percentage of hematopoietic marrow.
-
The initial excitation pulse is an RF pulse that typically possesses a flip angle of less than 90°. If a 90° flip angle is used, the Z component of the bulk magnetization vector is zero after the excitation pulse, and a period of time on the order of T1 is needed for the Z component of the bulk magnetization vector to recover and to allow a second pulse sequence to generate significant signal. If the excitation pulse is less than 90°, however, the Z component of the bulk magnetization vector is not decreased to zero, and the subsequent excitation pulse can be separated from the first by a TR significantly less than T1. In addition, the resultant signal is maximized by using free induction decay for data acquisition instead of a standard SE, with its associated long TE and signal drop-off.
-
To balance phase shifts from the readout frequency gradient so that all phase shifts are only those specifically introduced by the phase and encoding gradients, the initial readout gradient is negative and cancels phase shifts introduced by the positive component of the frequency-encoded gradient during acquisition of the signal. A reversal occurs between the negative and positive gradient; thus, the term gradient reversal techniques is used.
-
By using partial flip angles, TR values can be markedly shortened. Because image acquisition time is directly proportional to the value of TR, marked time savings over SE techniques can be attained. However, because the contrast parameters sampled by the gradient-echo technique are predominantly T2*, the high contrast between soft tissues normally obtained by spin-echo techniques is not routinely seen on gradient-echo images. It is possible to select parameters to provide contrast somewhat similar to standard spin-echo imaging.
-
Effective T2 weighting
-
High resolution
-
Adequate signal-to-noise ratio without the need for interslice spacing
-
The low-signal-intensity contrast of gradient-echo images is not secondary to fat suppression, as with STIR images; therefore, many marrow neoplasms or infiltrative disease processes do not demonstrate increased signal intensity when compared with corresponding STIR images.
-
Red marrow stores do not demonstrate increased signal intensity on gradient-echo images and may be difficult to differentiate from fatty marrow.
-
A high proportion of trabecular bone in areas such as the epiphysis may further modify gradient-echo contrast (decreasing effective transverse relaxation times), resulting in decreased signal intensity in these areas.26
images. Differences in resonant frequencies of fat and water protons (3.5 ppm or 75–150 Hz) allow for temporal dephasing after RF pulse excitation. This property is used to develop water and fat images by emphasizing in-phase or out-of-phase tissue properties, thus suppressing fat or water signal.
-
Axial T1-weighted, fat-suppressed T2-weighted fast spin-echo or STIR images may be obtained at specific sites of suspected pathologic processes and are important in determining cross-sectional marrow involvement. T1-weighted images are particularly valuable in evaluating blastic processes, which are low in signal on STIR images.
-
Gadolinium-enhanced axial images may improve the visibility of lesions, especially in cases with soft-tissue or cord involvement.
-
Sagittal T1-weighted and STIR images are routinely acquired to evaluate suspected spinal malignancies.
 |
|
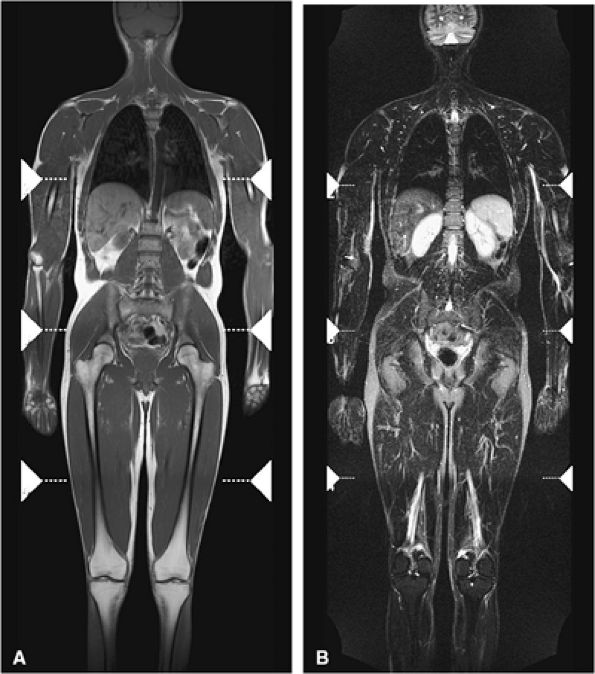
FIGURE 13.8 ● Whole-body MR imaging using coronal T1-weighted (A) and coronal STIR (B) sequences. Whole-body MRI is a sensitive and fast technique for evaluating the entire skeleton for abnormalities.
|
comparing whole-body MR imaging using a rolling table platform with bone scintigraphy, excellent correlation between the two modalities in lesion detection has been demonstrated, and the examination time was 40 minutes or less.35
-
Marrow involvement is usually diffuse in acute leukemia.
-
Relapse can present with patchy areas of marrow infiltration.
-
Abnormal marrow is darker than adjacent disk or muscle on T1-weighted images.
-
Be aware of post-therapy marrow changes (edema, fibrosis, fatty infiltration), which can simulate residual or metastatic disease.
-
Patients treated with G-CSF often develop reconversion from fatty to hematopoietic marrow.
 |
|
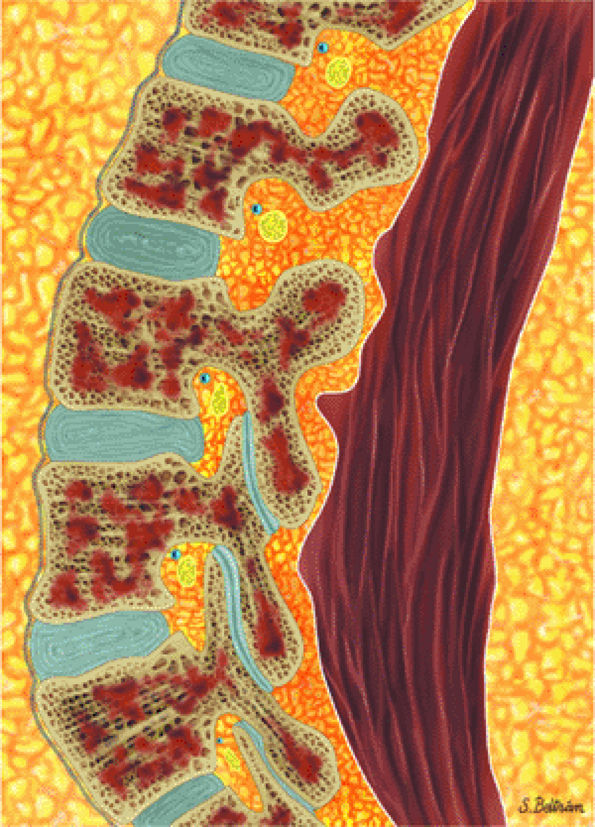
FIGURE 13.9 ● Sagittal graphic illustration shows diffuse leukemic bone marrow infiltration of the lumbar spine (shown in brown).
|
Focal infiltration is more commonly seen in myelogenous leukemia (Fig. 13.13). The following findings are typical:
 |
|
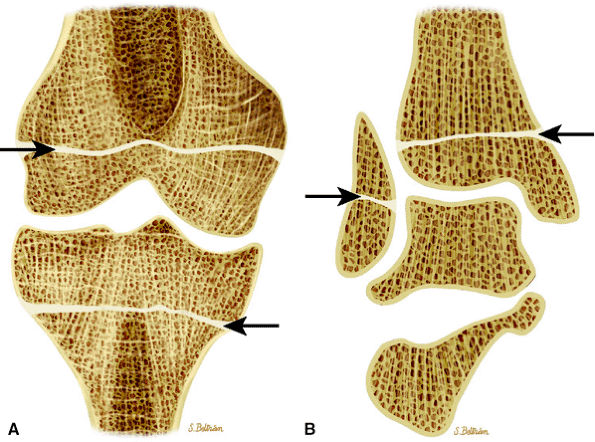
FIGURE 13.10 ● Coronal graphic illustrations of the knee (A) and ankle (B) show transverse lucent metaphyseal bands due to leukemic infiltration. “Leukemic lines” are seen in 40% to 53% of patients with acute lymphocytic leukemia.
|
-
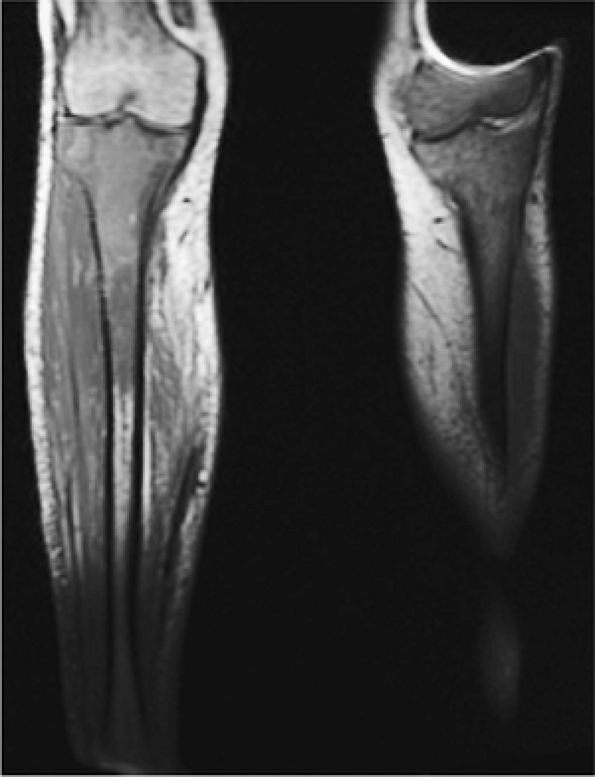
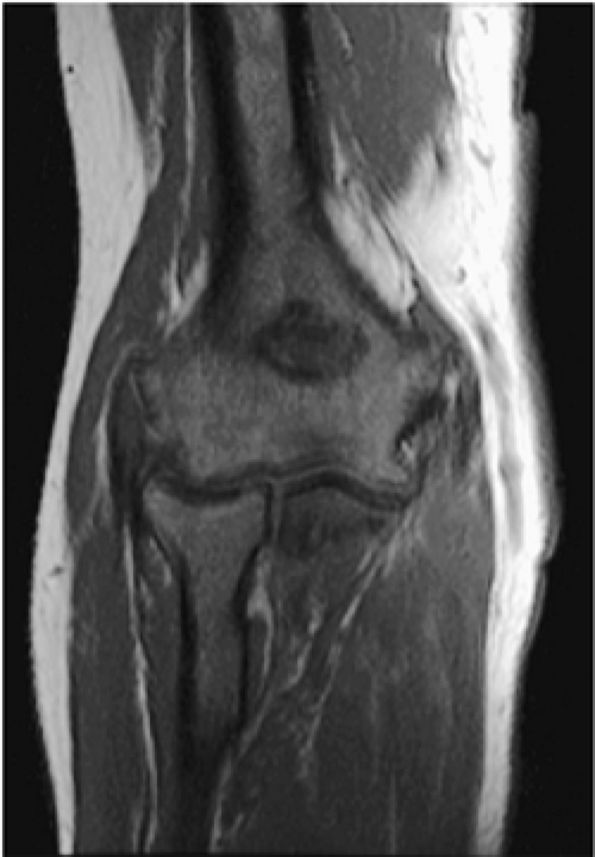
On T1-weighted images, leukemic hypercellularity is seen as low-signal-intensity replacement of higher-signal-intensity marrow fat (Fig. 13.14).
-
Due to the greater proportion of hematopoietic marrow in children, there is an overlap in the appearance of normal low-signal-intensity cellular hematopoietic marrow and low- to intermediate-intensity hypercellular leukemic marrow.
-
Quantitative measurements of T1 relaxation times have shown prolongation in patients with leukemia and
P.1987
leukemia in relapse.40,41,42,43 These assessments, however, are not specific for the diagnosis of leukemia. Prolongation of the T1 relaxation time is also seen in metastatic rhabdomyosarcoma or neuroblastoma. Normal bone marrow has a T1 relaxation time of 350 to 650 msec. At initial diagnosis of leukemia or in leukemia in relapse, T1 relaxation times of 750 msec have been identified. Further studies are needed to confirm the clinical significance of differences in T1 values among initial diagnosis, remission, and relapse.44 -
Conventional T2-weighted images may show increases in signal intensity in acute leukemia. Unlike the situation with metastatic disease, however, T2-weighted images may not be sensitive to leukemic hypercellularity.
-
Quantitative measurement of T2 relaxation times in leukemia has not shown any significant difference from control marrow.
-
Chemical-shift imaging has also been used to identify pathologic marrow. Relative changes in the fat fraction show the greatest potential for understanding changes in bone marrow signal intensity and changes occurring with relapse.41,45 Chemical-shift imaging may be more useful in adult patients because of the greater difference in the fat and water fraction of bone marrow.
-
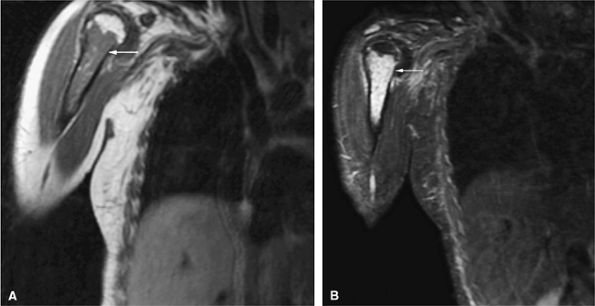
STIR techniques offer superior contrast for demonstrating increased signal intensity in leukemic marrow, exceeding that displayed by normal hematopoietic cells. Nulling of fat signal intensity facilitates the detection of both focal and diffuse leukemic infiltrates (Fig. 13.15).
 |
|
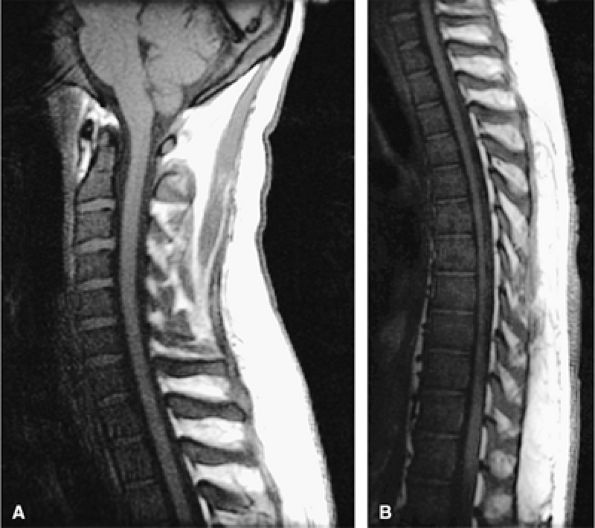
FIGURE 13.11 ● Diffuse low-signal-intensity leukemic infiltration of marrow occurs in acute lymphocytic leukemia, as seen on T1-weighted sagittal images of the cervical (A) and thoracolumbar (B) spine.
|
 |
|
FIGURE 13.12 ● Abnormal low-signal-intensity marrow of the bilateral lower extremities due to leukemic infiltration, seen on a coronal T1-weighted image. Note extension of leukemic infiltrates into the epiphyses.
|
 |
|
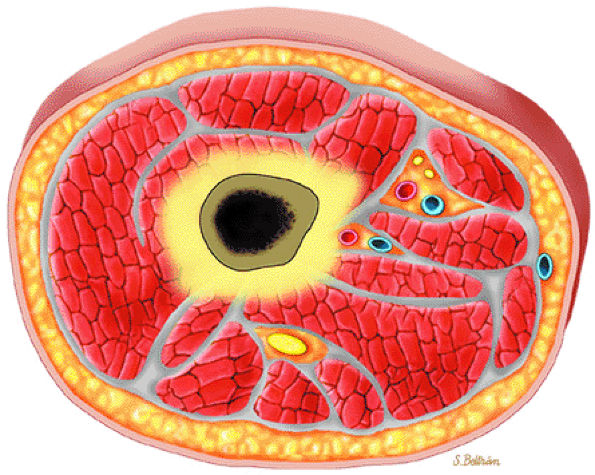
FIGURE 13.13 ● Axial graphic illustration demonstrates focal abnormal bone marrow of the femoral metaphysis with surrounding edema.
|
 |
|
FIGURE 13.14 ● Low-signal-intensity leukemic infiltrates extending into the epiphysis are seen on this T1-weighted coronal image of the elbow. Extension of marrow inhomogeneity crossing the physis is an abnormal finding that may be seen in acute myelogenous leukemia.
|
 |
|
FIGURE 13.15 ● In a patient with acute lymphocytic leukemia, marrow infiltration demonstrates low signal intensity on a coronal T1-weighted image of the upper arm (A). The marrow infiltration is of high signal intensity on the corresponding coronal STIR image (B) (arrows).
|
-
Marrow hypoplasia, characterized by the appearance of fatty marrow, demonstrates high signal intensity on T1-weighted images and intermediate signal intensity on T2-weighted images.
-
With chemical-shift imaging, it is possible to demonstrate sequential increases in bone marrow fat fractions in patients in clinical remission during chemotherapy treatment for acute leukemia.48
-
Marrow fibrosis demonstrates low signal intensity on T1- and T2-weighted images.
-
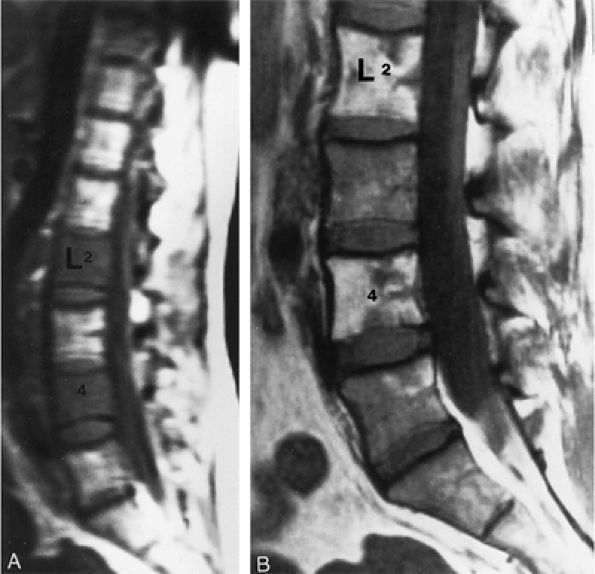
Reconversion of normal fatty marrow to hematopoietic marrow is seen as areas of decreased signal intensity on T1-weighted images and intermediate to mildly increased signal intensity on STIR images. When reconversion takes place adjacent to an area of signal intensity from fat in treated marrow, there is a reversal of the initial imaging signal intensity characteristics from pretreatment bone marrow to post-chemotherapy marrow (Fig. 13.16). Immediately after chemotherapy, marrow edema may falsely exaggerate the extent of disease progression. Follow-up examination can be performed to document a more accurate baseline.
 |
|
FIGURE 13.16 ● Marrow response to chemotherapy. T1-weighted images of the lumbar spine before chemotherapy (A) and after chemotherapy (B) for metastatic colon carcinoma. Metastatic disease demonstrates low signal intensity at L2 and L4 prior to chemotherapy. High-signal-intensity fatty replacement can be seen after chemotherapy. Adjacent uninvolved vertebral bodies also show a flip-flop in signal intensity as the red marrow is activated.
|
 |
|
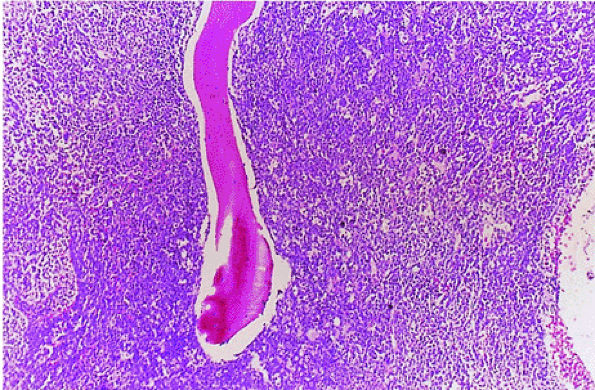
FIGURE 13.17 ● Chronic myelogenous leukemia. Hypercellular marrow consisting largely of myeloid precursors (H & E; original magnification × 100).
|
 |
|
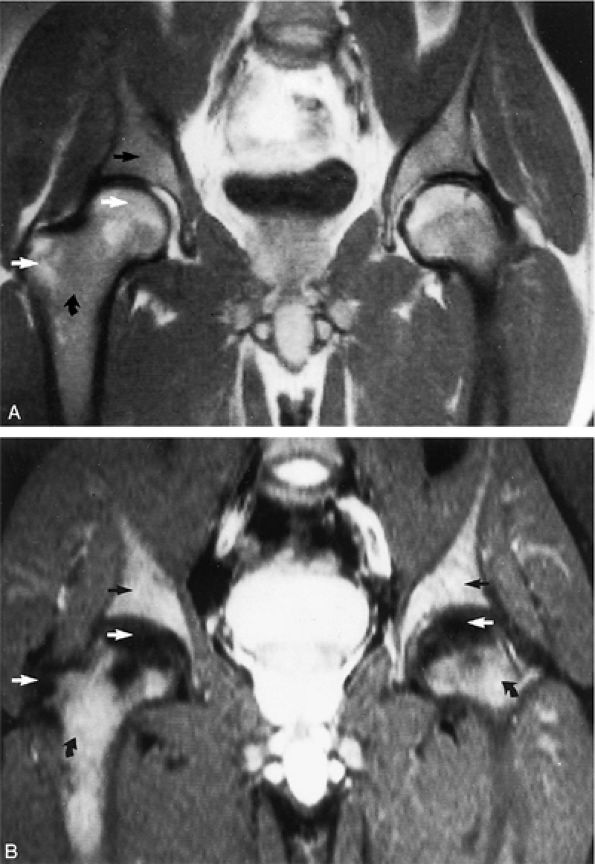
FIGURE 13.18 ● In chronic myelogenous leu-kemia, diffuse marrow involvement infiltrates regions of previous red marrow stores in the femurs (curved arrows) and acetabulum (straight black arrows) and demonstrates low signal intensity on a T1-weighted image (A) and high signal intensity on a corresponding STIR image (B). The sites where yellow marrow is spared (the greater trochanter and femoral epiphysis) demonstrate high signal intensity on the T1-weighted image and low signal intensity (from the nulled fat signal) on the STIR sequence (white arrows).
|
 |
|
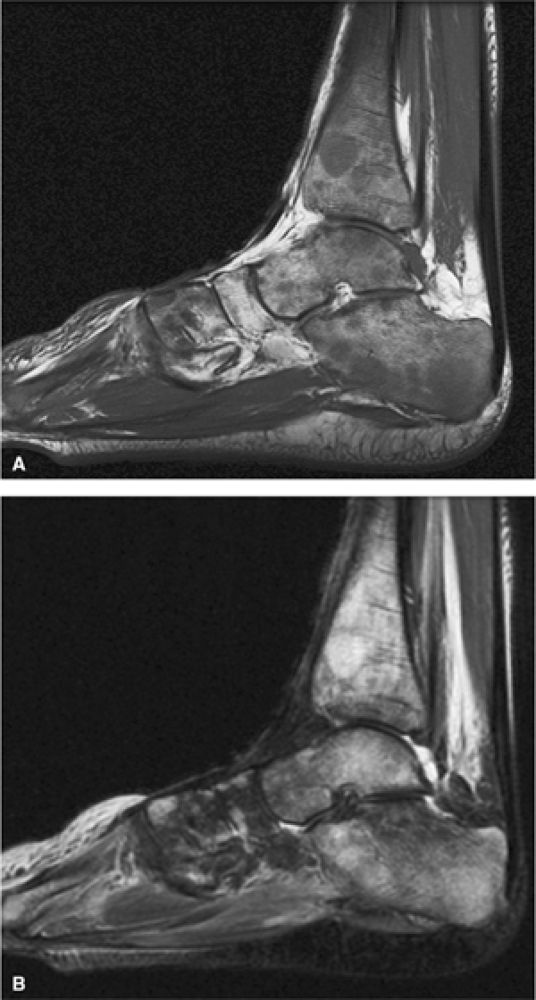
FIGURE 13.19 ● Diffuse marrow infiltration of the ankle in a patient with chronic myelogenous leukemia. Sagittal T1-weighted image (A) shows diffuse low-signal leukemic infiltration, which is bright on the corresponding sagittal STIR image (B).
|
-
In the acute phase of chronic leukemia, particularly in chronic myelogenous leukemia patients in blast crisis, there is almost complete replacement of both red and yellow marrow areas. The decreased signal on T1-weighted sequences represents replacement of marrow fat by tumor cells, which have a significantly longer T1 relaxation time. On STIR images, tumor cells appear as areas of white on a black or gray background (Fig. 13.19).
-
Severe anemias or other marrow-invasive processes may have a similar MR appearance. Multiple myeloma is more variable but is generally less symmetrical, more patchy, and irregular in distribution.55,56
-
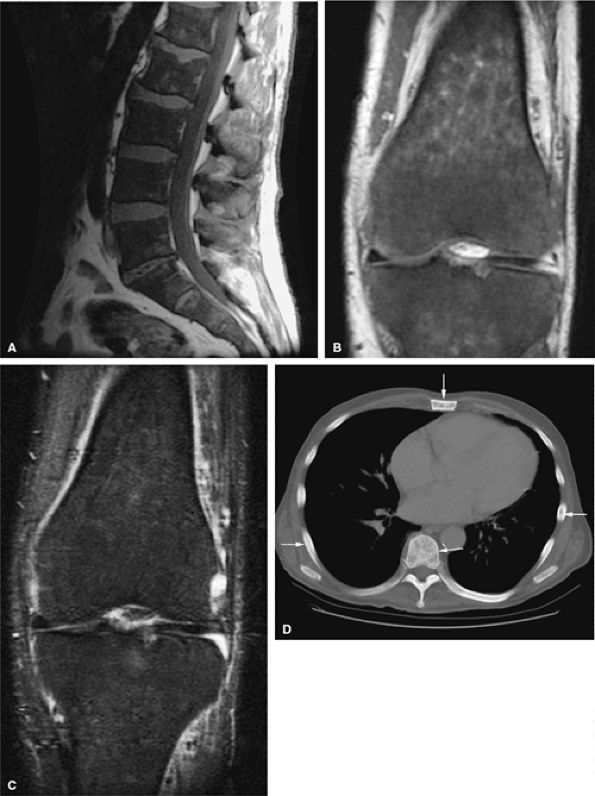
In primary myelofibrosis, T1-weighted images show patchy marrow involvement with low signal intensity on T1- and T2-weighted images (Fig. 13.20). With STIR techniques, the imaging characteristics of areas of involvement are identical to those of normal hematopoietic marrow (i.e., intermediate to mild increased signal intensity).57,58,59
 |
|
FIGURE 13.20 ● Extensive myelofibrosis following chemotherapy for leukemia. (A) The bone marrow exhibits diffuse marrow fibrosis, which is of low signal intensity on a sagittal T1-weighted image of the lumbar spine. Low-signal-intensity myelofibrotic marrow is seen on these coronal T1-weighted (B) and fat-suppressed T2-weighted (C) images of the knee. (D) Abnormal sclerosis of the spine, sternum, and ribs is seen on the axial CT image (arrows).
|
 |
|
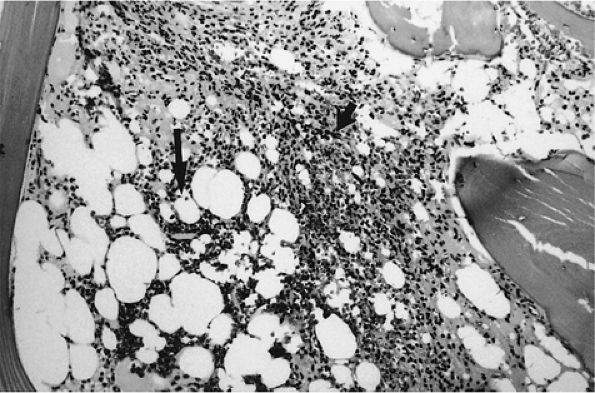
FIGURE 13.21 ● Bone marrow cellularity is low (i.e., 40:60 cell-to-fat ratio) in hairy cell leukemia. Mononuclear cells (short arrow) enveloped in reticulin form solid areas and infiltrate between the remaining fat cells (large arrow) (H & E; original magnification × 100).
|
 |
|
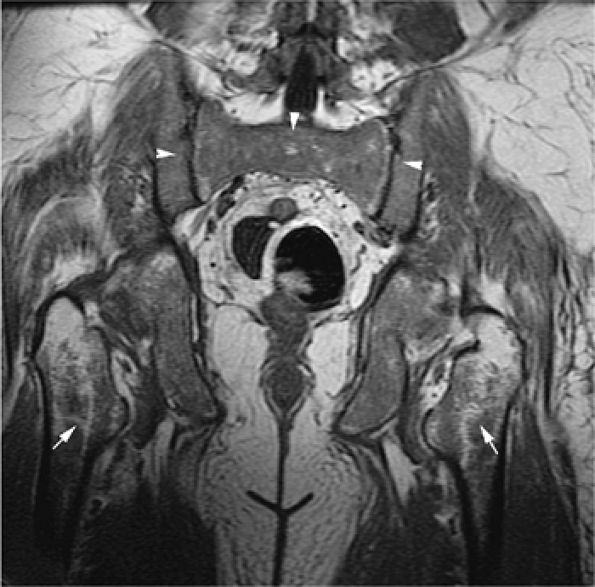
FIGURE 13.22 ● The patchy (arrows) and diffuse (arrowheads) pattern of leukemic marrow infiltration in hairy cell leukemia demonstrates low signal intensity on a coronal T1-weighted image of the pelvis.
|
 |
|
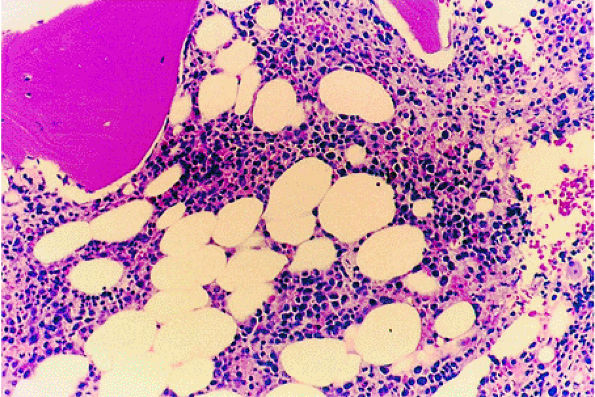
FIGURE 13.23 ● Idiopathic neutropenia after colony-stimulating factor therapy. Immature myeloid precursors can be seen in the interstitial space (H & E; original magnification × 400).
|
proximal femoral metaphysis and spine are common sites of marrow reconversion.33,67
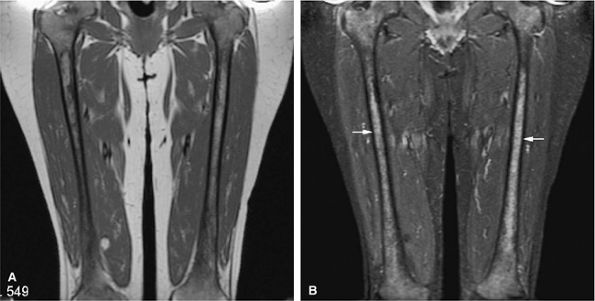 |
|
FIGURE 13.24 ● Abnormal bone marrow signal following administration of G-CSF. There is diffuse low signal on a coronal T1-weighted image of the thighs (A), which is hyperintense on the corresponding STIR image (B). G-CSF produces STIR hyperintensity, which can simulate diffuse marrow malignancies or leukemia (arrows). Bone marrow biopsy may be recommended in this situation.
|
-
Syngeneic (i.e., from an identical twin)
-
Allogeneic (i.e., from an HLA-matched donor)
-
Autologous (i.e., from the patient)
-
On T1-weighted images, there is a peripheral zone of intermediate signal intensity, representing repopulated hematopoietic cells, and a central zone of high-signal-intensity fatty marrow.
-
STIR images show a reciprocal change, with increased signal intensity in the peripheral zone of hematopoietic cells and decreased signal intensity in the central zone, because signal from fat is nulled. The alternating zones form a characteristic band pattern. Loss of this band may signify relapse, as a homogeneous area of decreased signal intensity replaces the vertebral body.
-
Repopulation of hematopoietic marrow follows vascular sinusoid pathways, which enter the periphery of the vertebral body, producing the peripheral region of intermediate signal intensity. These sinusoids drain into the basivertebral vein located in the central portion of the vertebral body. On STIR images used to evaluate repopulated marrow in the spine and pelvis after ablation therapy and bone marrow transplant, it is possible to differentiate red marrow from recurrent tumor (Fig. 13.25).
-
Hypoplastic fatty marrow may be seen prior to hematopoietic repopulation (Fig. 13.26).
-
Bone abnormalities related to total-body irradiation in long-term survivors of bone marrow transplantation for childhood leukemia have also been described.74 Skeletal abnormalities include osteochondroma, metaphyseal abnormalities (sclerosis and vertical striations), and slipped femoral capital epiphysis.
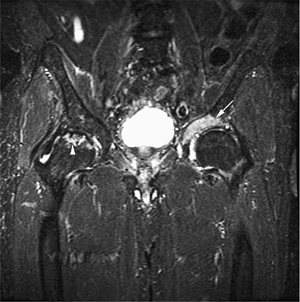 |
|
FIGURE 13.25 ● Recurrent tumor after bone marrow transplantation is seen on a coronal STIR image of the pelvis. Hyperintense recurrent tumor (arrow) is involving the acetabulum. Incidentally noted is avascular necrosis of the right femoral head (arrowhead).
|
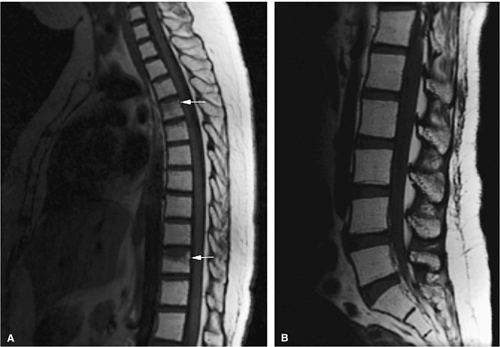 |
|
FIGURE 13.26 ● Bone marrow transplant for chronic leukemia. Hypoplastic fatty marrow demonstrates bright marrow signal intensity on sagittal T1-weighted images of the thoracic (A) and lumbar (B) spine. Compression deformities are noted in the thoracic spine (arrows).
|
-
Lymphoma presents focally rather than diffusely.
-
STIR imaging is useful in detecting marrow and mediastinal involvement.
-
Whole-body MR imaging and whole-body FDG-PET imaging are sensitive and accurate in the detection and staging of lymphoma.
-
Localization to a single group of lymph nodes (i.e., cervical, cervicoclavicular, mediastinal, or para-aortic)
-
Bimodal age distribution
-
Infrequent extranodal (e.g., bone marrow, CNS, gastrointestinal tract, or skin) involvement
-
Bone marrow invasion only when malignant cells enter the blood via a major lymphatic duct (an occurrence that portends a potentially fatal outcome)
-
Focal rather than generalized presentation in the marrow (Fig. 13.27)
-
An associated soft-tissue component (common) (Fig. 13.28)
-
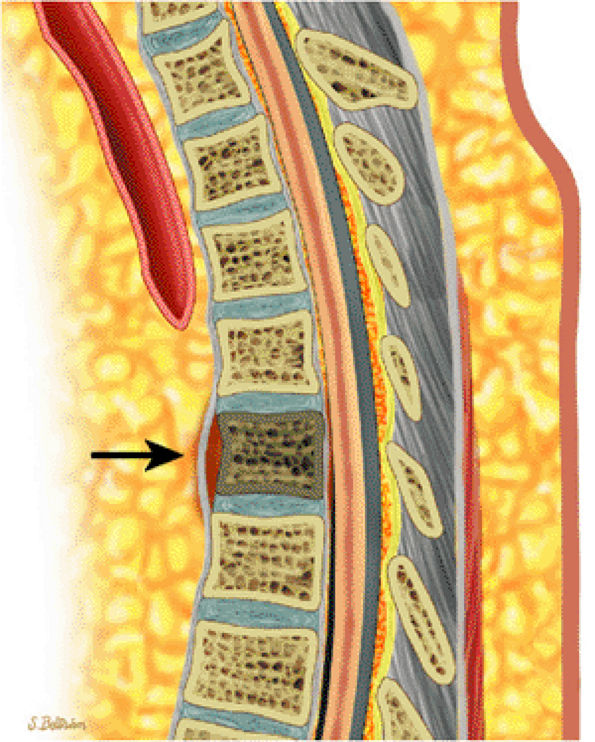
Spinal disease often presents with sclerosis of a vertebral body (“ivory vertebral body”) (Fig. 13.29).
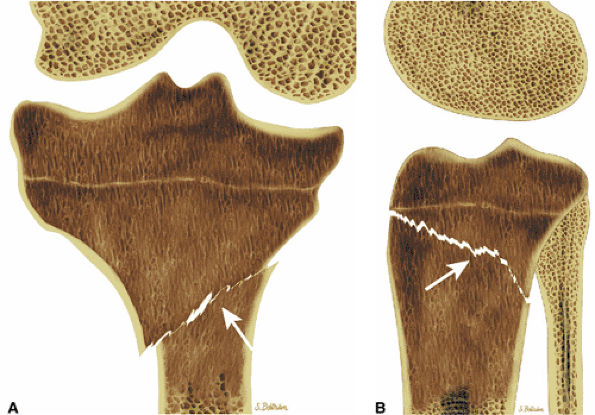 |
|
FIGURE 13.27 ● Hodgkin disease of the proximal tibia. Focal marrow infiltration from lymphoma is demonstrated on coronal (A) and sagittal (B) graphic illustrations. A pathologic fracture is present (arrows).
|
unifying histopathologic feature of Hodgkin disease is the presence of Reed-Sternberg cells, which are large cells with a bilobed nucleus exhibiting prominent nucleoli set in a polycellular background of inflammatory cells and often fibrosis. Although four distinct histologic subtypes of Hodgkin disease have been identified (lymphocyte predominant, nodular sclerosis, mixed cellularity, and lymphocyte depleted), the prognosis rests primarily in the clinical and pathologic stage of disease rather than its histologic subtype.78
 |
|
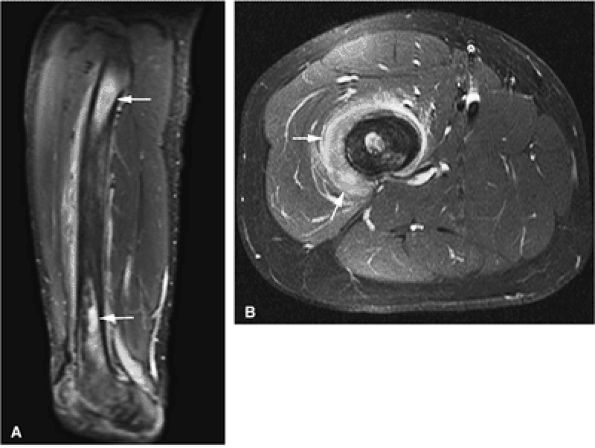
FIGURE 13.28 ● Patchy marrow infiltration of the femur in a patient with Hodgkin disease. (A) Abnormal marrow is hyperintense on a sagittal STIR image (arrows). (B) Surrounding edema and soft-tissue component is demonstrated on an axial fat-suppressed T2-weighted image (arrows).
|
 |
|
FIGURE 13.29 ● Spinal involvement in Hodgkin disease. Sagittal graphic illustration demonstrates sclerosis of a thoracic vertebral body (“ivory vertebral body”) with associated soft-tissue component (arrow).
|
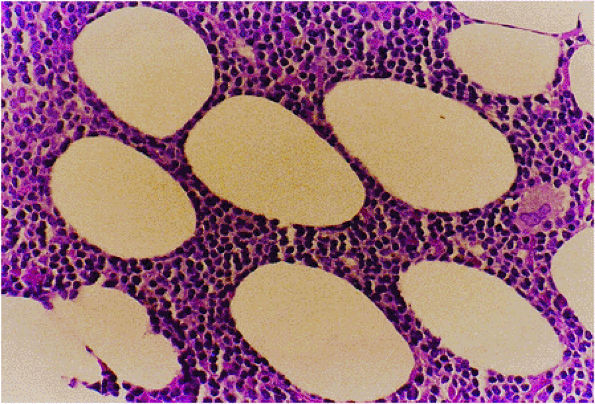
the small miliary nodules typical of low-grade lymphomas. Large cell lymphomas are rapidly fatal if not treated. However, with aggressive multiagent chemotherapy, complete remission can be achieved in 60% to 80% of patients. In contrast, low-grade lymphoma is relatively resistant to chemotherapy, although it exhibits an indolent clinical course.79
 |
|
FIGURE 13.30 ● Malignant lymphoma, predominantly small cleaved cell type. Small cleaved lymphocytes can be seen in the interstitium (H & E; original magnification × 400).
|
 |
|
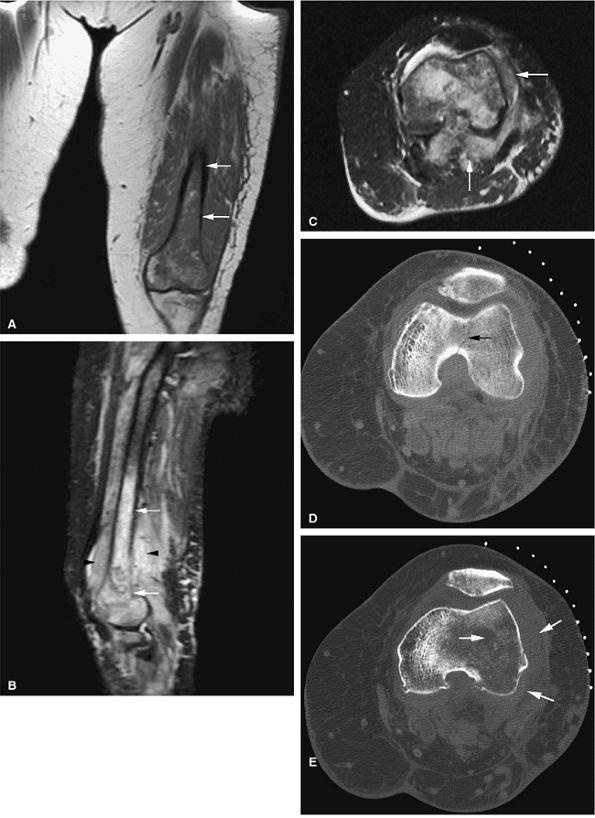
FIGURE 13.31 ● High-grade lymphoma of bone. (A) Marrow involvement of the distal femur is hypointense on a coronal T1-weighted image (arrows). (B) The extent of marrow involvement is better seen on a sagittal STIR image (white arrows). Peritumoral edema and soft-tissue component are hyperintense (black arrowheads). (C) Large associated soft-tissue component is seen on an axial fat-suppressed T2-weighted image (arrows). (D) Axial CT image obtained for biopsy shows destruction of the distal femur with pathological fracture (arrow). (E) Osseous destruction with soft-tissue component is demonstrated (arrows).
|
 |
|
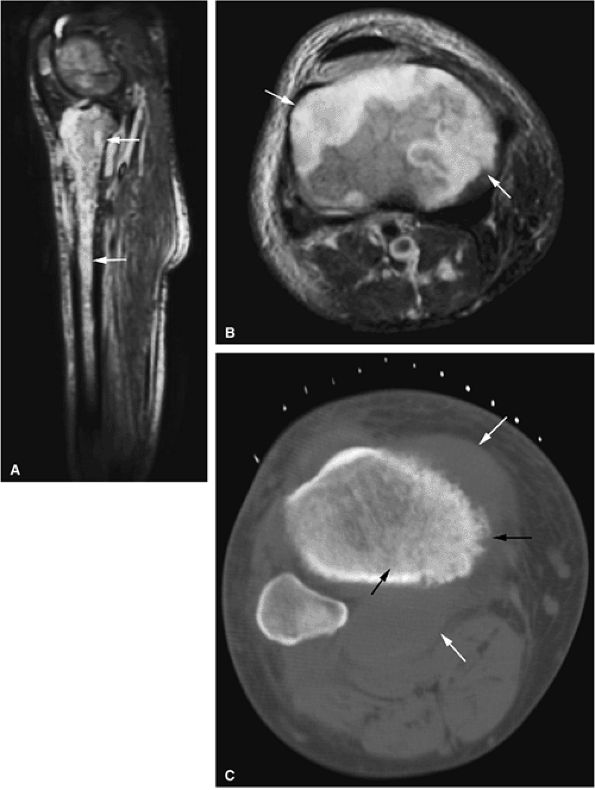
FIGURE 13.32 ● High-grade non-Hodgkin lymphoma of the tibia. (A) Sagittal STIR image demonstrates hyperintense marrow infiltration (arrows). (B) Abnormal enhancement of the bone marrow is seen on an axial fat-suppressed T1-weighted image (arrows). (C) Soft-tissue component (white arrows) and marrow infiltration (black arrows) are seen on an axial CT image obtained during biopsy.
|
 |
|
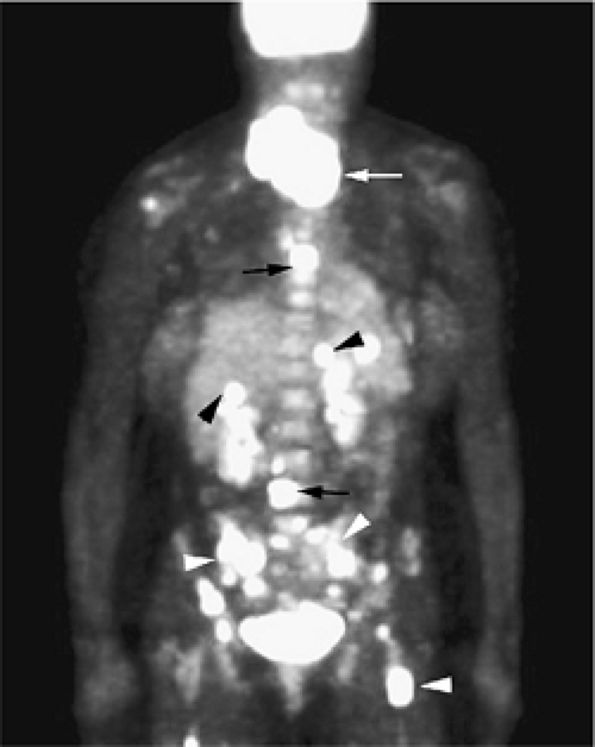
FIGURE 13.33 ● Whole-body FDG-PET scan in a patient with lymphoblastic lymphoma. Large mass with abnormal FDG uptake is noted involving the upper mediastinum (white arrow). Increased uptake is noted throughout the spine (black arrows), the pelvis, and the proximal femurs (white arrowheads). Foci of increased uptake in the liver are consistent with tumor involvement (black arrowheads).
|
 |
|
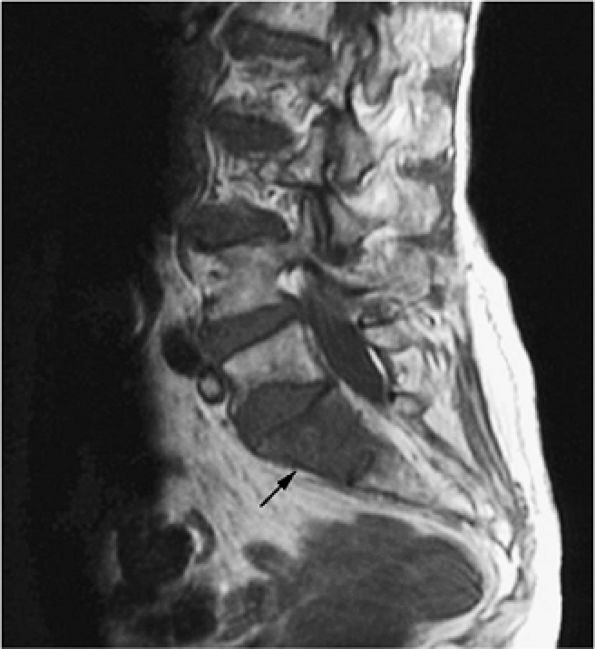
FIGURE 13.34 ● Sagittal T1-weighted image of the lumbosacral spine demonstrates focal low signal intensity of the S1 vertebral body, consistent with lymphomatous involvement (arrow).
|
-
Staging is of particular importance in Hodgkin disease because bone marrow involvement presents a potentially
P.2002
fatal outcome and is therefore treated with more aggressive multiagent chemotherapy. Whole-body MR imaging and whole-body FDG-PET have been found to be useful in the staging of lymphoma.30,85,86,87 -
Mediastinal tumor is common in the supradiaphragmatic presentation of Hodgkin disease, and MR imaging can also identify bone marrow involvement not appreciated at the time of diagnosis.
-
An additional benefit of MR imaging, particularly when STIR protocols are used, is the depiction of lymph node invasion. In contrast, CT, although highly accurate for lymph node detection, is insensitive to marrow involvement in the absence of bone destruction.
-
Focal marrow lymphoma may simulate metastatic disease (Fig. 13.36). In contrast to Hodgkin disease, non-Hodgkin lymphoma demonstrates early bone marrow involvement.
-
AIDS-related lymphomas, which are high grade and of B-cell origin, frequently demonstrate both marrow dissemination and soft-tissue involvement. Short TI inversion recovery contrast is most effective in characterizing these sites of tumor involvement.
 |
|
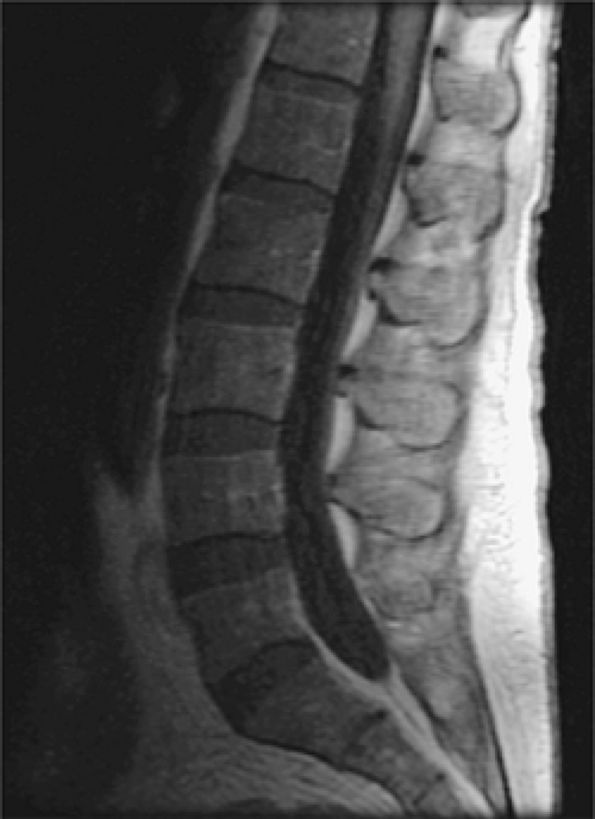
FIGURE 13.35 ● Diffuse lymphomatous involvement of the spine. Infiltration of the marrow is hypointense on a sagittal T1-weighted image of the lumbar spine simulating leukemic involvement.
|
-
Changes in lumbar vertebral bone marrow have been characterized on MR scans of patients receiving radiation
P.2003
therapy for Hodgkin disease.89,90 In response to treatment with 1,500 to 5,000 rads, increased signal intensity can be detected on STIR images within 2 weeks. MR changes are thought to reflect marrow edema and necrosis. -
On T1-weighted images, increased heterogeneity of signal intensity, caused by the predominance of high-signal-intensity fat, can be identified 3 to 6 weeks after radiation.
-
Late marrow changes, including fatty marrow replacement, occur 6 weeks to 14 months after radiation therapy. On MR scans, these changes are seen as either homogeneous fatty marrow replacement of the vertebral body (Fig. 13.37) or peripheral hematopoietic intermediate-signal-intensity marrow adjacent to a central zone of fatty marrow.
-
The delineation between irradiated and nonirradiated areas can be sharply defined on STIR images, on which fat displays dark or black signal intensity and adjacent hematopoietic marrow demonstrates intermediate signal intensity.
-
On T1-weighted images, the postradiation identification of low-signal-intensity vertebral body marrow, especially in the presence of fat marrow signal intensity seen at other levels, is consistent with recurrent disease. T1-weighted and STIR images are most sensitive in identifying recurrent disease in or adjacent to the field of radiation.
-
Coronal T1-weighted and STIR images are also useful in evaluating internal changes in tumor size and recurrent disease in Hodgkin disease and non-Hodgkin lymphoma after whole-body irradiation and bone marrow transplantation.
-
Monoclonal antibodies tagged to a radioisotope or chemotherapeutic agent have also been used in lymphoma treatment. On STIR images, red marrow stores can be differentiated from lymphoma by the significantly increased signal intensity in lymphomatous infiltration. In long-term fatty replacement of bone marrow after radiation therapy for Hodgkin disease, studied by Kauczor et al.,91 there is an increase in relative fat signal in the thoracic and lumbar spines, without signs of marrow degeneration, 15 to 126 months after radiation therapy. Nonirradiated pelvic and femoral marrow, however, demonstrates a relative decrease in fat signal intensity, indicating marrow reconversion. In patients receiving radiation therapy for cervical carcinoma, signal intensity changes in pelvic marrow can be detected as early as 8 days after the initiation of radiation therapy. A complete fatty marrow pattern is observed 6 to 8 weeks after radiation therapy.92 Adjacent nonirradiated marrow demonstrates lesser degrees of similar signal intensity changes on T1-weighted and STIR images.
 |
|
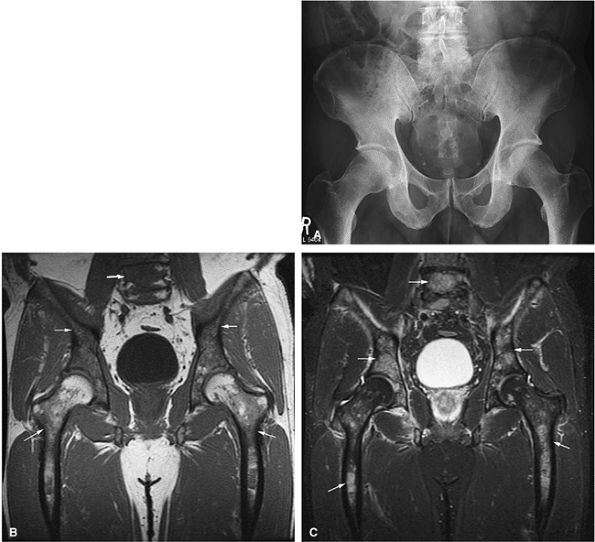
FIGURE 13.36 ● (A) An anteroposterior radiograph of the pelvis is negative for lymphomatous involvement. (B) On a T1-weighted coronal image of the pelvis, the proximal femurs and lower lumbar spine (arrows) display nonspecific low signal intensity. The fatty marrow of the epiphysis and greater trochanter is spared. (C) On a coronal STIR image, there is high-signal-intensity patchy nodularity of lymphomatous marrow involvement in the pelvis, proximal femurs, and lumbar spine (arrows). The spared yellow marrow of the greater trochanter and femoral epiphysis appears black.
|
 |
|
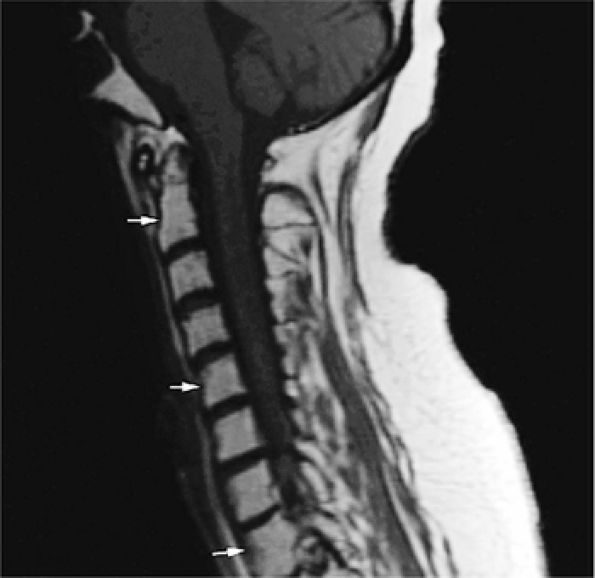
FIGURE 13.37 ● Fatty marrow infiltration following radiation therapy for non-Hodgkin lymphoma. Sagittal T1-weighted image of the cervical spine shows diffuse bright-signal vertebral bodies (arrows).
|
-
Langerhans cell histiocytosis is the “great imitator” of various benign and malignant bone lesions.
-
This disorder frequently presents with vertebral body collapse (vertebra plana).
-
It is important to differentiate localized from disseminated disease (different prognosis).
-
Consider CT-guided percutaneous steroid injection for treatment.
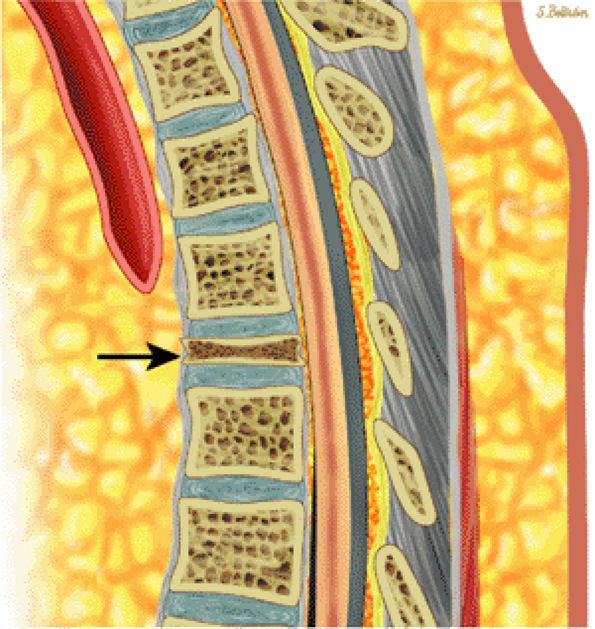
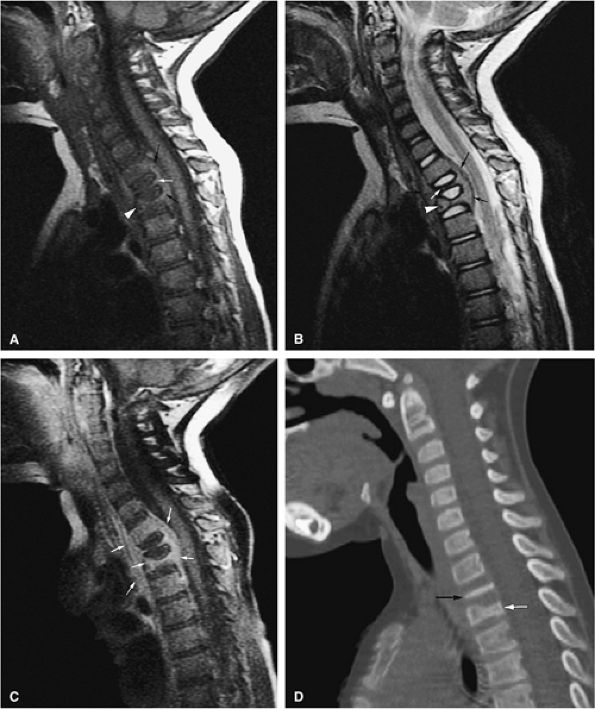
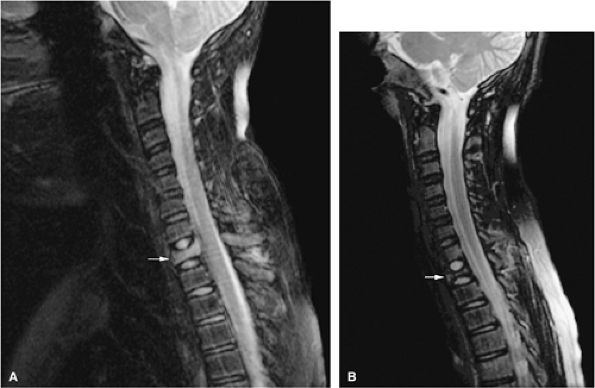
metaphysis or extend to the physeal plate (Fig. 13.39). There may also be localized bone expansion, indicated by a low-signal-intensity sclerotic peripheral border. Eosinophilic granuloma may be associated with perilesional or peritumoral edema. In the vertebral body, eosinophilic granuloma may present as a vertebra plana with diffuse infiltration of the vertebral body (Figs. 13.40, 13.41, and 13.42). Typical characteristics on T1- and T2-weighted images, however, are nonspecific for the diagnosis of eosinophilic granuloma. Age, location and morphology of signal intensity changes, is important in determining a differential diagnosis.
 |
|
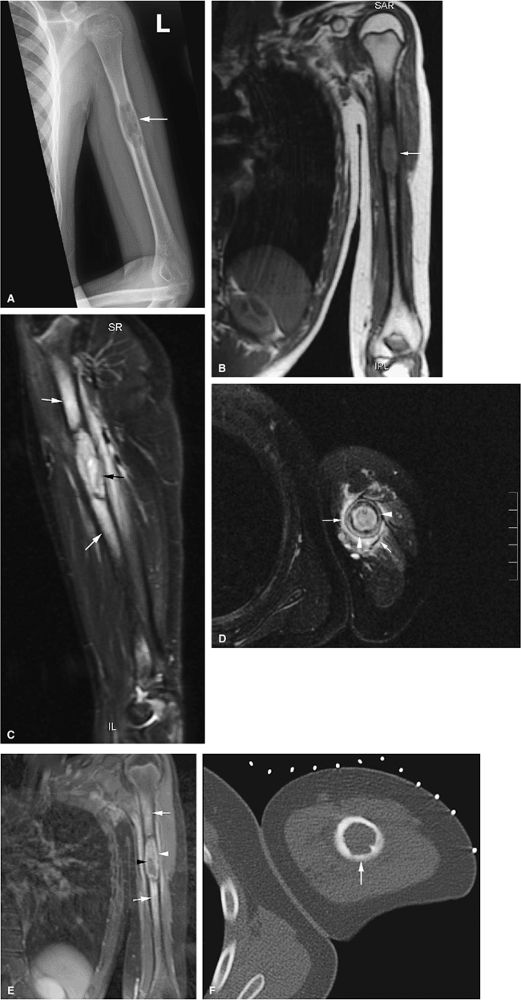
FIGURE 13.38 ● Langerhans cell histiocytosis of the humeral diaphyses. (A) Anteroposterior radiograph shows an expansile lytic lesion in the humeral diaphysis (arrow). (B) Coronal T1-weighted image shows low-signal-intensity histiocytic infiltration (arrow). (C) The lesion is hyperintense on a coronal STIR image (black arrow). Surrounding edema is hyperintense (white arrows). (D) Cortical thickening (white arrowheads) and surrounding edema (white arrows) are noted on an axial fat-suppressed T2-weighted image. (E) On a coronal fat-suppressed T1-weighted image following the intravenous administration of gadolinium, there is enhancement of the diaphyseal lesion (white arrowhead) with a central nonenhancing area (black arrowhead). Enhancing edema surrounds the lesion (white arrows). (F) Axial CT image obtained during percutaneous biopsy shows the expansile lytic lesion (arrow).
|
 |
|
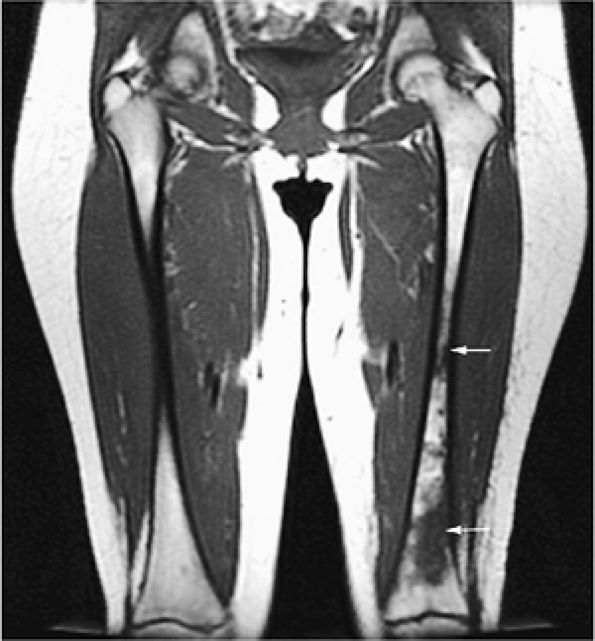
FIGURE 13.39 ● Langerhans cell histiocytosis of the femoral diaphysis and metaphysis. Coronal T1-weighted image shows patchy areas of low-signal-intensity histiocytic infiltration (arrows).
|
 |
|
FIGURE 13.40 ● Sagittal graphic illustration shows vertebra plana of the thoracic spine (arrow).
|
 |
|
FIGURE 13.41 ● (A) Sagittal T1-weighted image shows complete collapse of the T2 vertebral body (white arrow) and greater than 50% collapse of the T3 vertebral body (white arrowhead). A surrounding soft-tissue mass is noted (black arrow). (B) Corresponding T2-weighted image shows collapse of the T2 (white arrow) and T3 (white arrowhead) vertebral bodies. A surrounding soft-tissue component is present (black arrows). (C) On a sagittal fat-suppressed T1-weighted image following the intravenous administration of gadolinium, there is diffuse enhancement of the tumor and soft-tissue component (arrows). (D) Sagittal CT image shows complete collapse of the T2 vertebral body (black arrow). Vertebral body height loss of T3 is also noted (white arrow).
|
 |
|
FIGURE 13.42 ● (A) Sagittal STIR image shows collapse and edema of the T1 vertebral body (arrow). (B) Following therapy there is increased vertebral body collapse and resolution of edema as seen on a sagittal STIR image (arrow). The patient was asymptomatic at this point.
|
osteosclerotic bone lesions; E for endocrine abnormalities, including diabetic mellitus, adrenal insufficiency, and hypothyroidism; M for an increase in serum M protein; and S for skin thickening with increased pigmentation).100,101 According to the staging system proposed by Durie and Salmon, patients with up to one lytic bone lesion present with stage I and patients with more than one lytic bone lesion present with stage III.102,103,104
 |
|
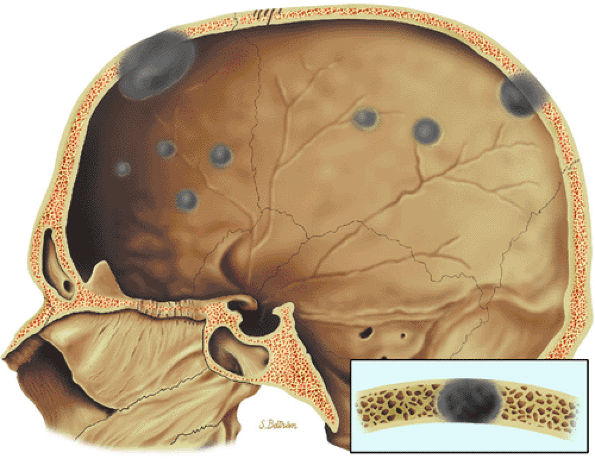
FIGURE 13.43 ● Multiple punched-out lesions are seen as gray areas of the skull on this sagittal graphic illustration.
|
 |
|
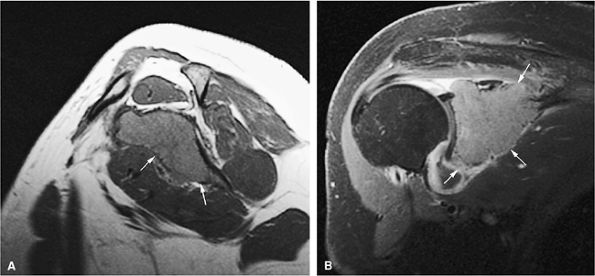
FIGURE 13.44 ● Plasmacytoma of the scapula. (A) Sagittal T1-weighted image shows marrow infiltration that demonstrates low signal intensity (arrows). (B) On a coronal fat-suppressed T2-weighted image, the tumor is intermediate in signal intensity. Osseous expansion is noted (arrows).
|
 |
|
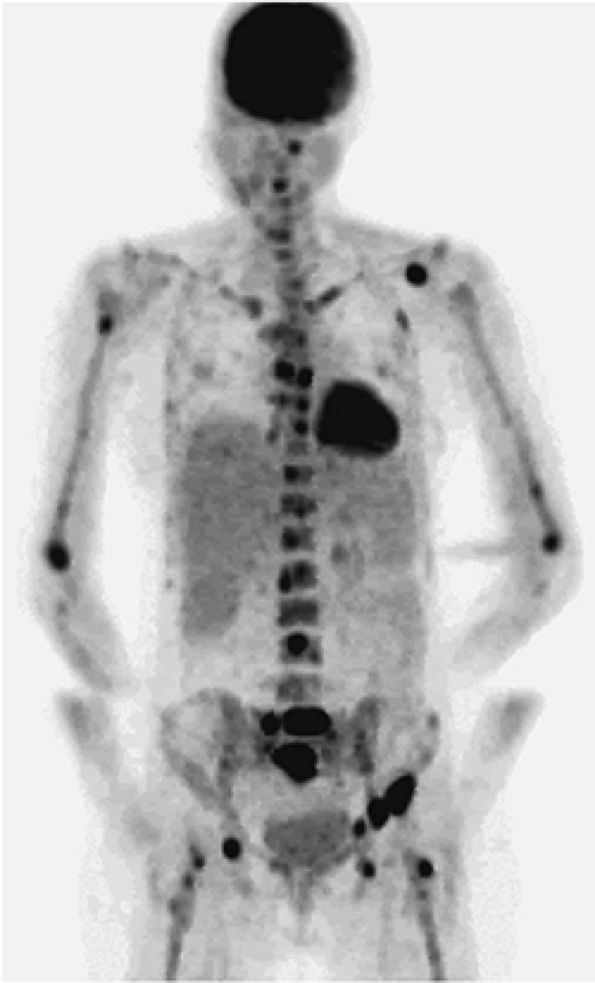
FIGURE 13.45 ● Whole-body FDG-PET scan of a patient with myeloma shows multiple areas of abnormal FDG uptake involving the axial and peripheral skeleton.
|
MR imaging of the spine in early myeloma may show involvement in both symptomatic and asymptomatic patients (Figs. 13.50 and 13.51).93
 |
|
FIGURE 13.46 ● (A) Multifocal presentation (arrows) of multiple myeloma with interspersed normal marrow on a coronal T1-weighted image. (B) The lesions (arrows) are hyperintense on this sagittal STIR image. Soft-tissue extension and surrounding edema are better seen on the STIR image (arrowheads).
|
 |
|
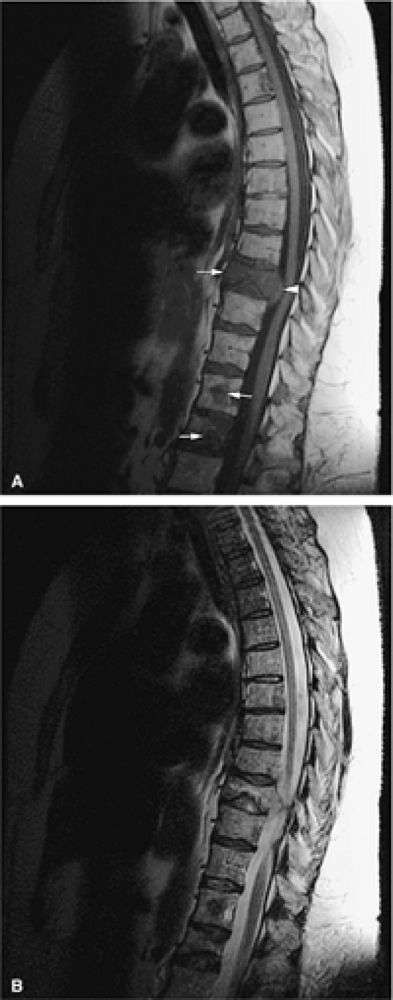
FIGURE 13.47 ● (A) Multiple myeloma showing hypointense marrow involvement (arrows) on a sagittal T1-weighted image of the thoracic spine. Vertebral body collapse and epidural extension of the tumor are noted (arrowhead). (B) Marrow involvement is not well seen on the corresponding sagittal T2-weighted image.
|
-
Areas of involvement demonstrate low signal intensity on T1-weighted images and high signal intensity on T2-weighted, STIR, and Gd-DTPA enhanced images (Figs. 13.52 and 13.53).108
-
STIR images demonstrate greater lesion contrast than that seen on corresponding conventional T2-weighted images.
-
Whole-body imaging is useful in detecting the extent of myelomatous involvement.56,105,109 The percentage of bone marrow involvement may not correlate with the MR appearance, however.110
 |
|
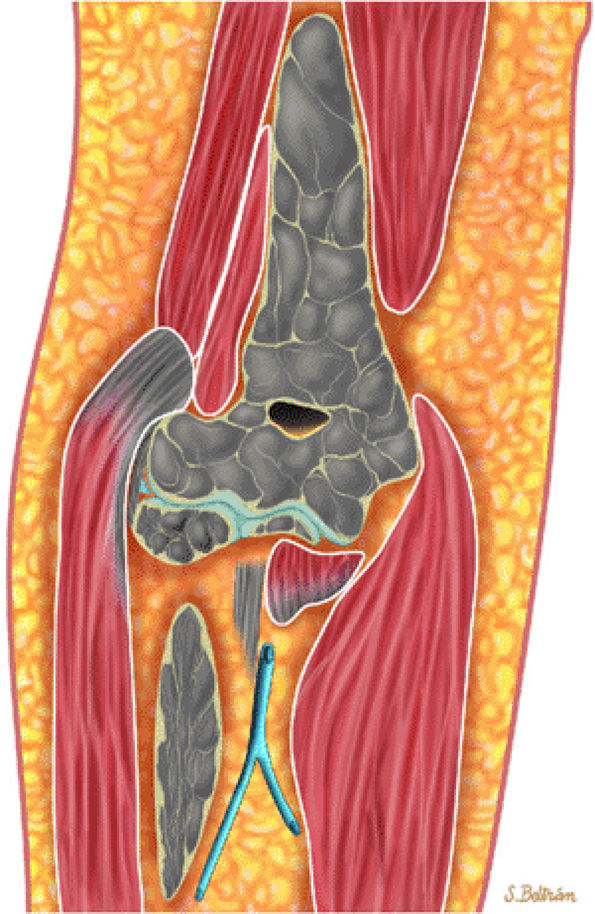
FIGURE 13.48 ● A diffuse pattern of marrow replacement of the elbow is indicated in gray on this coronal graphic illustration.
|
 |
|
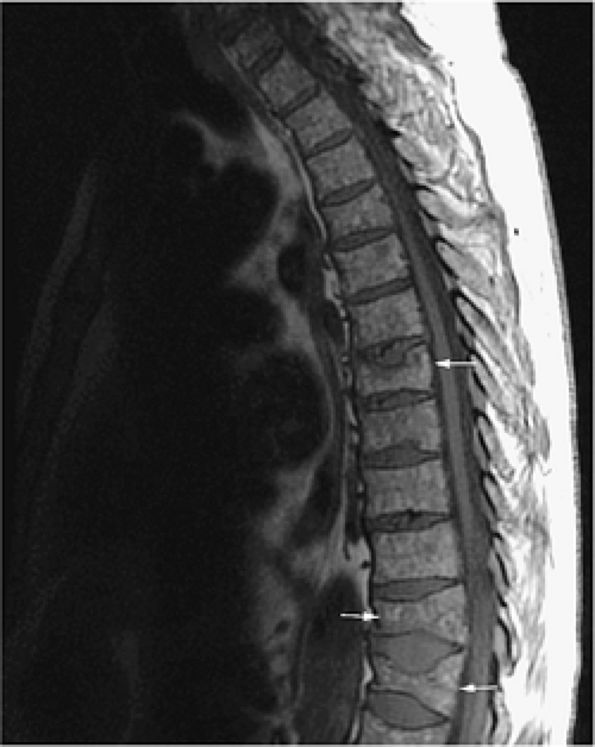
FIGURE 13.49 ● Sagittal T1-weighted image shows a diffuse pattern of involvement of the thoracic spine. Myelomatous infiltration is hypointense. Multiple compression fractures are present (arrows).
|
 |
|
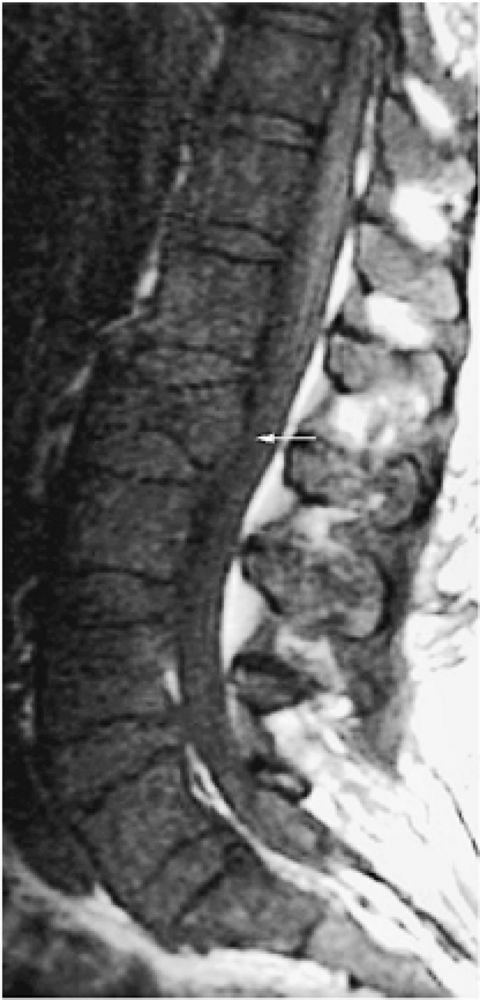
FIGURE 13.50 ● Multiple myeloma in a patient with elevated urinary light chains and low back pain. Diffuse marrow replacement is dark on a sagittal T1-weighted image. A pathologic compression fracture of L2 is present (arrow).
|
 |
|
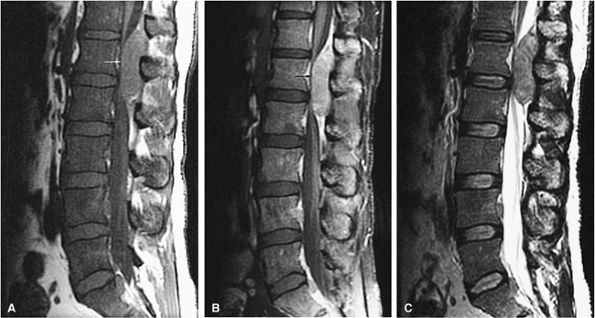
FIGURE 13.51 ● Diffuse marrow replacement with an epidural soft-tissue mass in a patient with multiple myeloma. (A) Sagittal T1-weighted image shows diffuse marrow replacement of the lumbar spine. The large epidural soft-tissue lesion causes a mass effect on the thecal sac (arrow). Myelomatous marrow infiltration is darker than the adjacent intervertebral disks. (B) Enhancement of the soft-tissue mass is shown on a sagittal fat-suppressed T1-weighted image after intravenous administration of gadolinium (arrow). (C) Diffuse marrow replacement is not well seen on the corresponding sagittal T2-weighted image.
|
 |
|
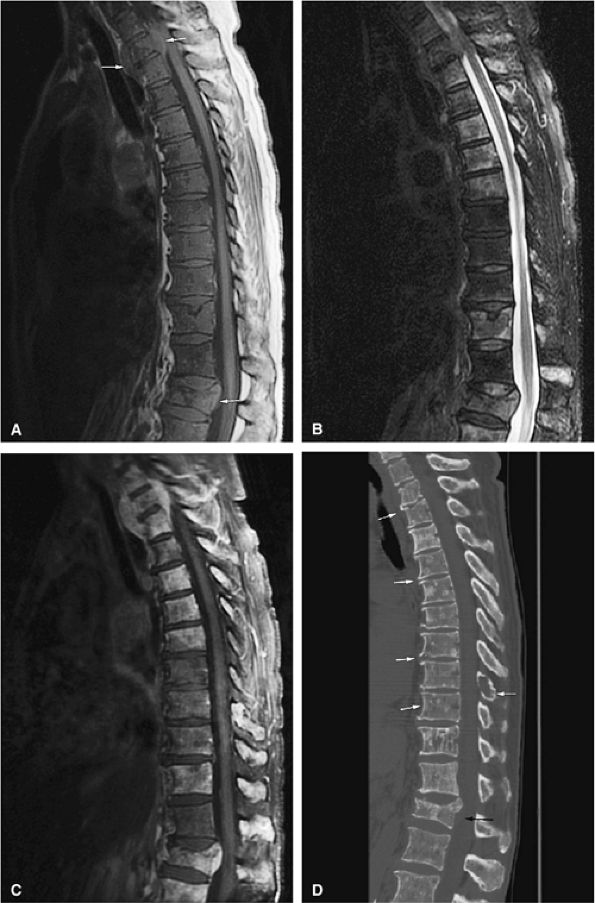
FIGURE 13.52 ● (A) Sagittal T1-weighted image shows diffuse bone marrow replacement of the thoracic spine. Marrow replacement is darker than the adjacent disk on a T1-weighted image. Compression fractures with an epidural soft-tissue component are present (arrows). (B) Marrow involvement is hyperintense on a sagittal STIR image. There is involvement of the vertebral bodies and posterior elements. (C) Involved marrow and associated soft-tissue components are hyperintense on a sagittal fat-suppressed T1-weighted image after the intravenous administration of gadolinium. (D) On a sagittal CT image, bone marrow infiltration and lytic lesions involving the thoracic spine are noted. Destruction of the vertebral bodies and posterior elements is present (white arrows). Pathologic fracture with extension into the spinal canal can also be seen (black arrow).
|
 |
|
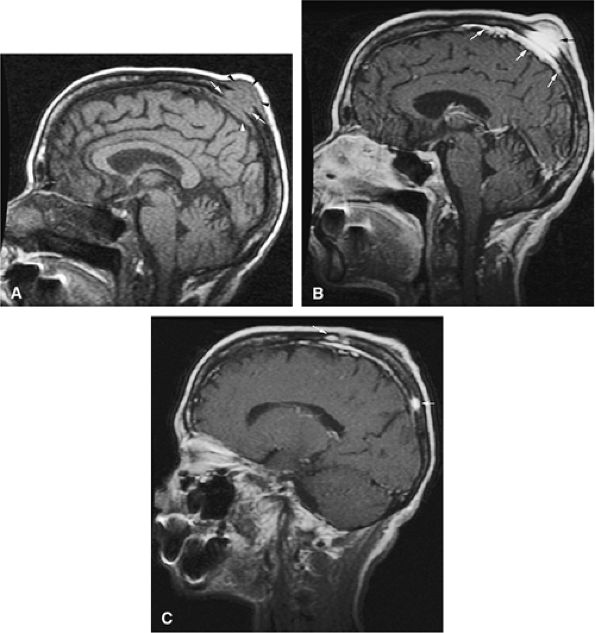
FIGURE 13.53 ● Multiple myeloma of the skull. (A) Sagittal T1-weighted image demonstrates myelomatous lesion of the calvarium (white arrows). An associated soft-tissue mass (black arrowheads) and dural thickening (white arrowhead) are noted. (B) Enhancement of the lesion (black arrow) and underlying dura (white arrows) is seen on a fat-suppressed T1-weighted image after administration of gadolinium. (C) Additional enhancing lesions are identified on a sagittal fat-suppressed T1-weighted image after administration of gadolinium (arrows).
|
-
Resolution of the abnormal marrow or a persistent marrow abnormality without associated contrast enhancement is seen in a positive therapeutic response.111,112
-
A pattern of peripheral rim enhancement also correlates with a positive response to chemotherapy.
-
A partial response to treatment is characterized by conversion from a diffuse to a variegated or focal marrow pattern, with decreased signal intensity in areas of marrow previously showing persistent contrast enhancement with intravenous gadolinium.
 |
|
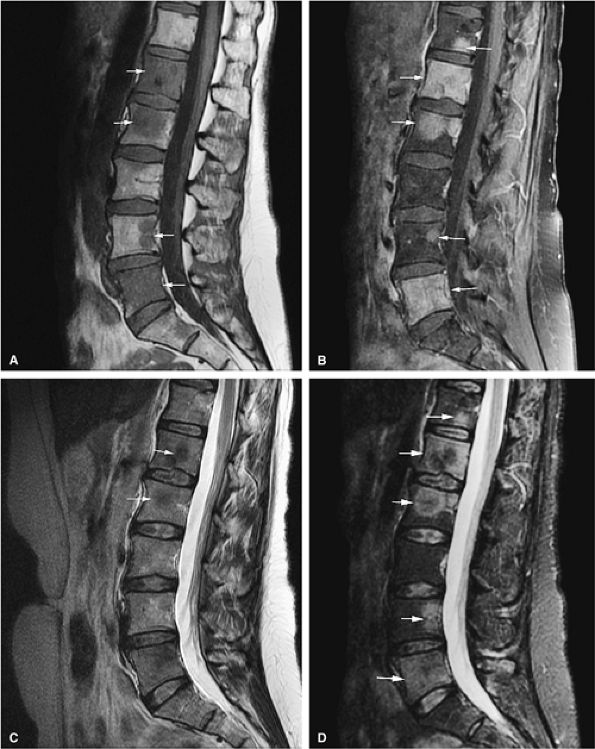
FIGURE 13.54 ● Prostate carcinoma that has metastasized to the spine. Spinal metastases (arrows) demonstrate low signal intensity on a T1-weighted sagittal image (A), with evidence of enhancement on a sagittal fat-suppressed T1-weighted image following the intravenous administration of gadolinium (B). The tumor is not well seen on the corresponding T2-weighted image (C) and is better visualized on the STIR sequence (D).
|
-
STIR and T1-weighted sequences with and without gadolinium are most useful in detecting metastatic disease.
-
Consider whole-body MR imaging for staging.
-
A halo sign on T2-weighted images indicates active disease, whereas a halo sign on T1-weighted images indicates response to therapy.
be accompanied by necrosis, fibrosis, bone destruction (osteolytic activity), or bone production (osteoblastic activity) (Fig. 13.63).114
 |
|
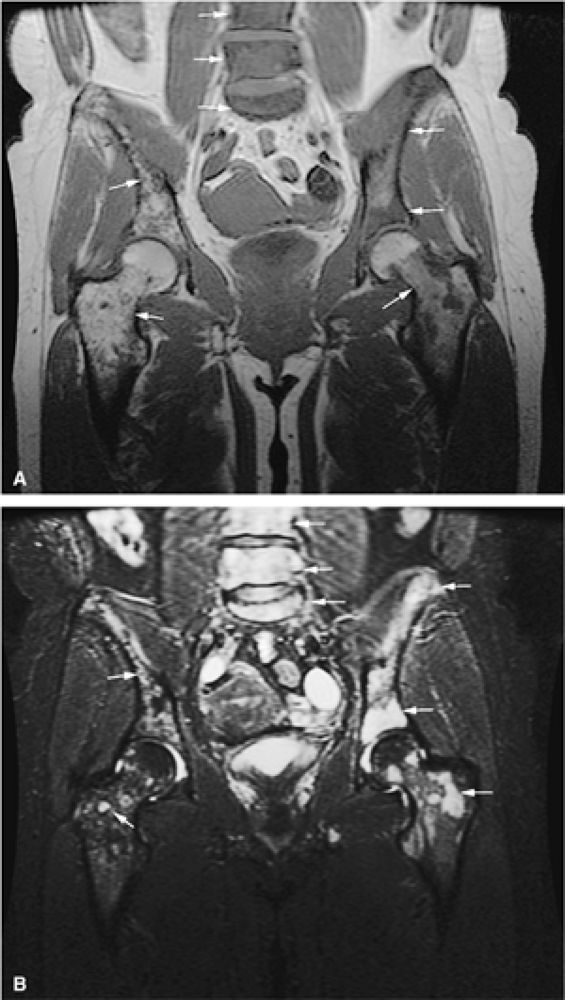
FIGURE 13.55 ● Metastatic breast carcinoma. Multiple metastatic lesions of the pelvis and lumbar spine (arrows) are hypointense on a coronal T1-weighted image (A) and hyperintense on a coronal STIR image (B). The greatest degree of hyperintensity is seen in the more active lesions of the lumbar spine, the left hemipelvis, and the proximal femur.
|
 |
|
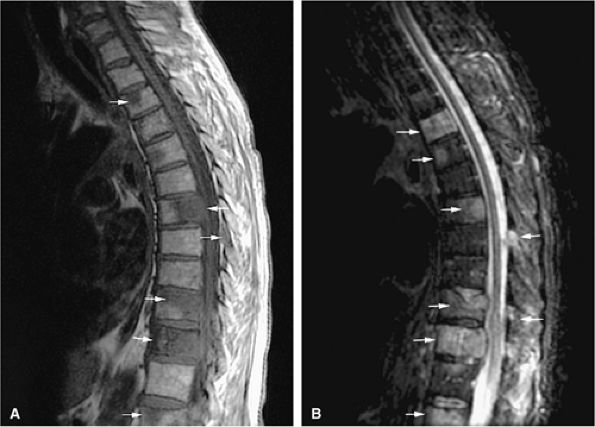
FIGURE 13.56 ● Metastatic lung carcinoma (arrows). (A) Sagittal T1-weighted image shows multiple metastatic deposits in the lumbar spine involving the vertebral bodies and posterior elements. (B) Metastatic tumor is hyperintense on a sagittal STIR image.
|
 |
|
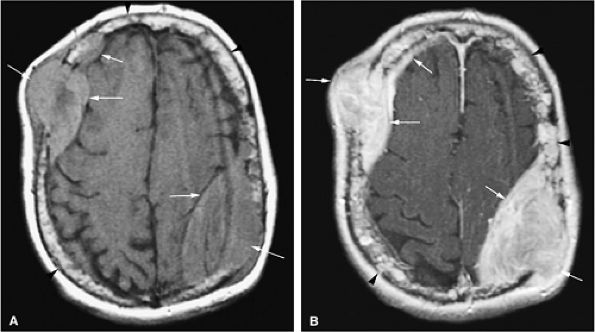
FIGURE 13.57 ● Extensive bone marrow replacement of the skull secondary to metastatic renal cell cancer (arrowheads). Large focal lesions with intracranial extension are present (arrows). (A) Axial proton density-weighted image shows expansion of the marrow cavity and metastatic deposits that demonstrate intermediate signal intensity. (B) Extensive enhancement of metastatic disease is seen on an axial fat-suppressed T1-weighted image following the intravenous administration of gadolinium.
|
 |
|
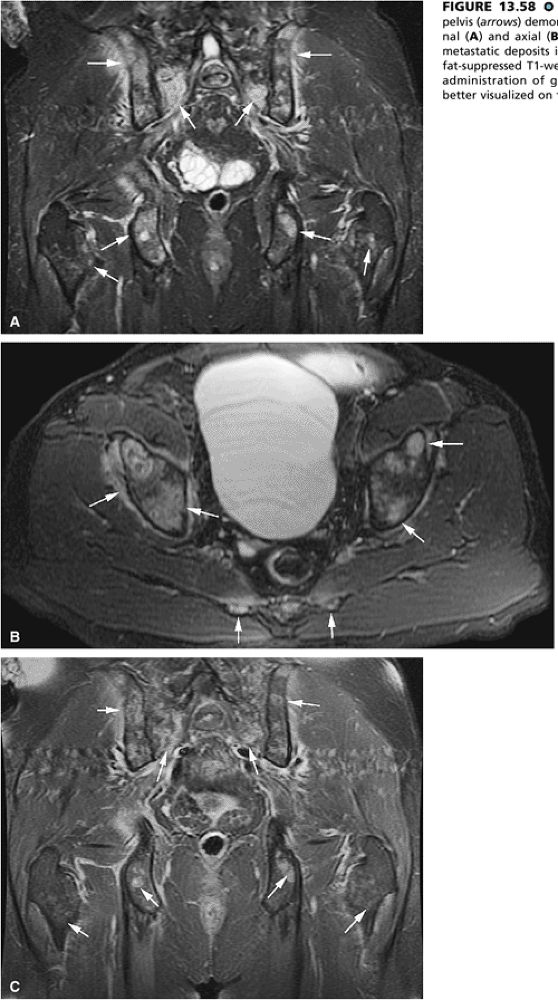
FIGURE 13.58 ● Colon carcinoma metastatic to the pelvis (arrows) demonstrates high signal intensity on coronal (A) and axial (B) STIR images. (C) Enhancement of metastatic deposits is noted on a corresponding coronal fat-suppressed T1-weighted image following intravenous administration of gadolinium. Metastatic deposits are better visualized on the STIR sequence.
|
 |
|
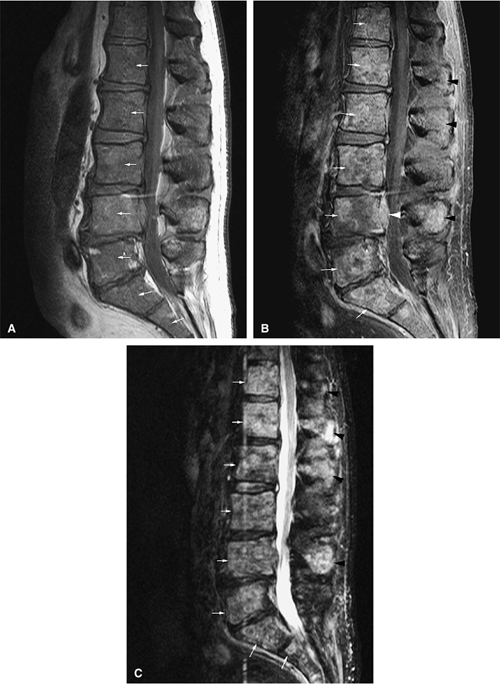
FIGURE 13.59 ● Melanoma metastatic to the lumbar spine (arrows) shows diffuse low-signal-intensity marrow infiltration on a sagittal T1-weighted image (A) and high signal on a sagittal fat-suppressed contrast-enhanced T1-weighted image (B). An enhancing epidural component is noted posterior to L4 (white arrowhead). (C) Metastatic tumor is hyperintense on the corresponding sagittal STIR image (arrows). Posterior element involvement (black arrowheads) is better demonstrated on the STIR and contrast-enhanced images.
|
 |
|
FIGURE 13.60 ● Coronal graphic illustration of the hip shows diffuse metastatic marrow replacement. The pelvic bones are a common site for metastatic disease due to their rich vascular supply.
|
 |
|
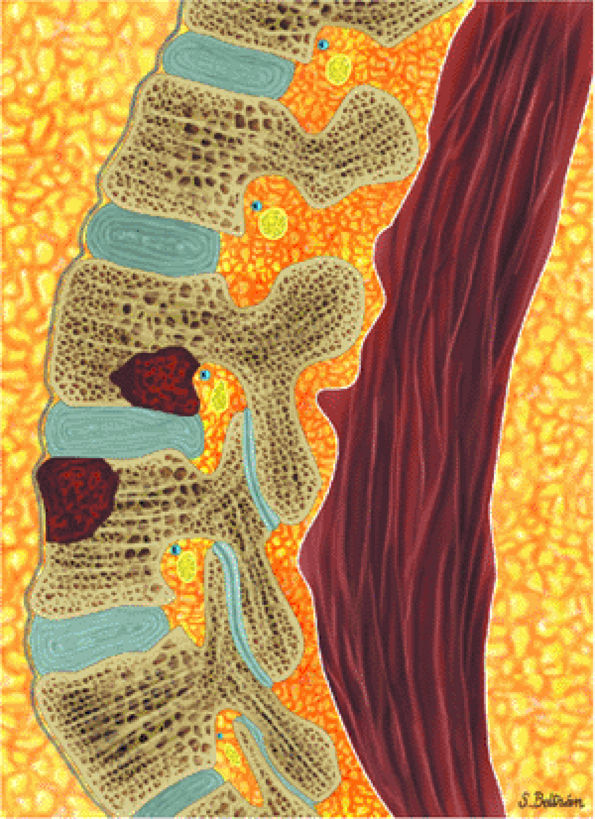
FIGURE 13.61 ● Metastatic disease to the lumbar spine is shown in brown on a sagittal graphic illustration. The spine has a rich blood supply through the vertebral venous plexus and is therefore a common site for metastases.
|
 |
|
FIGURE 13.62 ● A coronal graphic illustration shows metastatic deposits involving the proximal femoral and humeral metaphyses and spine in red. These are common sites for metastatic disease.
|
 |
|
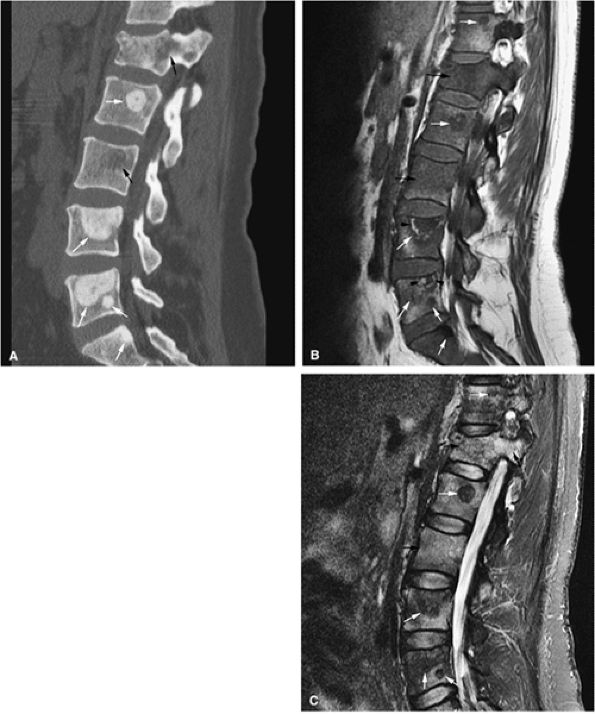
FIGURE 13.63 ● Metastatic breast carcinoma with osteo-blastic metastases. (A) Sclerotic metastases (white arrows) are seen on a sagittal CT image. Osteolytic marrow infiltration of the L1 vertebral body and posterior elements with an associated compression fracture is noted (black arrows). (B) Hypointense vertebral bodies are shown on a sagittal T1-weighted sagittal image (black arrows). The focal metastatic deposits are darker than the vertebral bodies (white arrows). Hyperintense signal surrounding the L4 and L5 metastases is noted, indicating response to therapy (arrowheads). (C) The osteoblastic lesions remain hypointense on a sagittal STIR image (white arrows), whereas the vertebral bodies are hyperintense (black arrows).
|
 |
|
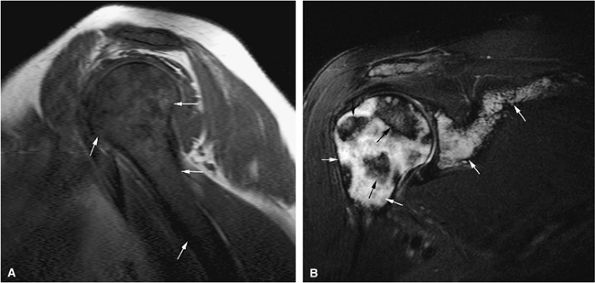
FIGURE 13.64 ● Metastatic breast cancer involving the shoulder. (A) Diffuse hypointense marrow replacement is seen on a sagittal T1-weighted image (arrows). (B) Metastatic tumor is better visualized on the coronal STIR image (white arrows). Uninvolved marrow is hypointense (black arrows).
|
-
STIR scans are used to screen the axial skeleton for metastatic disease. If this sequence shows no focal areas of high signal intensity, the likelihood of microscopic marrow tumor involvement is low. Symptomatic individuals, however, occasionally have an inhomogeneous distribution of red marrow that may simulate metastatic disease, particularly in the proximal femurs. Osteomyelitis or infection may have to be excluded on clinical grounds (Fig. 13.65). Adenopathy or extension across the disk space indicates infection.
-
Metastatic disease has been successfully detected on MR T1-weighted and STIR images, even when bone scans are negative or equivocal.
-
MR imaging provides an excellent means of assessing soft-tissue involvement and pathologic fractures (Fig. 13.66), and Gd-DTPA enhancement is useful in the assessment of epidural spread.
-
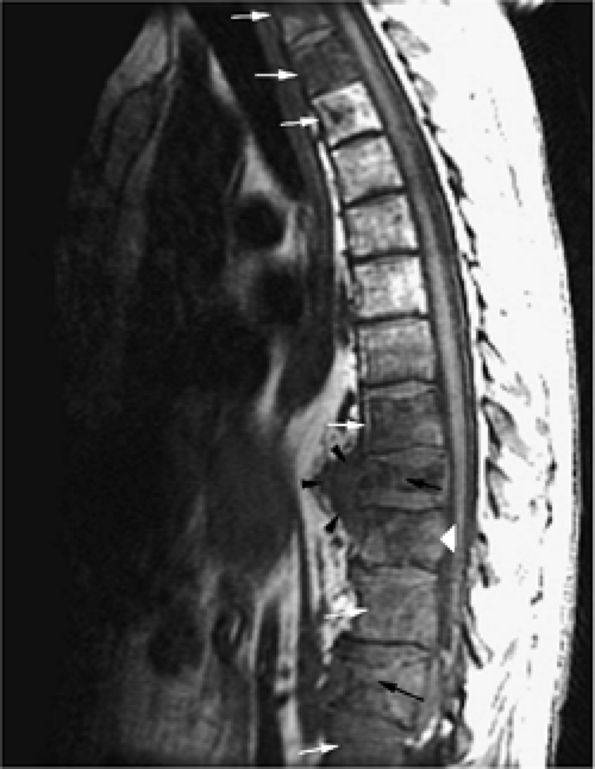
The morphology of the posterior vertebral body cortex should be evaluated for convexity, a sign associated with metastatic tumor extension. A chronic, benign compression fracture frequently demonstrates fat marrow signal intensity (i.e., bright on T1-weighted images, dark on STIR images). In more acute compression fractures, subchondral reaction often parallels the endplate without the more central or heterogeneous involvement seen in metastatic disease.
-
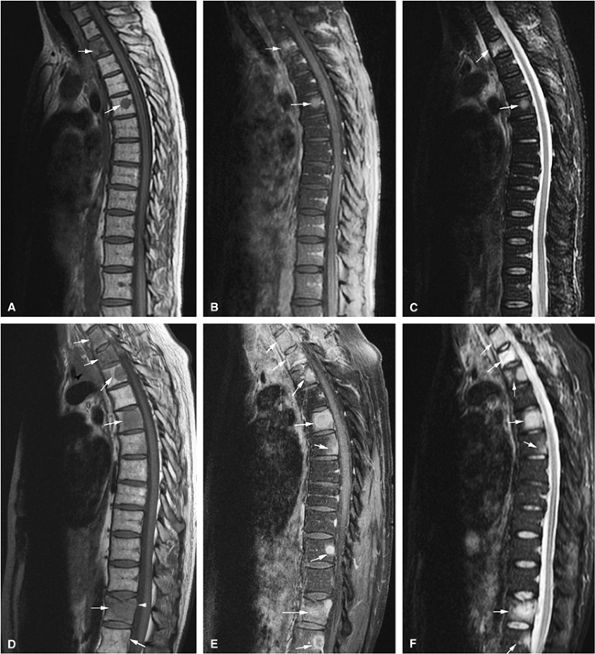
Disease progression and peritumoral reaction can be monitored on baseline or serial MR studies (Fig. 13.67).
-
Schweitzer et al.115 have described the bull—s-eye sign (a focus of high signal intensity in the center of a lower-signal-intensity osseous marrow abnormality, seen on T1-weighted images) as a specific indicator of normal hematopoietic marrow and not metastatic disease.
-
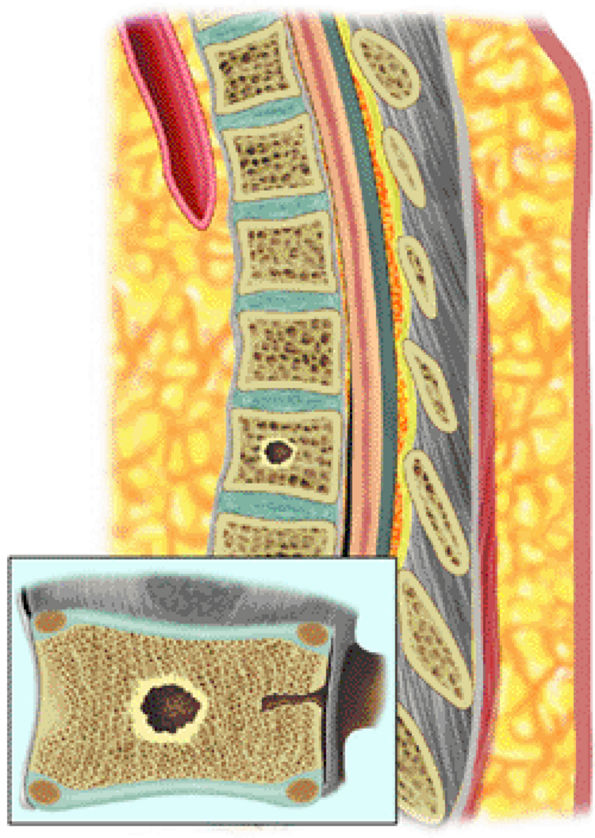
Both the halo sign (a peripheral rim of increased signal intensity around an osseous lesion seen on T2-weighted images) and diffuse signal hyperintensity on T2-weighted images have been found to correlate with metastatic
P.2023P.2024
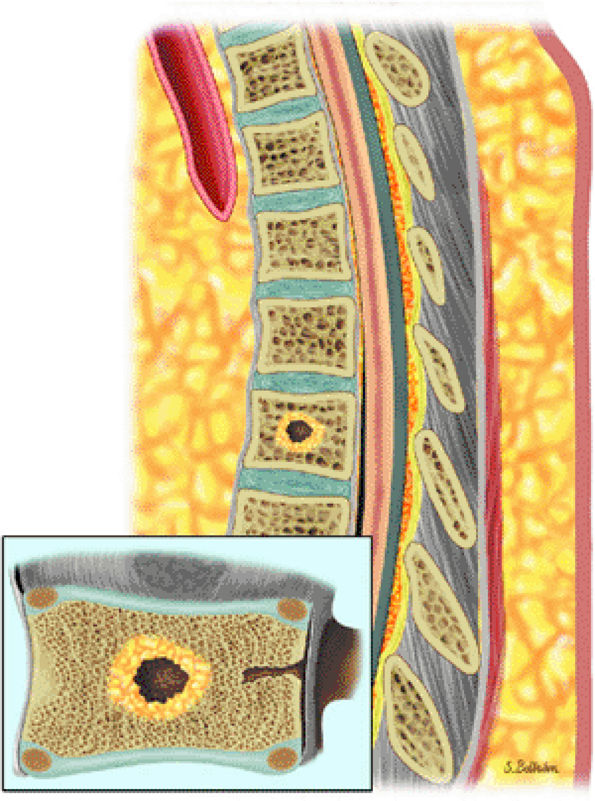
disease (Fig. 13.68), whereas a rim of high-signal-intensity yellow marrow surrounding a focal marrow lesion on T1-weighted images is seen in treated lesions that have responded to therapy (Fig. 13.69). The halo sign, most commonly seen in osteoblastic metastases from prostate cancer, is thought to occur secondary to trabecular destruction with a resultant fluid-filled gap. Mucinous or cellular tissue could contribute to hyperintense signal intensity on T2-weighted sequences. -
The term healing flare response has been used to describe treated skeletal metastases from breast cancer. Healing flare is characterized by increased radiotracer uptake and radiographic (including CT) demonstration of sclerotic changes in previously documented osteolytic or mixed skeletal metastases.116 MR imaging can also be used to demonstrate healing flare and interval sclerosis (Fig. 13.70). Healing flare in skeletal metastases does not correlate with survival rate (patients with stable metastases after hormonal treatment or chemotherapy live as long), and the increased uptake on bone scans may give the false appearance of more extensive metastasis. Therefore, in monitoring therapy to determine the success of treatment, it is important to correlate bone scans that show increased uptake with CT or MR imaging.
 |
|
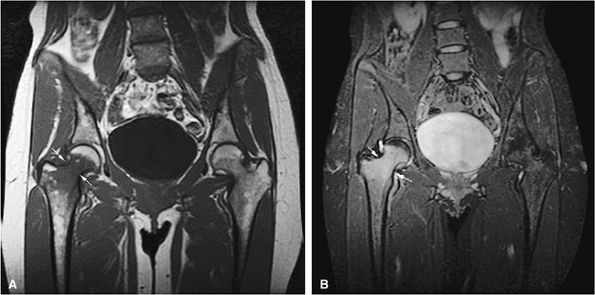
FIGURE 13.65 ● Osteomyelitis of the proximal femur (arrows). Focal marrow involvement of the proximal femoral metaphysis simulates metastatic disease on a coronal T1-weighted image (A) and a coronal STIR image (B).
|
 |
|
FIGURE 13.66 ● Metastatic tumor of the thoracolumbar spine (white arrows) with multiple compression fractures (black arrows). Note the convexity of the posterior vertebral body cortex (white arrowhead), a sign of tumor involvement. Soft-tissue extension is visualized anteriorly (black arrowheads).
|
 |
|
FIGURE 13.67 ● Metastatic lung carcinoma. Baseline study shows metastatic disease of the upper thoracic spine (arrows). (A) Metastases are hypointense on a sagittal T1-weighted image. (B) Enhancement following the administration of intravenous gadolinium is noted on a sagittal fat-suppressed T1-weighted image. (C) Metastatic tumor is hyperintense on the corresponding STIR image. Follow-up study demonstrates marked progression of metastatic disease (arrows). (D) Metastatic marrow infiltration is hypointense on a sagittal T1-weighted image. Pathologic compression fracture (white arrowhead) shows convex posterior vertebral body cortex. Mediastinal tumor infiltration (black arrowhead) is noted. (E) On a sagittal contrast-enhanced fat-suppressed T1-weighted image, there is enhancement of metastatic disease. (F) Metastases are hyperintense on a corresponding STIR image.
|
 |
|
FIGURE 13.68 ● The halo sign is demonstrated on a sagittal graphic illustration. A peripheral rim of T2 hyperintensity surrounding a lesion indicates active metastatic disease.
|
 |
|
FIGURE 13.69 ● Sagittal graphic illustration showing a peripheral rim of yellow marrow surrounding a metastatic lesion. High signal surrounding a metastatic lesion on T1-weighted images indicates response to therapy.
|
-
Gaucher disease lesions demonstrate decreased signal on T1- and T2-weighted images.
-
Osteonecrosis is common.
-
Erlenmeyer flask deformity of the femurs is characteristic.
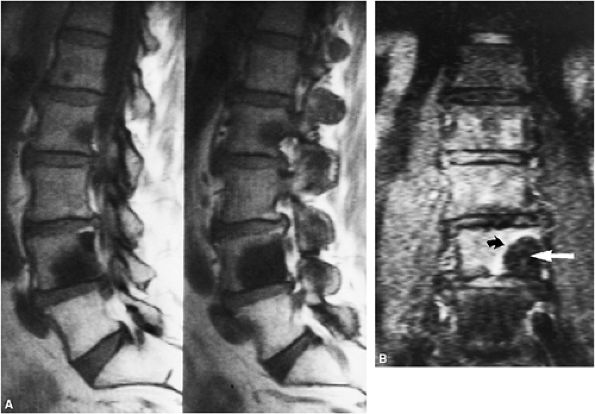 |
|
FIGURE 13.70 ● MR appearance of flare phenomenon. Two weeks after therapy, interval bone scans showed increased uptake (more than prior to surgery). (A) Sagittal T1-weighted images display hypointense osteoblastic metastases from a primary prostate carcinoma. (B) The corresponding coronal STIR image demonstrates a hypo-intense osteoblastic lesion (straight arrow) with a hyperintense rim (curved arrow) due to increased osteoblast activity and hyperemia.
|
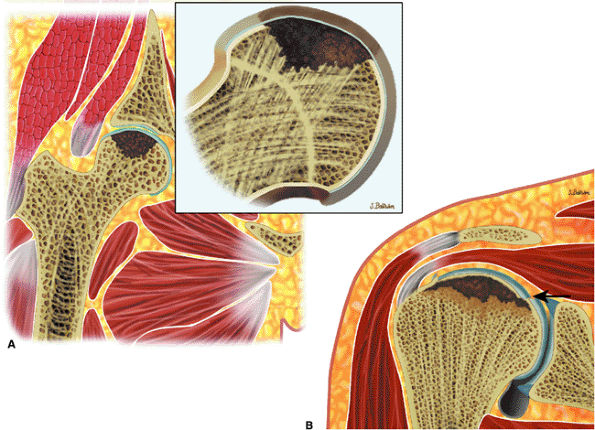 |
|
FIGURE 13.71 ● Avascular necrosis in Gaucher disease. (A) Coronal graphic illustration of the hip shows a subchondral marrow abnormality (in brown) from osteonecrosis of the femoral head. (B) Coronal graphic illustration of the shoulder demonstrates osteonecrosis with a pathologic fracture (arrow) of the humeral head.
|
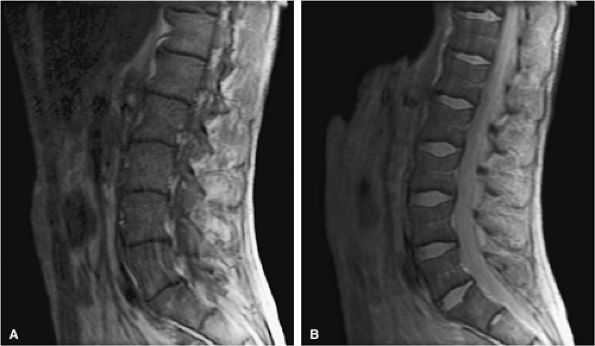 |
|
FIGURE 13.72 ● Marrow infiltration in Gaucher disease. (A) Sagittal T1-weighted image shows diffuse accumulation of glucocerebroside-laden cells, which demonstrate low signal intensity. (B) Decreased low-signal marrow infiltration is noted on the corresponding STIR image.
|
causes the characteristic Erlenmeyer flask deformity (Figs. 13.75 and 13.76). The mucopolysaccharidoses, which are an unrelated group of hereditary disorders characterized by dwarfism and a specific enzyme deficiency, demonstrate relative hyperintensity on STIR images.
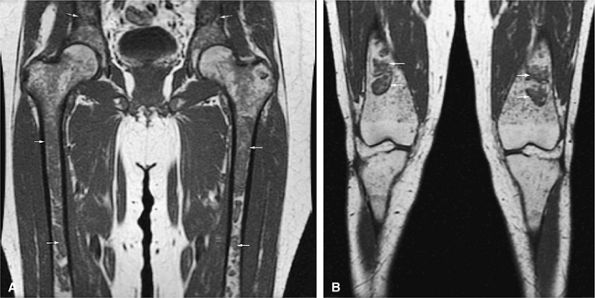 |
|
FIGURE 13.73 ● Accumulation of lipid in reticuloendothelial cells in Gaucher disease. Patchy low-signal-intensity marrow infiltration (arrows) can be seen on a coronal T1-weighted image of the pelvis and proximal femurs (A) and on a coronal T1-weighted image of the knees (B). There may be relative sparing of the epiphyses and apophyses until later stages of disease.
|
 |
|
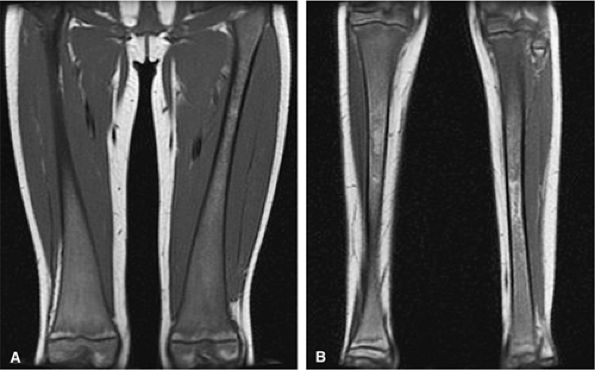
FIGURE 13.74 ● Gaucher disease involving the appendicular skeleton. Low-signal marrow infiltration is noted on a coronal image of the femurs (A) and lower legs (B). Extension into the epiphysis and distal skeleton is characteristic of advanced disease.
|
fat fractions correlate with the severity of the disease (Fig. 13.77).118 Displacement of normal marrow fat with Gaucher cells results in bulk T1 increases due to the higher T1 value of water compared with fat.119
 |
|
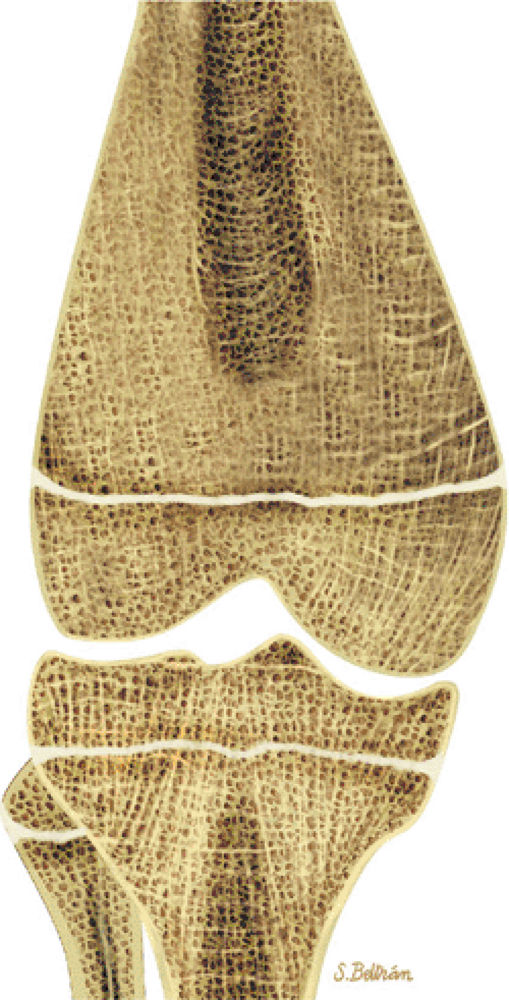
FIGURE 13.75 ● Coronal graphic illustration shows characteristic Erlenmeyer flask deformity of the distal femur.
|
 |
|
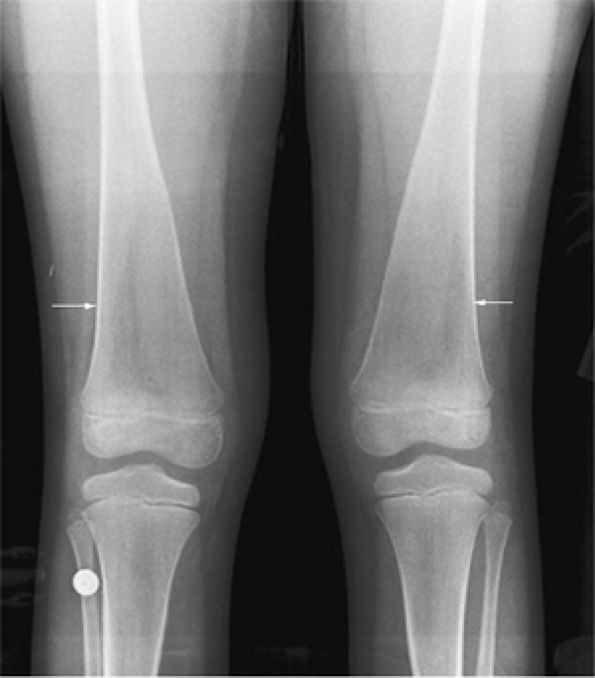
FIGURE 13.76 ● Undertubulation of the distal femurs causes characteristic Erlenmeyer flask deformity (arrows), as shown on an anteroposterior radiograph of the knees.
|
 |
|
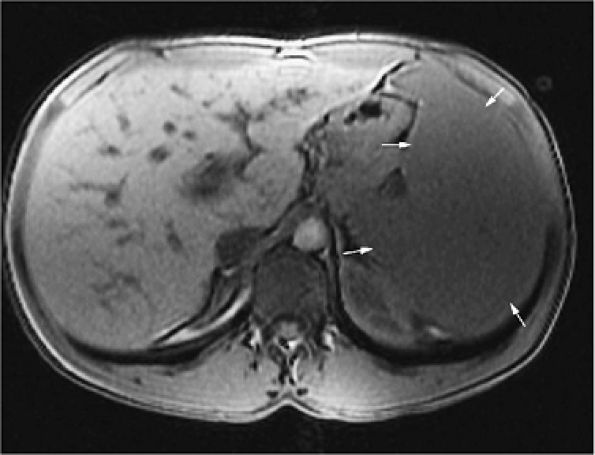
FIGURE 13.77 ● Splenomegaly (arrows) is shown on an axial T1-weighted image in a patient with Gaucher disease.
|
-
Increased iron stores cause decreased signal on T1- and T2-weighted images.
-
Be aware of normal variations of red marrow patterns and recognize them as normal.
-
Normal red marrow demonstrates T1 signal that is equal to or higher than muscle or disk.
-
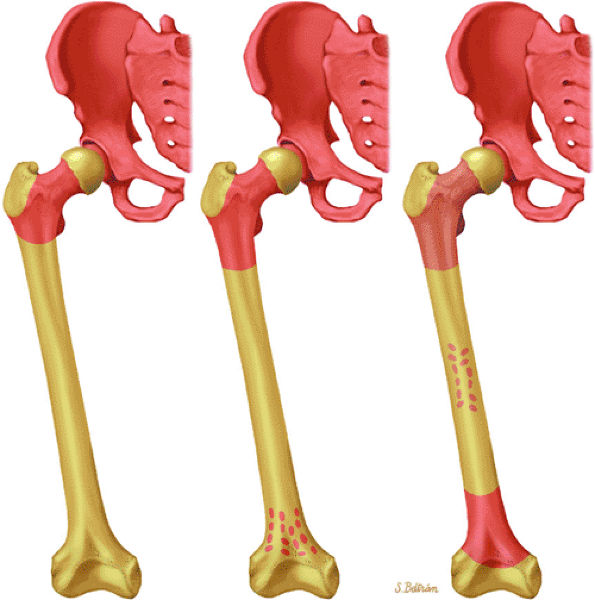
Marrow reconversion from yellow to red marrow occurs in the reverse order as does conversion from red to yellow marrow.
 |
|
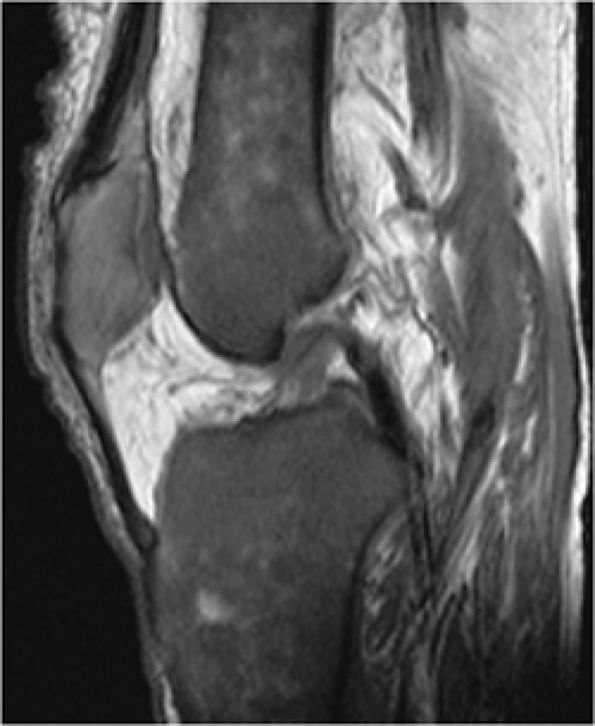
FIGURE 13.78 ● Iron deposition in hemochromatosis demonstrates diffuse low signal intensity on a sagittal T1-weighted image. This simulates the appearance of a gradient-refocused or STIR sequence.
|
in women is also associated with this pattern of marrow inhomogeneity.
 |
|
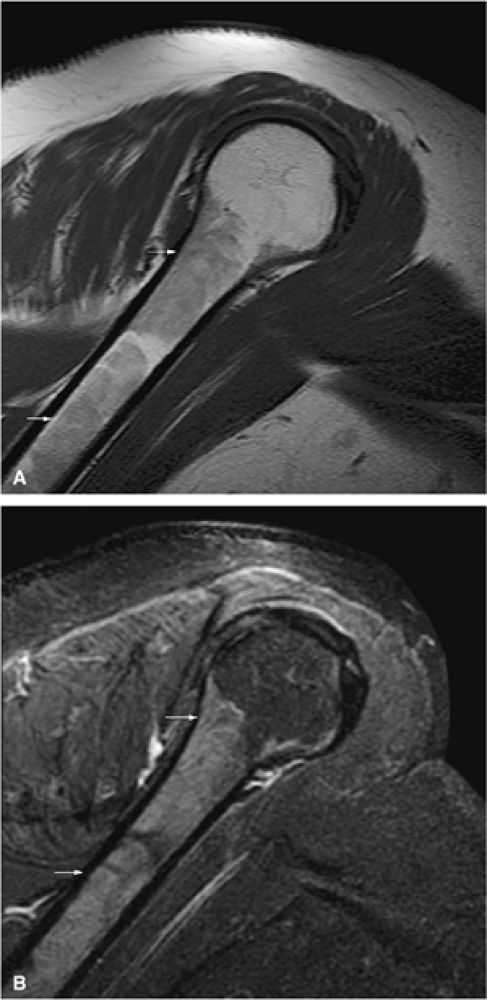
FIGURE 13.79 ● Red-yellow marrow. (A) Normal low-signal-intensity metadiaphyseal red marrow (arrows) is seen on a sagittal T1-weighted image. The epiphyseal regions demonstrate uniform yellow marrow signal intensity. (B) The red marrow is hyperintense on the corresponding sagittal STIR image (arrows). This finding of marrow inhomogeneity is considered a normal variant.
|
 |
|
FIGURE 13.80 ● Reconversion of yellow to red marrow due to increased demand for hematopoiesis. Yellow to red reconversion occurs in the reverse order as does conversion from red to yellow marrow.
|
-
Decreased marrow cellularity with an increase in fat
-
A reduction in both fat and hematopoietic cells with an increase in extracellular material rich in hyaluronic acid (serous atrophy). Serous atrophy is characterized by water-like signal intensity on MR images (i.e., decreased signal intensity on T1-weighted images and hyperintensity on T2-weighted images).130 Early fat conversion produces increased signal intensity on T1-weighted images.
-
Increased signal on T1-weighted images is due to hypoplastic marrow.
-
Marrow heterogeneity due to hematopoiesis can be seen during recovery.
aplastic anemia. The remainder of cases are attributed to exposure to drugs, chemicals, toxins, radiation, and severe viral infections. Uncommonly, congenital disorders such as Fanconi anemia are accompanied by a genetic predisposition to aplastic anemia. Although a mild form of aplastic anemia may be successfully treated with marrow-stimulating drugs such as androgens, the mainstay of therapy is bone marrow transplantation.132 Iatrogenically induced aplastic marrows are encountered in the course of aggressive chemotherapy in the treatment of acute leukemia or in preparation for bone marrow transplantation. Radiotherapy may result in focal aplastic marrow.
 |
|
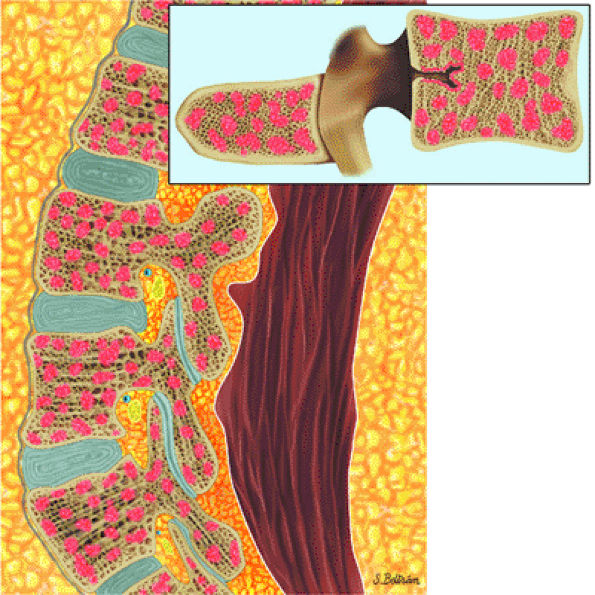
FIGURE 13.81 ● Aplastic anemia following therapy. Sagittal graphic illustration shows heterogeneous marrow with islands of hematopoiesis (in red).
|
-
Expansion of marrow cavities is due to an increased demand for hematopoiesis.
-
Vascular occlusion leads to bone infarcts.
-
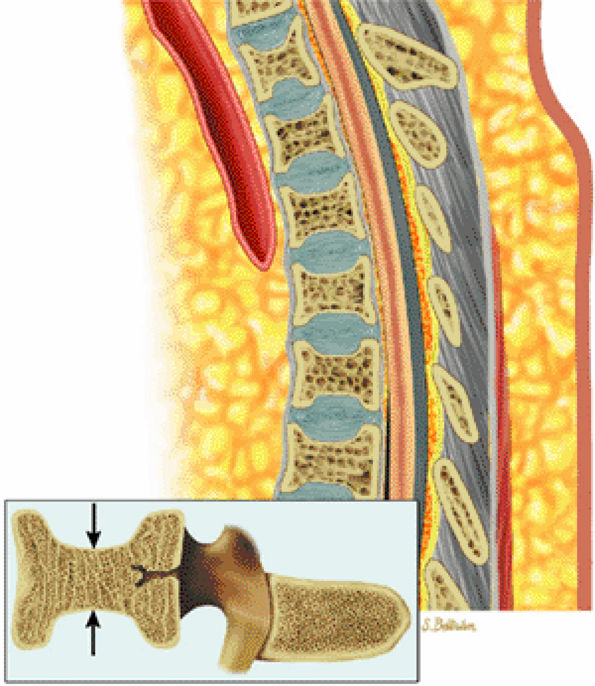
H vertebrae in patients with sickle cell anemia are due to infarcts.
 |
|
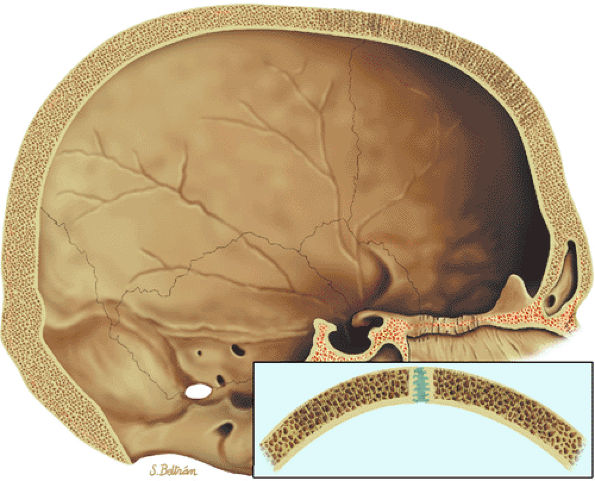
FIGURE 13.82 ● Sagittal graphic illustration shows expansion of the marrow spaces of the skull in sickle cell anemia.
|
 |
|
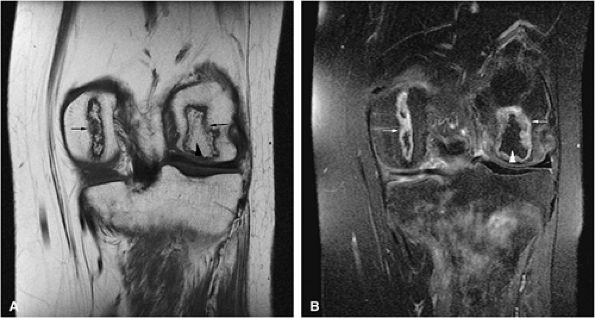
FIGURE 13.83 ● Bone marrow infarcts in a patient with sickle cell anemia. (A) On a coronal T1-weighted image through the posterior aspect of the knee, areas of osteonecrosis show low-signal serpentine lines (arrows). Fat signal intensity within the infarcted segment is demonstrated (arrowhead). (B) On a corresponding coronal STIR image, the serpentine lines are hyperintense (arrows) while the marrow within the area of osteonecrosis is dark, corresponding to fatty marrow (arrowhead).
|
 |
|
FIGURE 13.84 ● H vertebrae in sickle cell anemia. Bone marrow ischemia of the central vertebral body leads to central squared-off endplate depressions (arrows).
|
 |
|
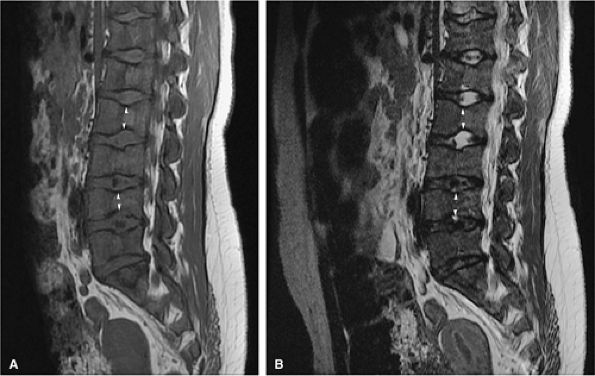
FIGURE 13.85 ● (A) Diffuse low-signal hematopoietic marrow is noted throughout the lumbar spine on a sagittal T1-weighted image in a patient with sickle cell anemia. Bone marrow infarcts have led to endplate depression of multiple vertebral bodies (H vertebrae) (arrowheads). (B) On a fat-suppressed T2-weighted fast spin-echo image, endplate depression of the vertebral bodies is seen (arrowheads).
|
-
Enlarged bone with cortical and trabecular thickening is characteristic of Paget—s disease.
-
STIR images are most sensitive in evaluating the extent of hyperemic marrow in transient osteoporosis and reflex sympathetic dystrophy.
 |
|
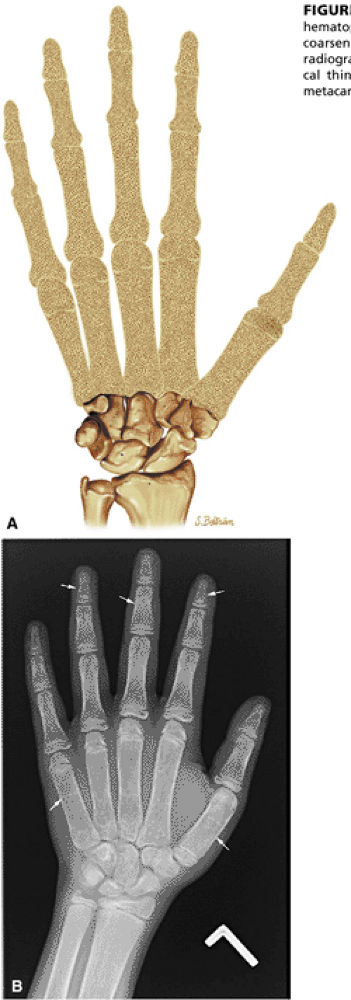
FIGURE 13.86 ● Expansion of marrow spaces due to increased demand in hematopoiesis. (A) Coronal graphic illustration shows expansion of marrow spaces with coarsened trabeculae and cortical thinning involving the digits. (B) Anteroposterior radiograph of the hand shows generalized osteopenia, coarsened trabeculae, and cortical thinning (arrows). Widening of the medullary cavity results in squaring of the metacarpals.
|
 |
|
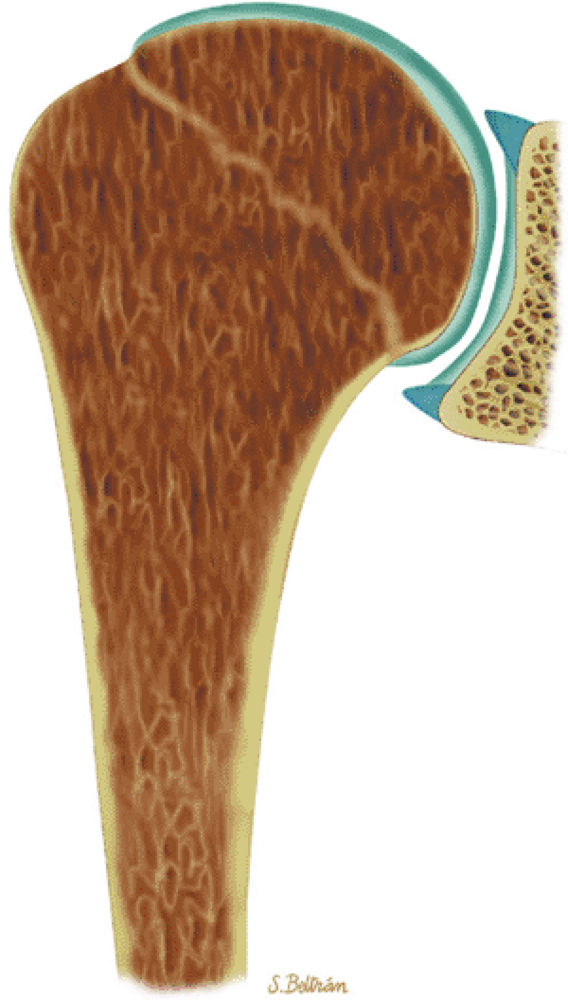
FIGURE 13.87 ● Thalassemia with coarsened trabeculae and expansion of marrow spaces extending to the epiphysis is demonstrated on a coronal graphic illustration of the shoulder.
|
 |
|
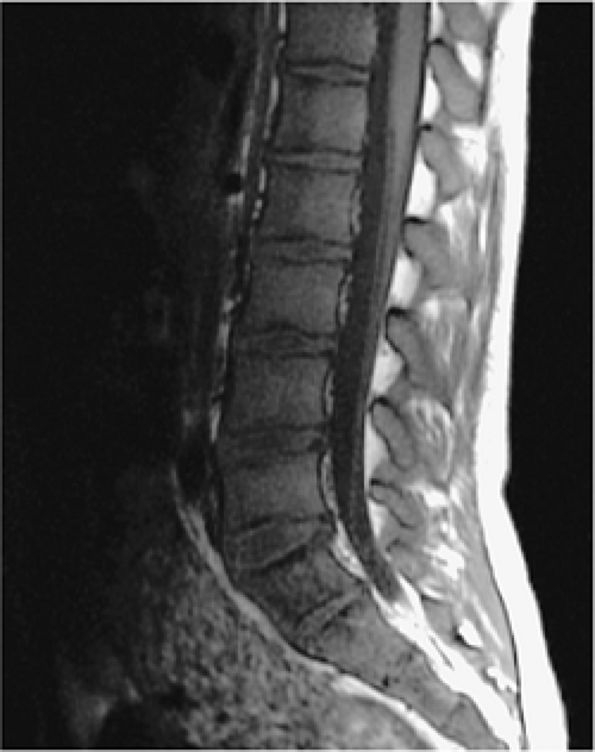
FIGURE 13.88 ● Yellow to red marrow conversion in a patient with thalassemia shows low-signal-intensity hematopoietic marrow on a sagittal T1-weighted image.
|
 |
|
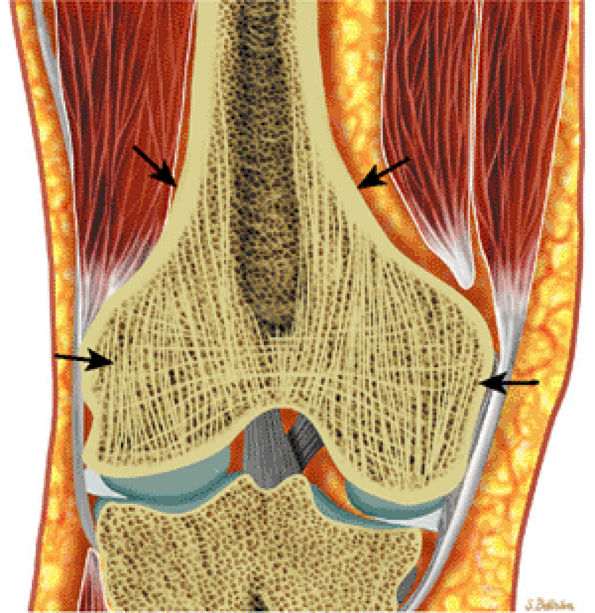
FIGURE 13.89 ● Paget—s disease of the femur. Coronal graphic illustration shows enlargement of the distal femur with cortical thickening and coarsened trabeculae (arrows).
|
 |
|
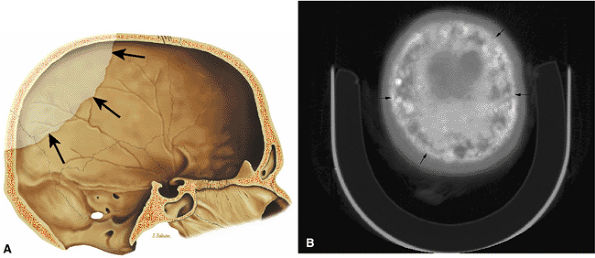
FIGURE 13.90 ● Paget—s disease of the skull. (A) Sagittal graphic illustration demonstrates an osteolytic lesion (arrows) involving the calvarium, consistent with osteoporosis circumscripta. (B) Axial CT image shows diploic widening and mixed lytic and sclerotic changes (cotton-wool appearance) (arrows) in the late stage of Paget—s disease.
|
 |
|
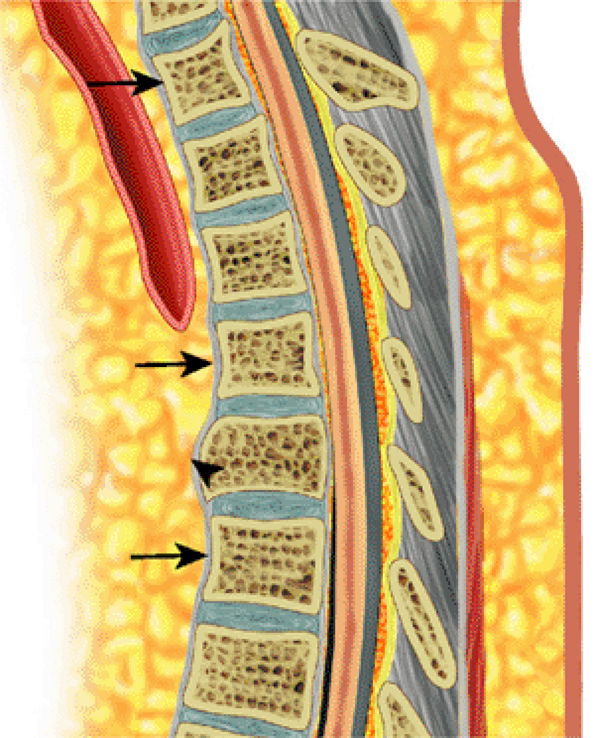
FIGURE 13.91 ● Paget—s disease of the spine. Sagittal graphic illustration shows coarse trabecular pattern (arrows) and expansion of a thoracic vertebral body (arrowhead).
|
 |
|
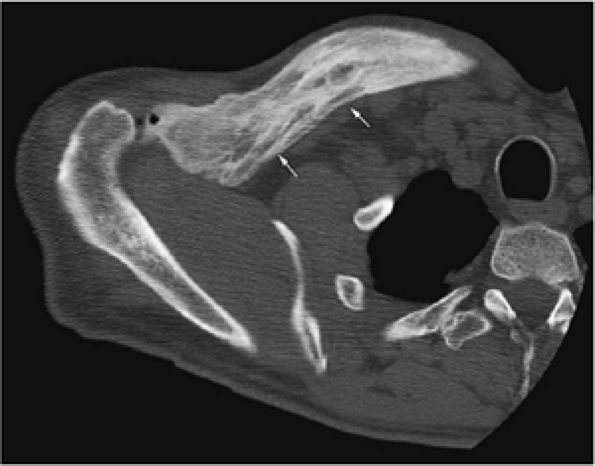
FIGURE 13.92 ● Paget—s disease of the clavicle. Axial CT image shows enlargement of the clavicle with increased sclerosis and cortical thickening (arrows).
|
 |
|
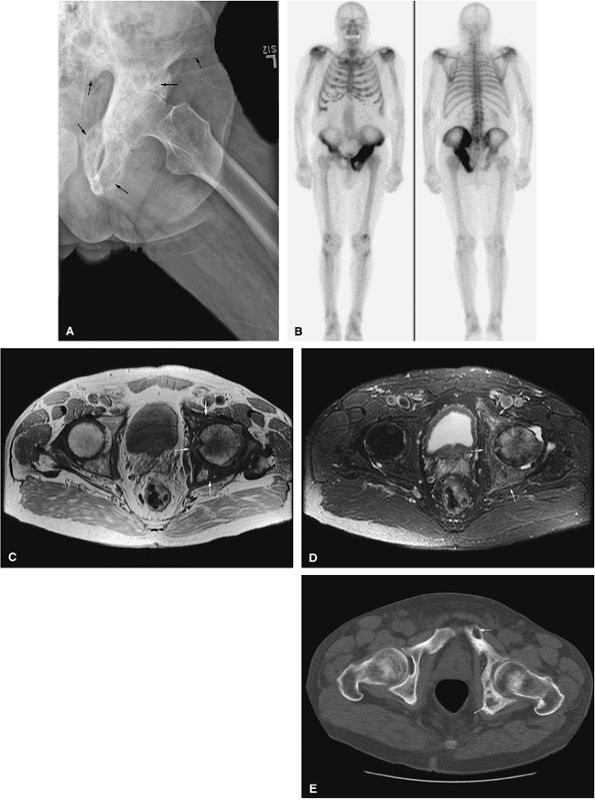
FIGURE 13.93 ● Paget—s disease of the left hemipelvis (arrows). (A) Anteroposterior radiograph shows coarsened trabecular pattern involving the left hemipelvis (arrows). (B) Markedly increased radiotracer uptake of the left hemipelvis is seen on the whole-body bone scan. (C) On an axial proton density-weighted image, low-signal coarse trabecular bone intermixed with high-signal-intensity yellow marrow is noted (arrows). (D) Marrow involvement is hyperintense on an axial STIR image (arrows). (E) Axial CT image shows a coarsened trabecular pattern with osteolytic lesions involving the left hemipelvis (arrows).
|
 |
|
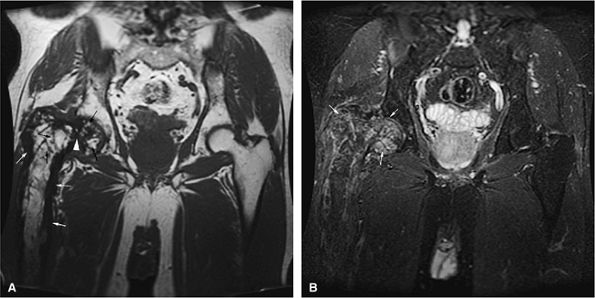
FIGURE 13.94 ● (A) Coronal T1-weighted image shows trabecular thickening in Paget—s disease as areas of low signal intensity (black arrows) intermixed with high-signal-intensity yellow marrow, creating an inhomogeneous appearance in the proximal femur. Cortical thickening is present (white arrows). Weakened bone has led to a pathologic fracture of the femoral neck (white arrowhead). (B) Marrow involvement is hyperintense on the corresponding coronal STIR image (arrows).
|
 |
|
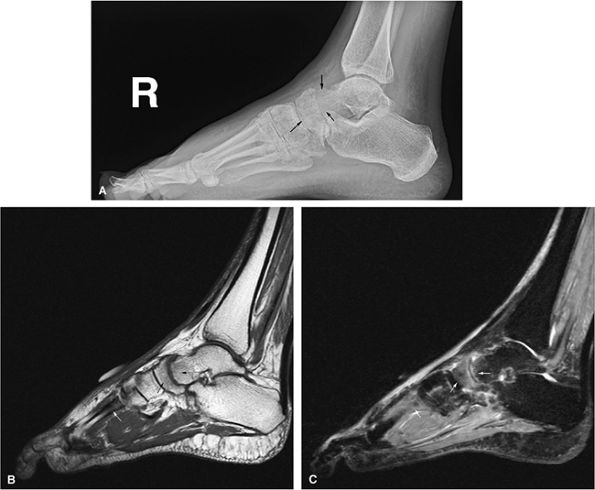
FIGURE 13.95 ● Reflex sympathetic dystrophy (Sudeck atrophy). (A) Lateral radiograph shows demineralization of the talus and navicula (arrows). (B) Sagittal T1-weighted sagittal image shows subtle subarticular low-signal-intensity marrow of the talus and navicula (black arrows). Low-signal-intensity marrow of a metatarsal is also seen (white arrow). (C) Corresponding sagittal STIR image shows marrow edema (arrows) with hyperintense signal intensity.
|
 |
|
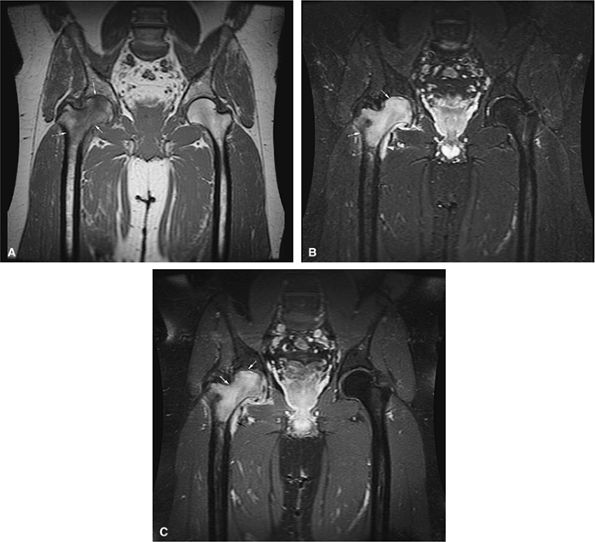
FIGURE 13.96 ● Transient osteoporosis of the hip. (A) Coronal T1-weighted image shows low signal intensity in the right femoral head and neck (arrows) without an osteonecrotic focus. (B) On the corresponding coronal STIR image, there is increased signal intensity in the right femoral head and neck (arrows). A small joint effusion is present (arrowhead). The acetabulum is normal in signal intensity. (C) Coronal fat-suppressed T1-weighted image following the intravenous administration of gadolinium shows diffuse enhancement of the femoral head and neck (white arrows) and the joint effusion (black arrow).
|
-
Patients with AIDS are at increased risk for infections and neoplasms, especially lymphoma.
-
Complications of antiviral therapy include lipodystrophy.
 |
|
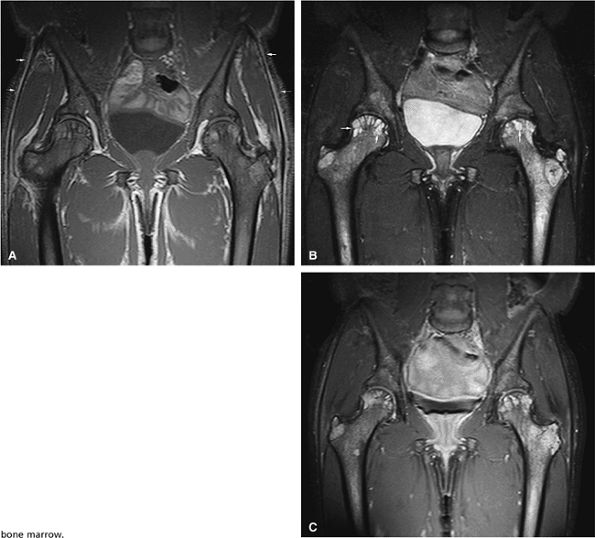
FIGURE 13.97 ● Lipodystrophy in an AIDS patient receiving antiviral therapy. (A) Diffuse low-signal marrow of the pelvis due to reduced bone marrow fat is shown on a coronal T1-weighted image. Note the lack of subcutaneous fat (arrows), a common finding in patients with AIDS-related lipodystrophy. (B) On a coronal STIR image, the abnormal marrow is hyperintense. Note the subchondral cysts from osteoarthritis (arrows). (C) Coronal fat-suppressed T1-weighted image following the intravenous administration of gadolinium shows diffuse enhancement of the bone marrow.
|

