
Editors: Berquist, Thomas H.
Title: Musculoskeletal Imaging Companion, 2nd Edition
Copyright ©2007 Lippincott Williams & Wilkins
> Table of Contents > Chapter 10 – Musculoskeletal Neoplasms
Chapter 10
Musculoskeletal Neoplasms
Thomas H. Berquist
Mark J. Kransdorf
Bone Tumors/Tumorlike Conditions: Imaging Approaches
Key Facts
-
Imaging studies are essential for detecting, characterizing, and staging bone lesions.
-
Radiographs, computed tomography (CT),
magnetic resonance imaging (MRI), and radionuclide scans all play a
role. Angiography is useful for evaluating tumor vascularity and for
preoperative embolization. -
Effectiveness of imaging studies for evaluating features of bone tumors is as follows:
Radiographs CT MRI Radionuclide Scans Lesion morphology Thin cortical bone Lesion extent Early detection in marrow and soft tissues Site (cortical, marrow, diaphysis, metaphysis, epiphysis) Bone destruction or production Joint space involvement Skip lesions Bone production or destruction Periosteal response Marrow edema patterns Metastasis Periosteal response Calcifications/matrix Cortical destruction Soft tissue calcification or ossifications Trabecular destruction
P.627
Suggested Reading
Greenfield GB, Arrington JA. Imaging of bone tumors: A multimodality approach. Philadelphia: JB Lippincott; 1995.
P.628
Bone Tumors/Tumorlike Conditions: Radiographic Features
Key Facts
-
Routine radiographs provide vital and
fundamental information regarding tumors and tumorlike conditions of
bone. Key features are as follows:Patterns of bone destruction:-
Geographic: least aggressive. Margins may be sclerotic, well defined without sclerosis, or ill defined.
-
Moth-eaten: more aggressive, less well defined. Longer zone of transition. Seen with malignant lesions and osteomyelitis.
-
Permeative: most aggressive with more
rapid destruction. Margins not defined. Seen with Ewing sarcoma,
aggressive malignancies, and infections.
-
-
Bone formation
-
Matrix—calcification or ossification
-
Trabeculation—seen with giant cell tumors, chondromyxoid fibroma, aneurysmal bone cyst, hemangioma, nonossifying fibroma
-
Cortical penetration
-
Periosteal response
-
Soft tissue mass
-
Distribution:
-
Central, eccentric, cortical, juxtacortical
-
Diaphyseal, metaphyseal, epiphyseal
-
Skeletal location (e.g., tibia and calcaneus)
-
P.629
 |
|
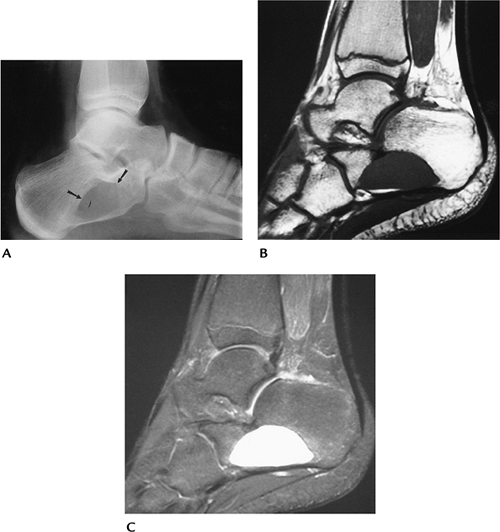
FIGURE 10-1 Patterns of bone destruction—geographic. (A) Lateral radiograph of the calcaneus showing a well-defined geographic lytic lesion (arrows). T1-weighted (B) and T2-weighted (C) magnetic resonance (MR) images showing homogeneous fluid signal caused by a benign unicameral bone cyst.
|
P.630
 |
|
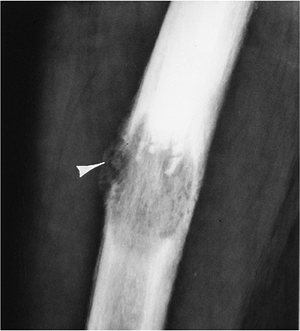
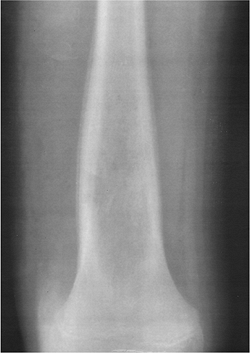
FIGURE 10-2
Moth-eaten. Lateral view of the femur showing a destructive lesion with poorly defined margins and a pathologic fracture anteriorly (arrowhead) as the result of metastasis. |
P.631
 |
|
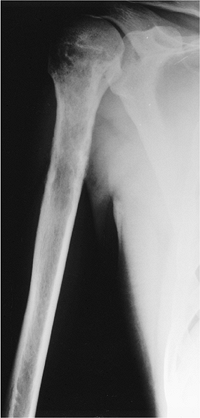
FIGURE 10-3 Permeative. Poorly defined lytic lesion in the proximal humerus with permeative cortical changes attributable to Ewing sarcoma.
|
P.632
 |
|
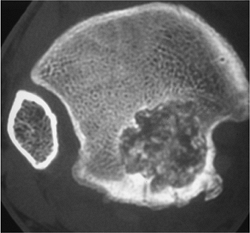
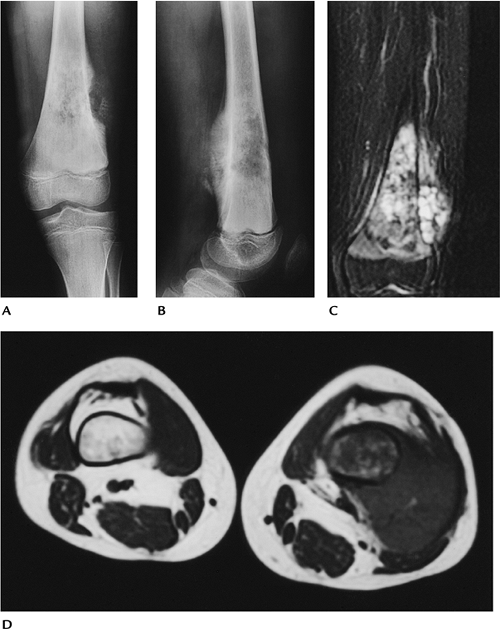
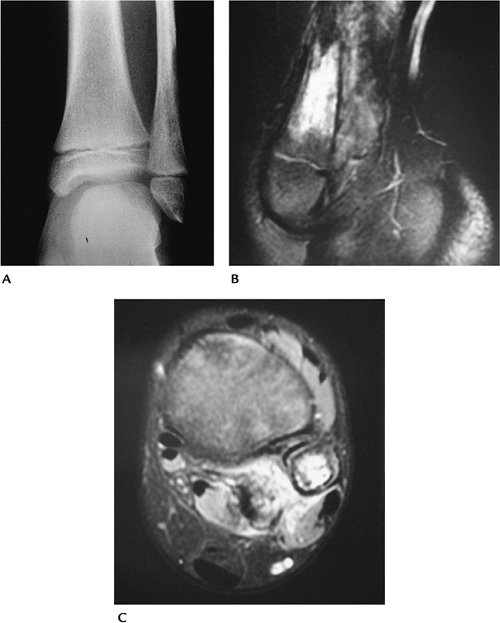
FIGURE 10-4
Matrix calcifications. Axial CT image of the distal tibial epiphysis showing a well-defined geographic lesion with calcifications. Appearance and location characteristic of chondroblastoma. |
P.633
 |
|
FIGURE 10-5 Periosteal response. Osteogenic sarcoma with bone sclerosis and cortical break: a triangular elevation (arrow) (Codman triangle) seen with aggressive lesions.
|
Suggested Reading
Greenspan A, Remagen W. Differential diagnosis of tumors and tumorlike lesion of bone and joints. Philadelphia: Lippincott-Raven; 1998:1–24.
P.634
Bone Tumors/Tumorlike Conditions: Magnetic Resonance Imaging Protocols
Key Facts
-
MRI of bone tumors is approached somewhat differently compared with other indications.
-
The field of view needs to include a larger area to evaluate adjacent joints and to avoid overlooking skip lesions.
-
Image planes, especially for long bones, should be selected to demonstrate the osseous structure on one image.
-
Coil selected should be large enough to cover the needed anatomic area.
-
Pulse sequences typically include axial
T1- and T2-weighted spin-echo MR images. We prefer conventional T2
images to turbo T2 or fat-suppressed turbo T2 images. -
Contrast enhancement is used routinely.
P.635
 |
|
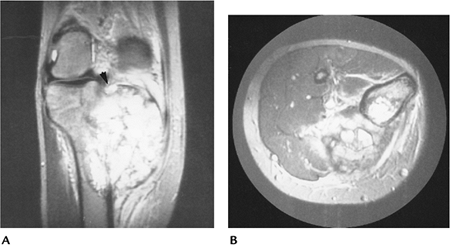
FIGURE 10-6
Patient with a knee sarcoma and midfemoral skip lesion. The knee coil would be optimal for knee imaging, but the skip lesion would not be identified unless the larger body coil was used to evaluate the entire femur. |
P.636
 |
|
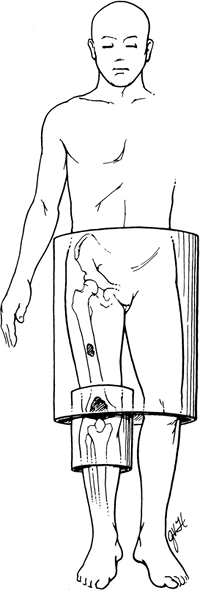
FIGURE 10-7 Optimal image planes. (A,B)
Sarcoma in the proximal femur with level of excision for limb salvage marked on coronal images. At least 5 to 7 cm of normal marrow usually is included in the resection. (C) Optimal sagittal image in a different patient showing the entire area of interest on one image. Line marks planned resection. |
P.637
Suggested Reading
Kransdorf MJ, Berquist TH. Musculoskeletal neoplasms. In: Berquist TH, ed. MRI of the musculoskeletal system, 5th ed. Philadelphia: Lippincott Williams & Wilkins; 2006:802–915.
P.638
Bone Tumors/Tumorlike Conditions: Osteoid Osteoma
Key Facts
-
Clinical:
-
Osteoid osteoma is a relatively common
lesion accounting for 12% of benign bone tumors. Patients present with
pain, worse at night, often relieved by anti-inflammatory medications
(75%).
-
-
Age: 5 to 35 years, peak second decade
-
Sex: Males outnumber females 3:1.
-
Common locations: majority in lower extremity; proximal femur, femoral neck
-
Three types of osteoid osteoma:
-
Cortical: most common. Fusiform cortical thickening with a lucent nidus. May contain central calcification.
-
Cancellous: femoral neck and small bones of the hand, foot, and posterior elements of the spine.
-
Subperiosteal: least common. Arise in soft tissue adjacent to bone.
-
-
Imaging features:
-
Radiographic features: small round lucent
area, usually in cortex with surrounding sclerosis. May have central
calcification or ossification. -
CT: technique of choice for detection and characterization.
-
MRI: small focal lesion with bone and
soft tissue edema on T2-weighted or short T1 inversion recovery (STIR)
images. Subtle lesions enhance with dynamic contrast studies.
-
-
Differential diagnosis:
-
Brodie abscess
-
Osteoblastoma
-
Stress fracture
-
-
Treatment: complete resection of nidus; percutaneous radiofrequency ablation.
P.639
 |
|
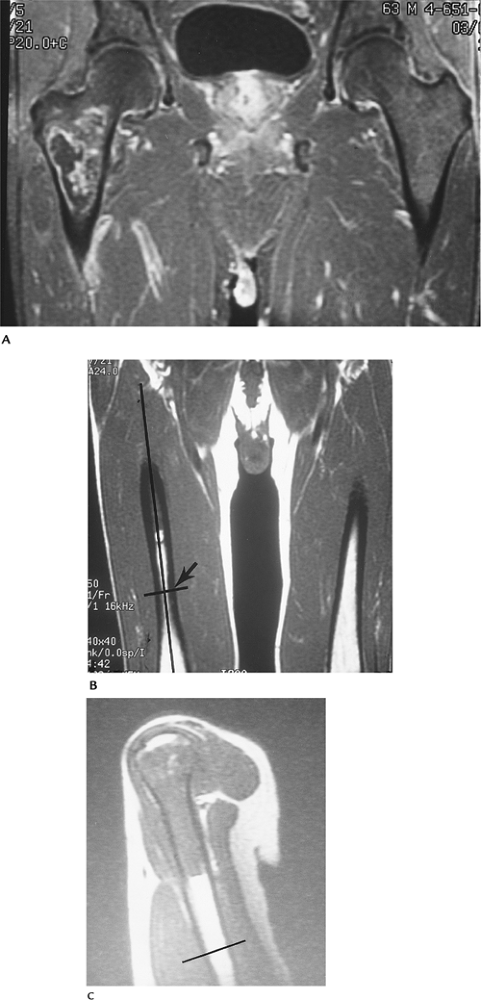
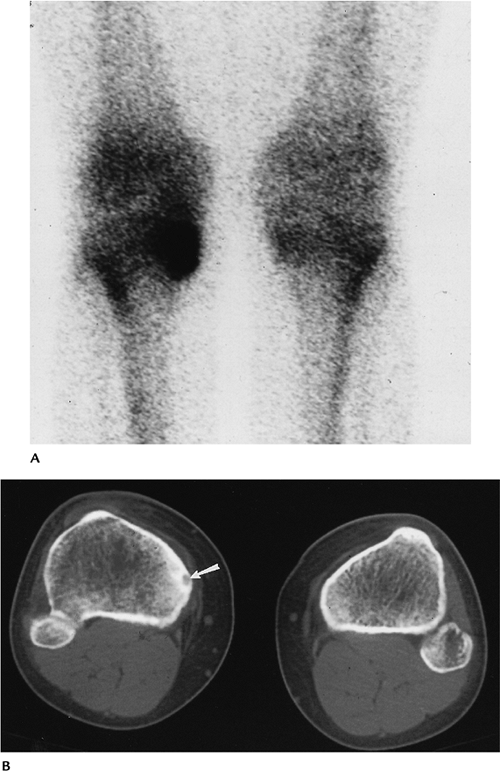
FIGURE 10-8 Intracapsular osteoid osteoma. Coronal T1-weighted (A) and fluid-sensitive (B) weighted images showing a large area of signal abnormality in the right femoral neck. (C) Axial T2-weighted image shows fluid in the joint with a small high signal intensity nidus (arrowhead) and surrounding edema. (D) Axial CT image demonstrates the lucent nidus (arrowhead) more clearly.
|
P.640
 |
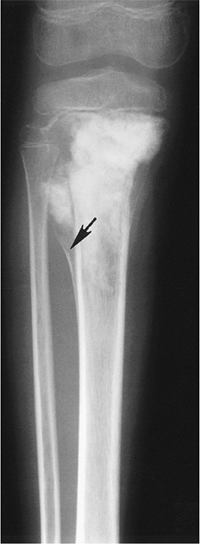
|
FIGURE 10-9 Tibial osteoid osteoma. (A) Posterior image from a bone scan showing increased tracer in the medial tibia. (B) CT scan clearly defines the nidus (arrow) and surrounding bone sclerosis.
|
P.641
Suggested Reading
Assorin J, Richardi G, Railhec JJ, et al. Osteoid osteoma. MR imaging versus CT. Radiology 1994;191:217–233.
Greenspan A. Benign bone forming lesions: Osteoma, osteoid osteoma, osteoblastoma. Skel Radiol 1993;22:485–500.
Liu PT, Chivers FS, Roberts CC, et al. Imaging of osteoid osteoma by dynamic gadolinium-enhanced imaging. Radiology 2003;277:691–700.
P.642
Bone Tumors/Tumorlike Conditions: Osteoblastoma
Key Facts
-
Clinical:
-
Osteoblastomas account for 3.5% of benign bone tumors. Patients present with chronic local pain.
-
-
Age: any age, most common second decade
-
Sex: Males outnumber females 3:1.
-
Common locations: vertebrae (42.5%), posterior elements most commonly involved
-
Imaging features:
-
Radiographic features: May be similar to
osteoid osteoma, but larger (>1.5 cm). May have malignant
appearance. Bone expanded; 55% have an ossified matrix. -
CT: cortical expansion, ossified matrix
-
MRI: variable, not well defined
-
-
Differential diagnosis:
-
Osteoid osteoma
-
Aneurysmal bone cyst
-
Osteosarcoma
-
-
Treatment: en bloc resection, bone grafting
P.643
 |
|
FIGURE 10-10 Osteoblastoma. Sagittal (A) and axial (B)
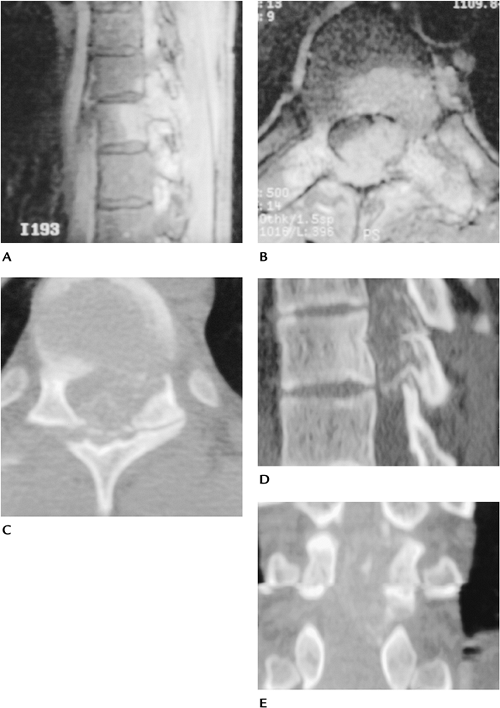
contrast-enhanced T1-weighted images showing a large enhancing lesion that appears to involve the body and neural arch with spinal cord compression. Axial (C), sagittal (D), and coronal (E) CT images demonstrate matrix calcification or ossification with a thin cortical rim characteristic of osteoblastoma. |
P.644
Suggested Reading
McLeod RA, Dahlin DC, Beabout JW. The spectrum of osteoblastoma. AJR Am J Roentgenol 1976;126:321–335.
Unni KK. Dahlin’s bone tumors: General aspects and data on 11,087 cases. Philadelphia: Lippincott-Raven; 1996:131–142.
P.645
Bone Tumors/Tumorlike Conditions: Osteochondroma
Key Facts
-
Clinical:
-
Osteochondromas are the most common
accounting for 35% of benign skeletal neoplasms. Patients present with
a palpable mass that may be painful.
-
-
Age: 5 to 50 years, peak second decade
-
Sex: Males outnumber females 2:1.
-
Common locations: distal femur, proximal tibia, proximal humerus
-
Imaging features:
-
Radiographic features: bony projection with contiguous marrow and cortex from bone of origin
-
CT: similar to radiograph. Cartilaginous cap more easily appreciated (normal cap thickness <1.5–2 cm).
-
MRI: cartilage cap low intensity on
T1-weighted and high intensity on T2-weighted sequences. Other features
similar to radiographs.
-
-
Differential diagnosis:
-
Usually characteristic
-
Myositis ossificans
-
-
Treatment: Observe unless symptoms or cosmetic deformity, then resect.
P.646
 |
|
FIGURE 10-11 Anteroposterior (AP) (A) and lateral (B) radiographs of an osteochondroma. Coronal T1-weighted (C) and axial T2-weighted (D) images showing marrow extending into the lesion (arrow) and a thin high signal intensity cartilaginous cap (arrowheads).
|
P.647
 |
|
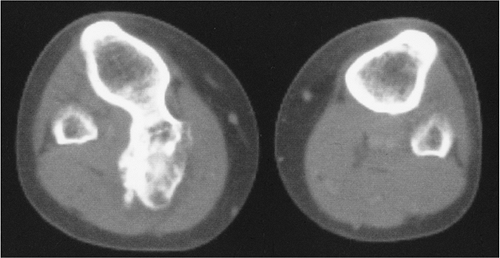
FIGURE 10-12 Axial CT of an osteochondroma arising from the upper tibia.
|
Suggested Reading
Unni KK. Dahlin’s bone tumors: General aspects and data on 11,087 cases, 5th ed. Philadelphia: Lippincott-Raven; 1996:11–24, 121–130, 355–432.
P.648
Bone Tumors/Tumorlike Conditions: Enchondroma
Key Facts
-
Clinical:
-
Enchondromas account for 13.4% of benign
bone tumors. Most are asymptomatic. If painful, low-grade
chondrosarcoma should be excluded. Chondrosarcomas have more intense
uptake on radionuclide scans and typically erode two thirds of the
cortical thickness. There may also be periosteal reaction and a soft
tissue mass.
-
-
Age: all age groups, 55% in the second through fourth decades
-
Sex: no sex predilection
-
Common locations: small bones of hand and feet (50%) with 87% in the hand, proximal femur, and humerus
-
Imaging features:
-
Radiographic features: medullary with sharp margins. Calcification common. May be multiple.
-
CT: well-defined lesion with central calcified matrix. Cortical erosion easily measured.
-
MRI: lobulated low intensity on
T1-weighted and high intensity on T2-weighted images. Useful for
differentiating enchondroma from chondrosarcoma. Mineralized areas show
decreased signal intensity on all pulse sequences.
-
-
Differential diagnosis:
-
Bone infarct
-
Chondrosarcoma
-
-
Treatment: Observe. Curettage and bone graft if symptomatic.
P.649
P.650
 |
|
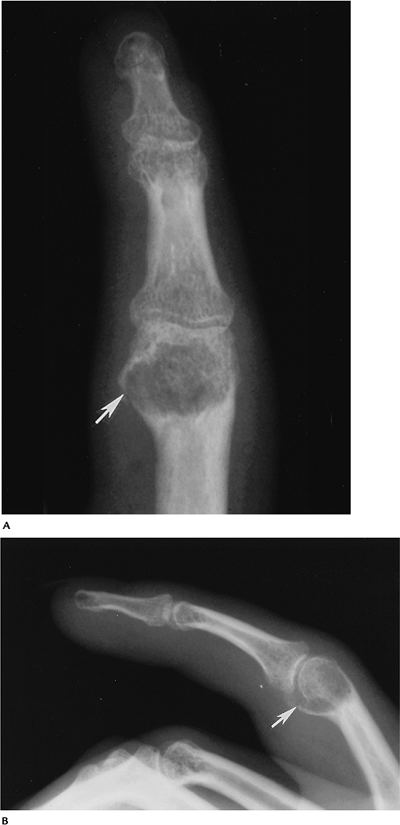
FIGURE 10-13 AP (A) and lateral (B) radiographs of a phalangeal enchondroma. There is cortical expansion and a pathologic fracture (arrow).
|
P.651
 |
|
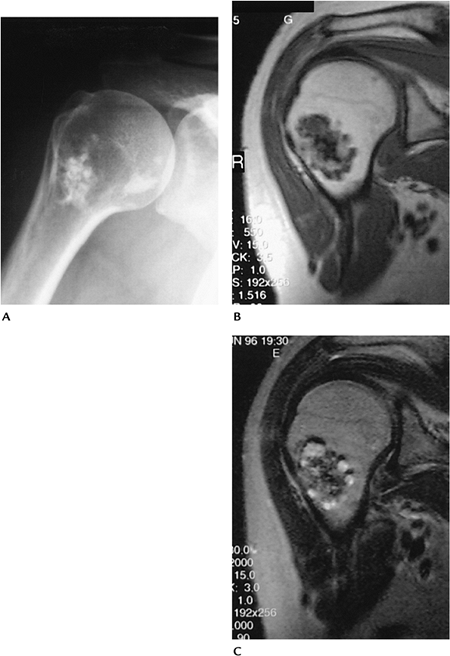
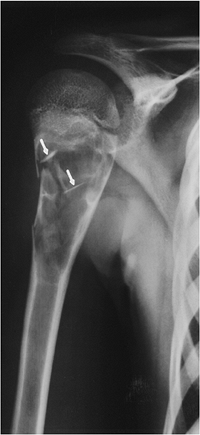
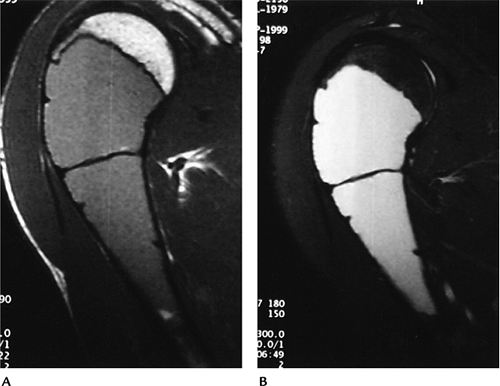
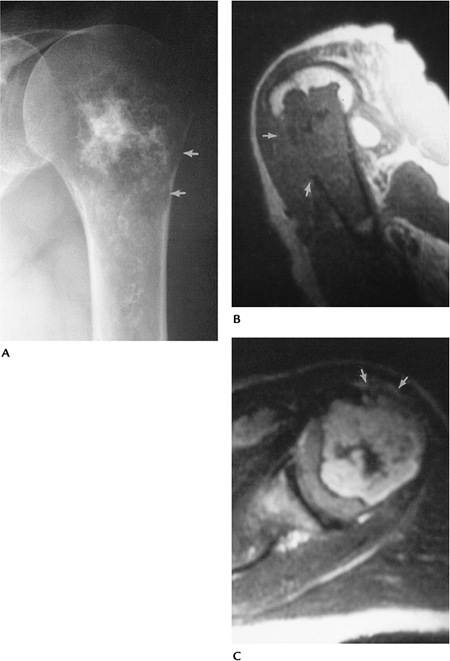
FIGURE 10-14 Enchondroma in a 52-year-old woman. (A)
Routine radiograph of the shoulder showing a focus of calcifications in the marrow of the humeral neck with no endosteal scalloping. Coronal T1-weighted (B) and T2-weighted (C) MR images showing areas of low and high intensity in the enchondroma as the result of calcifications. There is no marrow edema, cortical destruction, or soft tissue mass. |
Suggested Reading
Murphy MD, Flemming DJ, Boyea SR, et al. Enchondroma vs. chondrosarcoma in the appendicular skeleton: Differentiating features. Radiographics 1998;18:1213–1237.
P.652
Bone Tumors/Tumorlike Conditions: Chondroblastoma
Key Facts
-
Clinical:
-
Patients present with chronic local pain.
-
-
Age: 90% occur from 5 to 25 years of age, approximately 70% in second decade.
-
Sex: Males outnumber females 2–3:1.
-
Common locations: epiphyseal with 40% in the knee and 16% in the proximal humerus
-
Imaging features:
-
Radiographic features: epiphyseal location. Sharp margins with sclerotic rim. Calcification in approximately 50% to 60%.
-
CT: well-defined lesion with sclerotic margins and, frequently, central calcification
-
MRI: well-defined low-intensity lesion on
T1-weighted and variably high signal intensity on T2-weighted
sequences, with extensive surrounding edema in the majority of cases
-
-
Differential diagnosis:
-
Giant cell tumor
-
Avascular necrosis
-
Clear cell chondrosarcoma
-
-
Treatment: curettage and bone grafting
P.653
 |
|
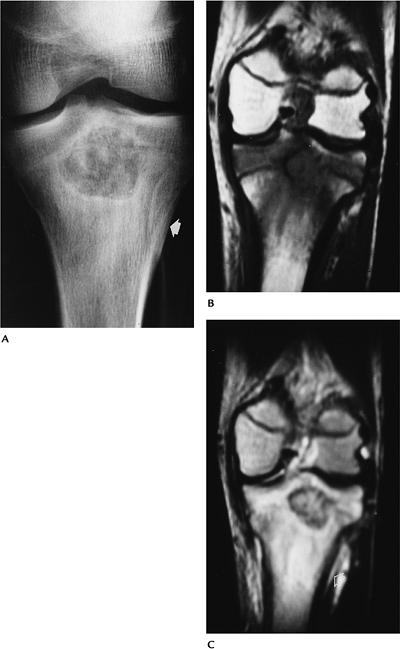
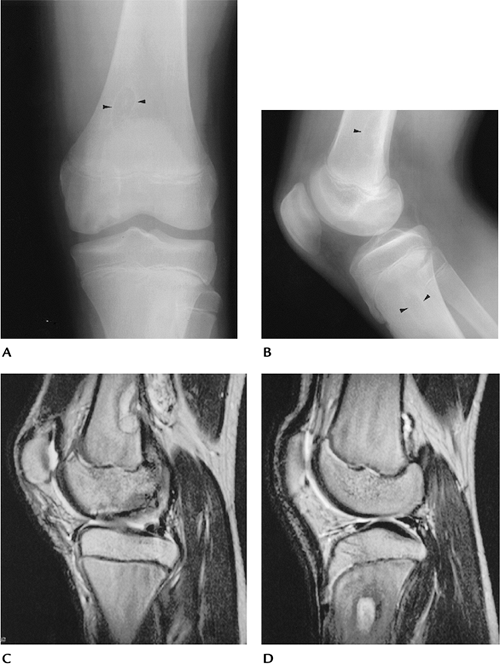
FIGURE 10-15 Chondroblastoma. (A)
AP radiograph demonstrates a proximal tibial lesion with sclerotic margins and calcifications. There is subtle periosteal reaction (arrow). Coronal T1- (B) and T2-weighted (C) images demonstrate a well-defined lesion with marrow edema pattern. |
P.654
Suggested Reading
Unni KK. Dahlin’s bone tumors: General aspects and data on 11,087 cases. Philadelphia: Lippincott-Raven; 1996:47–57.
Weatherall PT, Moole GE, Mendelsohn DB, et al. Chondroblastoma: Classic and confusing appearance at MR. Radiology 1994;190:467–474.
P.655
Bone Tumors/Tumorlike Conditions: Chondromyxoid Fibroma
Key Facts
-
Clinical:
-
Patients present with local pain and swelling.
-
-
Age: 5 to 50 years, most common (55%) in the second and third decades
-
Sex: slightly more common in males
-
Common locations: metaphysis of the knee and distal tibia
-
Imaging features:
-
Radiographic features: eccentric
metaphyseal lesion with well-defined sclerotic margins. Calcifications
seen in 12%, more common in those aged more than 40 years. -
CT: eccentric metaphyseal lesion with well-defined sclerotic margins. Calcifications easily appreciated
-
MRI: well-defined lesion with uniform low intensity on T1-weighted and high or intermediate intensity on T2-weighted sequences
-
-
Differential diagnosis:
-
Fibrous defect
-
Fibrous dysplasia
-
Chondroblastoma
-
Aneurysmal bone cyst
-
-
Treatment: curettage and bone grafting
P.656
 |
|
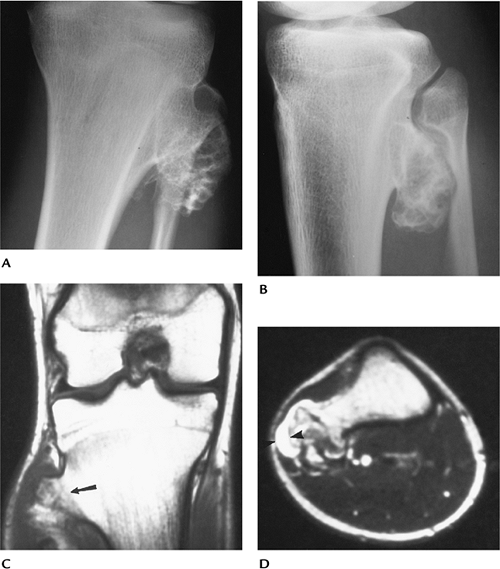
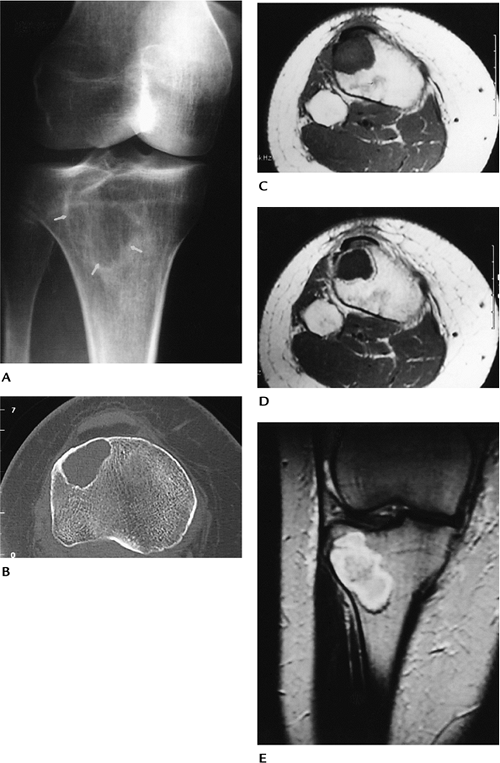
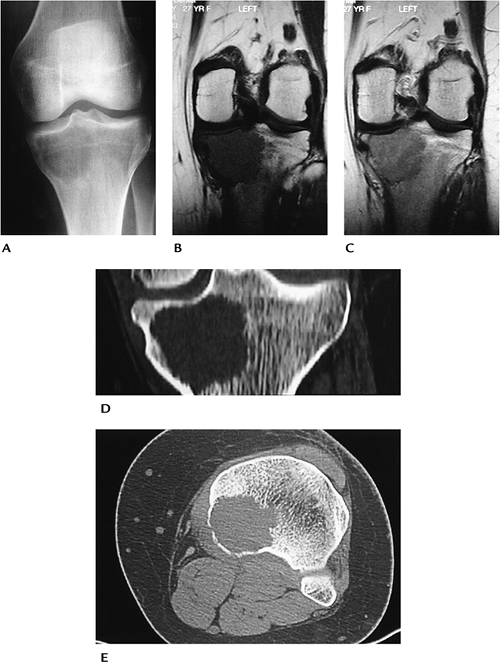
FIGURE 10-16 Chondromyxoid fibroma in a 45-year-old woman. (A) Oblique radiograph of the knee showing a lytic lesion with sclerotic margins (arrows). (B) Axial CT showing the well-defined sclerotic margins with no matrix calcifications. Axial T1-weighted (C), axial enhanced T1-weighted (D), and T2-weighted coronal (E) images showing the lesion to be low signal intensity on T1 (D) with peripheral enhancement.
|
P.657
Suggested Reading
Rahimi A, Beabout JW, Ivens JC, et al. Chondromyxoid fibroma: A clinicopathological study of 76 cases. Cancer 1972;30:726–736.
Yamaguchi T, Dorfman HD. Radiographic and histologic patterns of calcification in chondromyxoid fibroma. Skel Radiol 1998;27:559–564.
P.658
Bone Tumors/Tumorlike Conditions: Nonossifying Fibroma
Key Facts
-
Clinical:
-
Nonossifying fibroma, fibrous cortical
defect, and fibroxanthoma describe similar metaphyseal lesions. Lesions
are common and typically discovered incidentally.
-
-
Age: 5 to 35 years, peak second decade
-
Sex: No sex predilection.
-
Common locations: distal femur, distal tibia
-
Imaging features:
-
Radiographic features: well-defined eccentric lytic defect with scalloped sclerotic margins in the metaphysis of a long bone
-
CT: well-defined eccentric lytic defect with scalloped sclerotic margins in the metaphysis of a long bone
-
MRI: well-defined cortical lesion with
low to intermediate intensity on T1-weighted and low to intermediate
signal intensity on T2-weighted sequences
-
-
Differential diagnosis:
-
Fibrous dysplasia
-
Chondromyxoid fibroma
-
Eosinophilic granuloma
-
-
Treatment: none unless potential for pathologic fracture
P.659
 |
|
FIGURE 10-17 Nonossifying fibromas in the tibia and femur of a 15-year-old boy. AP (A) and lateral (B) radiographs showing lucent lesions in the tibia and femur (arrowheads) with well-defined sclerotic margins. There also is osteochondritis dissecans in the medial femoral condyle. (C,D) Sagittal T2-weighted MR images showing high signal intensity with low intensity at the margin of the lesions.
|
Suggested Reading
Jee W, Choe B, Kang H, et al. Nonossifying fibroma. Characteristics at MR imaging with pathologic correlation. Radiology 1998;209:197–202.
P.660
Bone Tumors/Tumorlike Conditions: Bone Cyst
Key Facts
-
Clinical:
-
Patients are asymptomatic unless pathologic fracture occurs.
-
-
Age: first two decades
-
Sex: Males outnumber females 3:1.
-
Common locations: proximal humerus, femur, or tibia (90% in humerus or femur)
-
Imaging features:
-
Radiographic features: well-defined lytic
lesion frequently near the physis. May be septated. If fracture has
occurred, the “fallen fragment sign” (bone fragment in the dependent
portion of the cyst) is virtually pathognomonic. -
CT: fluid density, well-defined lesion with bony septations
-
MRI: uniformly low intensity on
T1-weighted and high intensity on T2-weighted sequences. Fluid–fluid
level or “fallen fragment” after fracture.
-
-
Differential diagnosis:
-
Aneurysmal bone cyst
-
Fibrous dysplasia
-
-
Treatment: aspiration and steroid injection. If in a weight-bearing region, consider curettage and bone grafting.
P.661
 |
|
FIGURE 10-18 Unicameral bone cyst. AP radiograph of the humerus with a bone cyst and pathologic fracture with the “fallen fragment sign” (arrows).
|
P.662
 |
|
FIGURE 10-19 Unicameral bone cyst. Sagittal T1-weighted (A) and STIR (5300/30/150) (B) images showing low intensity on T1-weighted (A) and high intensity on STIR (B) consistent with a fluid-filled cyst.
|
Suggested Reading
Conway WF, Hayes CW. Miscellaneous lesions of the bone. Radiol Clin North Am 1993;31:299–323.
Kileen K. The fallen fragment sign. Radiology 1998;207:261–262.
P.663
Bone Tumors/Tumorlike Conditions: Aneurysmal Bone Cyst
Key Facts
-
Clinical:
-
Patients present with pain.
-
-
Age: 5 to 35 years, 80% in the first two decades
-
Sex: Females slightly outnumber males.
-
Common locations: more than 50% in the long bones; 12% to 30% in the spine
-
Imaging features:
-
Radiographic features: eccentric lytic
lesion with expanded or “ballooned” bony contour. Sclerotic rim and
periosteal response are common. -
CT: same features as radiographs but fluid density
-
MRI: well-defined lesion with high signal intensity on T2-weighted sequences. Fluid–fluid levels are common.
-
-
Differential diagnosis:
-
Bone cyst
-
Giant cell tumor
-
Osteoblastoma (vertebral location)
-
-
Treatment: curettage and bone grafting
P.664
 |
|
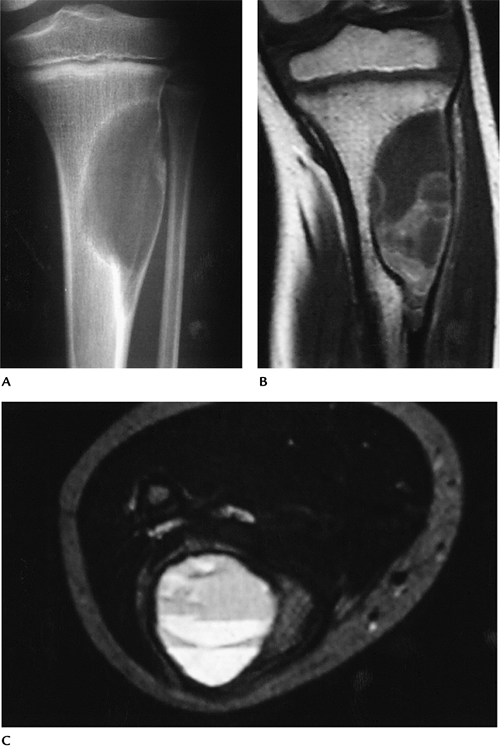
FIGURE 10-20 Aneurysmal bone cyst. (A) AP radiograph showing a lytic expanding lesion in the upper tibia. Coronal T1-weighted (B) and axial T2-weighted (C) MR images showing a cystic lesion with fluid–fluid levels.
|
P.665
Suggested Reading
Munk PL, Helms CA, Holt RG, et al. MR imaging of aneurysmal bone cysts. AJR Am J Roentgenol 1989;153:99–101.
P.666
Bone Tumors/Tumorlike Conditions: Fibrous Dysplasia
Key Facts
-
Clinical:
-
Typically asymptomatic. Abnormal bone
growth may cause deformity. Lesions may be single (monostotic) in which
case the femur, tibia, ribs, and skull base are most commonly involved.
Multiple lesions (polyostotic) involve one side of the skeleton in 90%
of patients. These lesions are more often symptomatic and may enlarge
until skeletal maturity.
-
-
Associated syndromes:
-
Mazabraud syndrome: fibrous dysplasia and multiple intramuscular myxomas
-
Albright-McCune: females with polyostotic dysplasia, skin lesions, and precocious puberty
-
-
Age: most often second or third decade
-
Sex: slightly more common in females
-
Common locations: skull, mandible, ribs, femoral neck, tibia
-
Imaging features:
-
Radiographic features: metaphyseal or
diaphyseal lytic or “ground glass” density with sharp margins and bone
expansion. May affect multiple bones in approximately 15% of patients.
“Long lesion in long bone.” -
CT: well-defined lesion with sclerotic margins
-
MRI: well-defined lesion with
low-intensity margins. Low signal intensity on T1-weighted and
intermediate signal intensity on T2-weighted sequences.
-
-
Differential diagnosis:
-
Nonossifying fibroma
-
Bone cyst
-
Aneurysmal bone cyst
-
Chondromyxoid fibroma
-
-
Treatment: observation
P.667
 |
|
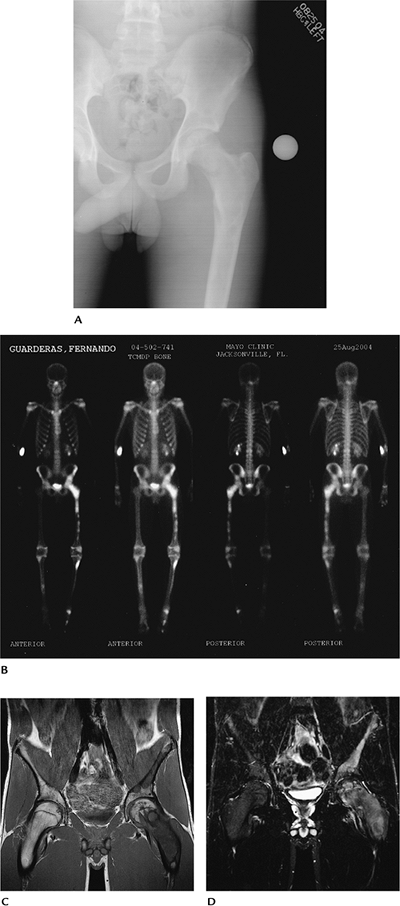
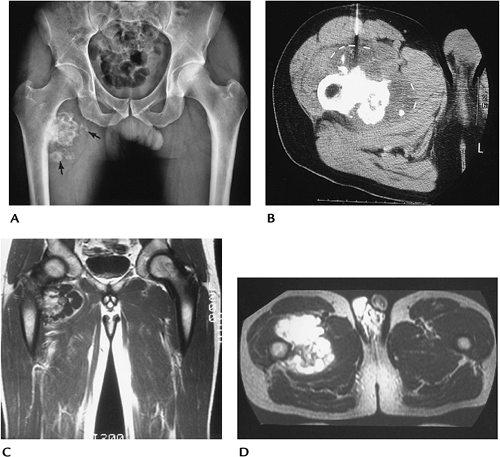
FIGURE 10-21 Thirteen year old male with polyostotic fibrous dysplasia. (A) AP radograph of the pelvis demonstrates lucent lesions in the ilium and femur. (B) Radionuclide bone scan shows multiple lesions on the left involving the pelvis, femur, and tibia. Coronal T1- (C) and T2-weighted (D) images demonstrate abnormal signal intensity in the involved bones with expansion of the femoral neck.
|
P.668
Suggested Reading
Campanacci M, Laus M. Osteofibrous dysplasia of the tibia and fibula. J Bone Joint Surg 1981;63A:367–375.
Gober
GA, Nicholas RW. Case report 800. Skeletal fibrous dysplasia associated
with intramuscular myxomas (Mazabraud’s syndrome). Skel Radiol 1993;22:452–455.
GA, Nicholas RW. Case report 800. Skeletal fibrous dysplasia associated
with intramuscular myxomas (Mazabraud’s syndrome). Skel Radiol 1993;22:452–455.
Greenspan A, Remagen W. Differential diagnosis of tumors and tumorlike lesions in bone and joints. Philadelphia: Lippincott-Raven; 1998:215–223.
P.669
Bone Tumors/Tumorlike Conditions: Giant Cell Tumor
Key Facts
-
Clinical:
-
Giant cell tumors account for 22.7% of
benign bone tumors. Patients present with pain and swelling in the
involved site. A tender palpable mass commonly present.
-
-
Age: 20 to 40 years
-
Sex: Females affected slightly more frequently than males.
-
Common locations: most involve the distal
femur or proximal tibia (46%) followed by the distal radius and sacrum.
Epiphyseal location. -
Imaging features:
-
Radiographic features: lytic lesion with
nonsclerotic margins originating in the metaphysis but extending to
subchondral bone. Cortical breakthrough in 33% to 50% of cases. -
CT: similar to radiographs. No tumor matrix.
-
MRI: low intensity on T1-weighted and
intermediate signal on T2-weighted sequences. T2 sequences may show
decreased signal because of hemosiderin deposition. In some cases,
signal intensity increased on T2-weighted images. May have fluid–fluid
levels. Enhanced on post-contrast images.
-
-
Differential diagnosis:
-
Chondroblastoma
-
Osteosarcoma
-
Fibrosarcoma
-
Malignant fibrous histiocytoma
-
-
Treatment: resection with grafting or, in some cases, joint prosthesis
P.670
 |
|
FIGURE 10-22 Giant cell tumor. (A) AP radiograph demonstrates a poorly defined lesion involving the epiphysis and metaphysis. Coronal T1- (B) and postcontrast T1-weighted (C) images show low signal intensity on the T1-weighted image (B) and contrast enhancement (C). Coronal (D) and axial (E) CT images showing low attenuation with no calcified matrix.
|
P.671
Suggested Reading
Aoki
J, Tanikawa H, Ishü K, et al. MR findings indicative of hemosiderin in
giant-cell tumor of bone: Frequency, cause, and diagnostic
significance. AJR Am J Roentgenol 1996;166:145–148.
J, Tanikawa H, Ishü K, et al. MR findings indicative of hemosiderin in
giant-cell tumor of bone: Frequency, cause, and diagnostic
significance. AJR Am J Roentgenol 1996;166:145–148.
P.672
Bone Tumors/Tumorlike Conditions: Eosinophilic Granuloma
Key Facts
-
Clinical:
-
Patients present with pain. Multisystem disease is associated with Hand-Schüller-Christian or Letterer-Siwe variants.
-
-
Age: 1 to 20 years
-
Sex: Males outnumber females 2:1.
-
Common locations: Skull most common; any bone may be involved.
-
Imaging features:
-
Radiographic features: variable, but
lesions usually lytic with variable margins. May be multiple (one
third). Medullary expansion, periosteal response, and sclerosis in long
bones. Epiphysis usually involved. Lesions may have double contour
margins. -
CT: similar to radiographic features. Cortical and periosteal changes more easily appreciated.
-
MRI: well-defined lesions with
intermediate or high signal intensity on T1- and T2-weighted images
(increased signal on T1 because of xanthomatous histiocytes).
-
-
Differential diagnosis:
-
Osteomyelitis
-
Malignancy
-
Metastasis
-
-
Treatment: resection and bone grafting for solitary lesion. Patients with multiple lesions observed as lesions may regress.
P.673
 |
|
FIGURE 10-23 Eosinophilic granuloma. (A) Radiograph showing a lytic lesion with endosteal scalloping (open arrows) and solid laminated periosteal new bone. Coronal T1-weighted (B) and T2-weighted (C) images showing a focal area of low intensity on T1-weighted (B) and high intensity on T2-weighted (C) images. There is associated marrow edema. Periosteal new bone is low intensity on both sequences.
|
P.674
Suggested Reading
DeSchepper AMA, Ramon F, Van Marck E. MR imaging of eosinophilic granuloma in bone. A report of 11 cases. Skel Radiol 1993;22:163–166.
P.675
Bone Tumors/Tumorlike Conditions: Osteosarcoma
Key Facts
-
Clinical:
-
Osteosarcomas account for 19% of sarcomas
and except for myeloma are the most common primary bone malignancy.
Patients present with pain and swelling in the affected region.
-
-
Age: Second decade is the peak incidence.
-
Sex: Males slightly outnumber females.
-
Common locations: distal femur or proximal tibia (48%), pelvis and proximal femur (14%), shoulder and proximal humerus (10%)
-
Imaging features:
-
Radiographic features: metaphyseal lytic,
blastic, or mixed appearance. Lesions poorly defined with aggressive
periosteal response (spiculations or Codman triangles). Soft tissue
extension common. -
CT: similar to radiographic features
-
MRI: Imaging features are nonspecific.
Signal intensity varies with matrix (decreased with blastic, increased
with lytic on T2-weighted sequence). Staging of marrow and soft tissue
involvement is the primary indication for MRI.
-
-
Differential diagnosis:
-
Ewing sarcoma
-
Fibrosarcoma
-
Chondrosarcoma
-
Giant cell tumor
-
Osteomyelitis
-
-
Treatment: limb salvage or amputation. Radiation and chemotherapy as adjuvant therapy or for nonoperable lesions.
P.676
 |
|
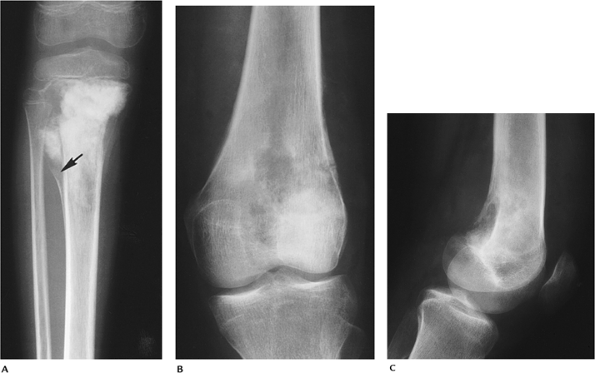
FIGURE 10-24 Osteogenic sarcoma. (A) Fourteen-year-old female with a sclerotic osteosarcoma and Codman triangle (arrow) medially. AP (B) and lateral (C) radiographs of a lytic osteosarcoma with early periosteal reaction in a different patient.
|
P.677
 |
|
FIGURE 10-25 Coronal (A) and axial (B) T2-weighted images of a tibial osteosarcoma invading the joint space (arrow) and with a significant soft tissue mass.
|
P.678
Suggested Reading
Azouz ME, Esseltine DW, Chevalier L. Radiographic evaluation of osteosarcoma. J Can Assoc Radiol 1982;33:167–171.
Unni KK. Dahlin’s bone tumors: General aspects and data on 1,087 cases. Philadelphia: Lippincott-Raven; 1996:143–183.
P.679
Bone Tumors/Tumorlike Conditions: Parosteal Osteosarcoma
Key Facts
-
Clinical:
-
Patients typically present with a painless mass in the distal posterior thigh.
-
-
Age: Third decade (older than conventional osteosarcoma)
-
Sex: Females outnumber males 2:1.
-
Common locations: majority in distal posterior femur (67%), proximal tibia or fibula (12%), proximal humerus (10%)
-
Imaging features:
-
Radiographic features: large ossified
mass on the surface of a long bone. Cortex thick and deformed. Larger
masses may surround bone. -
CT: similar to radiographs. Lucent zone (periosteum) separates the tumor from the cortex (string sign).
-
MRI: often not required because of characteristic CT features and lack of improved specificity for MRI.
-
-
Differential diagnosis:
-
Myositis ossificans
-
Periosteal osteosarcoma
-
Osteosarcoma
-
Periosteal chondrosarcoma
-
-
Treatment: limb salvage resection
P.680
 |
|
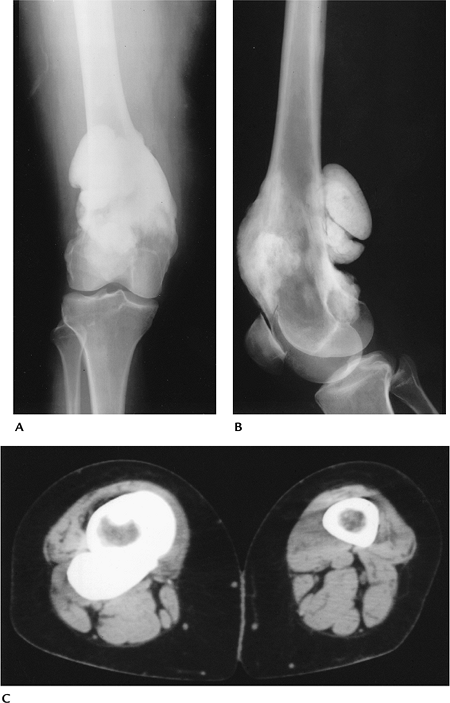
FIGURE 10-26 Parosteal osteogenic sarcoma. AP (A) and lateral (B) radiographs showing dense osseous mass surrounding the lower femur. (C) CT image showing the dense osseous mass around the femur.
|
P.681
Suggested Reading
Greenfield GB, Arrington JA. Imaging of bone tumors: A multimodality approach. Philadelphia: JB Lippincott; 1995:43–166.
P.682
Bone Tumors/Tumorlike Conditions: Periosteal Osteosarcoma
Key Facts
-
Clinical:
-
Periosteal osteosarcomas account for only 1.5% of osteosarcomas. Patients present with local pain over involved bone.
-
-
Age: 15 to 30 years, peak in the second decade
-
Sex: Females outnumber males 1.6:1.
-
Common locations: diaphysis of femur and tibia (73%)
-
Imaging features:
-
Radiographic features: surface lesion on the diaphysis with partial calcification or ossification. Medullary bone not involved.
-
CT: similar to radiographic features. Confirms marrow sparing.
-
MRI: normal marrow with variable signal intensity in periosteum and soft tissues, depending on calcifications
-
-
Differential diagnosis:
-
Myositis ossificans
-
Parosteal osteosarcoma
-
Periosteal chondrosarcoma
-
-
Treatment: wide excision and bone graft (allograft)
 |
|
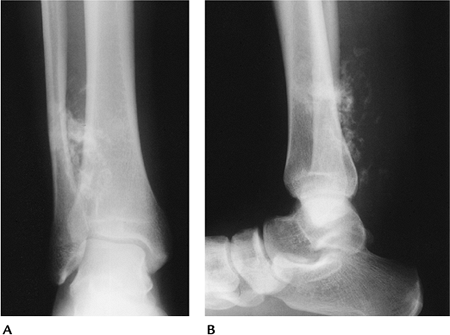
FIGURE 10-27 Periosteal osteosarcoma. AP (A) and lateral (B) radiographs showing a large mineralized soft tissue mass without obvious bone destruction.
|
P.683
Suggested Reading
Unni KK, Dahlin DC, Beabout JW. Periosteal osteogenic sarcoma. Cancer 1976;37:2476–2485.
P.684
Bone Tumors/Tumorlike Conditions: Telangiectatic Osteosarcoma
Key Facts
-
Clinical:
-
Telangiectatic osteosarcomas account for 3.5% of all osteosarcomas. Patients present with pain.
-
-
Age: 15 to 35 years, peak incidence in the second decade
-
Sex: Males outnumber females 2:1.
-
Common locations: distal femur and proximal tibia (61%), humerus (14%)
-
Imaging features:
-
Radiographic features: large lytic or
permeative metaphyseal lesion. Cortical destruction with aggressive
periosteal response and soft tissue mass. -
CT: similar to radiographic features
-
MRI: high-intensity bone and soft tissue
lesion on T2-weighted images; low-intensity on T1-weighted images.
Signal intensity may be mixed, especially on T1-weighted images because
of clotted blood. Fluid–fluid levels.
-
-
Differential diagnosis:
-
Osteosarcoma
-
Fibrosarcoma
-
Aneurysmal bone cyst
-
-
Treatment: limb salvage with wide excision
 |
|
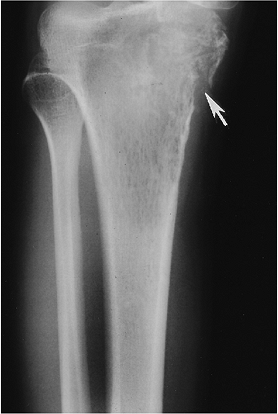
FIGURE 10-28
Telangiectatic osteosarcoma. AP radiograph demonstrating a permeative lytic lesion in the proximal tibia with pathologic fracture medially (arrow). |
P.685
 |
|
FIGURE 10-29 Telangiectatic osteosarcoma. AP (A) and lateral (B) radiographs showing a permeative lesion with aggressive periosteal reaction. Coronal T2-weighted (C) and axial T1-weighted (D) MR images showing a large soft tissue mass with multiple fluid intensity collections on T2-weighted image (C).
|
Suggested Reading
Huvos AG, Rosen G, Bretsky SS, et al. Telangiectatic osteosarcoma: A clinicopathologic study of 124 cases. Cancer 1982;49:1679–1689.
P.686
Bone Tumors/Tumorlike Conditions: Ewing Sarcoma
Key Facts
-
Clinical:
-
Ewing sarcomas account for 9.1% of all
primary malignant bone tumors. Patients present with local pain and
swelling. Patients may also have fever and increased white counts
suggesting infection.
-
-
Age: 5 to 30 years, 75% in the first two decades and 60% in the second decade
-
Sex: no sex predilection
-
Common locations: pelvis and sacrum (25%), femur and tibia (27%), humerus and forearm (12%), foot and ankle (8%)
-
Imaging features:
-
Radiographic features: long diaphyseal
lesion with permeative pattern. May have sclerosis or mixed appearance.
Aggressive periosteal (laminated characteristic of Ewing sarcoma)
response and soft tissue mass common. -
CT: similar to radiographic features; periosteum and soft tissue better defined.
-
MRI: signal intensity variable in mixed
or sclerotic lesions. High signal intensity on T2-weighted and low
signal intensity on T1-weighted with lytic permeative lesions.
-
-
Differential diagnosis:
-
Lymphoma
-
Osteosarcoma
-
Osteomyelitis
-
-
Treatment: radiation or radiation plus chemotherapy. Surgical therapy is more often considered recently.
P.687
 |
|
FIGURE 10-30 Ewing sarcoma. AP radiograph of the femur demonstrating a long lytic lesion with laminated periosteal reaction.
|
P.688
 |
|
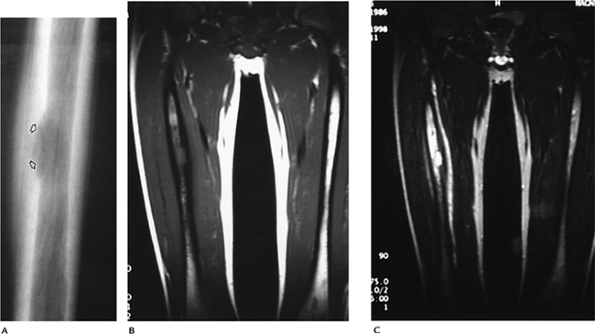
FIGURE 10-31 Ewing sarcoma. AP radiograph (A) showing a lytic lesion in the distal fibular diaphysis and metaphysis. T2-weighted sagittal (B) and axial (C) images showing a high signal intensity medullary lesion with soft tissue involvement.
|
Suggested Reading
Fletcher BD. Responses of osteosarcoma and Ewing’s sarcoma to chemotherapy. Imaging evaluation. AJR Am J Roentgenol 1991;157:825–833.
Unni KK. Dahlin’s bone tumors: General aspects and data on 11,087 cases. Philadelphia: Lippincott-Raven; 1996:249–261.
P.689
Bone Tumors/Tumorlike Conditions: Chondrosarcoma (Primary, Central)
Key Facts
-
Clinical:
-
Chondrosarcomas account for 9.2% of
malignant bone tumors. Osteosarcomas are twice as common. A
chondrosarcoma originating in bone is considered central. Patients
present with pain.
-
-
Age: more common in adults 40 to 60 years old (62%)
-
Sex: Males outnumber females 1.5:1.
-
Common locations: pelvic region most
common (23%), proximal femur (13.5%), proximal humerus (12%), trunk
(10.6%), proximal tibia and fibula (7%) -
Imaging features:
-
Radiographic features: Two thirds are
calcified. Cortical erosion or destruction usually is present.
Typically, little periosteal response. Soft tissue extension common
with large lesions. -
CT: superior for evaluation of cortex and matrix calcification
-
MRI: intermediate to high intensity on
T2-weighted sequences. Calcification seen as low intensity on T1- and
T2-weighted sequences. Soft tissue extension more easily evaluated
compared with CT.
-
-
Differential diagnosis:
-
Osteosarcoma
-
Fibrosarcoma
-
Metastasis
-
-
Treatment: wide excision with reconstruction
P.690
 |
|
FIGURE 10-32 Central chondrosarcoma. (A) Radiograph of the humerus showing a chondroid lesion with calcifications and endosteal scalloping (arrows). Sagittal T1-weighted (B) and axial T2-weighted (C) images showing cortical destruction with soft tissue mass (arrows) indicating a malignant lesion.
|
P.691
Suggested Reading
Hudson TM, Manaster BJ, Springfield DS, et al. Radiology of medullary chondrosarcoma: Preoperative treatment planning. Skel Radiol 1983;10:69–78.
Murphey
MD, Flemming DJ, Boyea SR, et al. Enchondroma versus chondrosarcoma in
the appendicular skeleton: Differentiating features. Radiographics 1998;18:1213–1237.
MD, Flemming DJ, Boyea SR, et al. Enchondroma versus chondrosarcoma in
the appendicular skeleton: Differentiating features. Radiographics 1998;18:1213–1237.
P.692
Bone Tumors/Tumorlike Conditions: Chondrosarcoma (Secondary)
Key Facts
-
Clinical:
-
Secondary chondrosarcomas originate from
osteochondromas or enchondromas. Patients with enchondromas present
with pain. Patients with osteochondromas present with enlarging masses
and pain. Malignant changes are more common in patients with multiple
osteochondromas.
-
-
Age: 30 to 50 years
-
Sex: Males outnumber females 2:1.
-
Common locations: shoulder and proximal humerus (10.4%), pelvis and proximal femur (33%), spine (10.4%)
-
Imaging features:
-
Radiographic features: Irregular
cartilage cap with streaky calcific densities and lucent areas in an
osteochondroma suggest malignant transformation. With enchondromas,
endosteal scalloping, disappearing calcifications, and increasing area
of lucency suggest malignancy. -
CT: similar to radiographs but more useful for evaluating matrix, cartilage cap, and cortical involvement
-
MRI: Lesions have increased intensity on
T2-weighted and decreased intensity on T1-weighted sequences. Cartilage
cap is easily defined (high signal intensity) and measured greater than
1.5 to 2 cm suggests malignancy. Gadolinium-enhanced T1-weighted images
show ring and arc septal pattern of chondrosarcoma.
-
-
Treatment: surgical resection with wide margins
P.693
 |
|
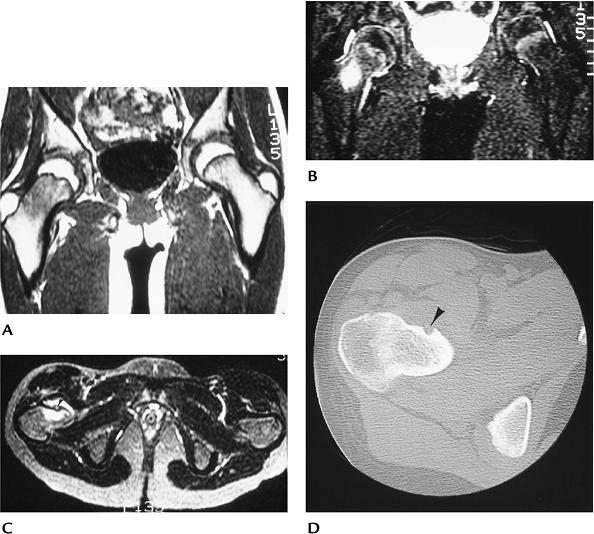
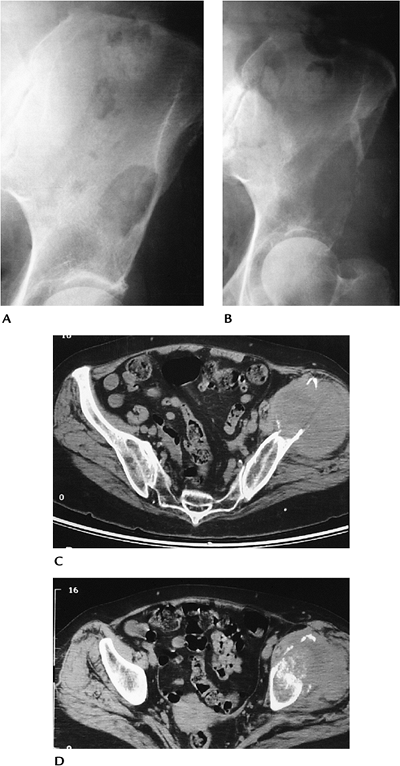
FIGURE 10-33 Secondary chondrosarcoma. (A) AP radiograph of the pelvis showing an osteochondroma with fragmentation in the region of the cartilaginous cap (arrows). (B) CT image taken during biopsy confirms the thick cap (lines) with scattered osseous densities. Coronal T1-weighted (C) and axial T2-weighted (D) MR images showing the thick irregular cartilaginous cap, which is high signal intensity on the T2-weighted image (D) and low signal intensity on T1-weighted image (C).
|
Suggested Reading
Aoki JA, Sone S, Fujioka F, et al. MR of enchondroma and chondrosarcoma. Rings and arcs of Gd-DTPA enhancement. J Comput Assist Tomogr 1991;15:1011–1016.
Unni KK. Dahlin’s bone tumors: General aspects and data on 11,087 cases. Philadelphia: Lippincott-Raven; 1996:71–108.
P.694
Bone Tumors/Tumorlike Conditions: Fibrosarcoma and Malignant Fibrous Histiocytoma
Key Facts
-
Clinical:
-
These are uncommon malignancies of bone
(1% of malignant bone tumors). Up to 30% arise from lesions such as
radiation, bone infarcts, Paget disease, or chronic osteomyelitis.
Patients present with pain and swelling.
-
-
Age: peaks in those aged in their 40s and 60s
-
Sex: no sex predilection
-
Common locations: distal femur and proximal tibia (35%), pelvis and proximal femur (27%), shoulder and humerus (10%)
-
Imaging features:
-
Radiographic features: large,
eccentrically located lytic lesion with poorly defined margins.
Cortical disruption and soft tissue mass common. -
CT: similar to radiographic features
-
MRI: high signal intensity on T2-weighted
and typically low on T1-weighted sequences. Areas of hemorrhage may be
high intensity on T1-weighted sequences. Marrow extent and soft tissue
extension optimally imaged.
-
-
Differential diagnosis:
-
Osteosarcoma
-
Giant cell tumor
-
Metastasis
-
-
Treatment: limb salvage with joint reconstruction
P.695
 |
|
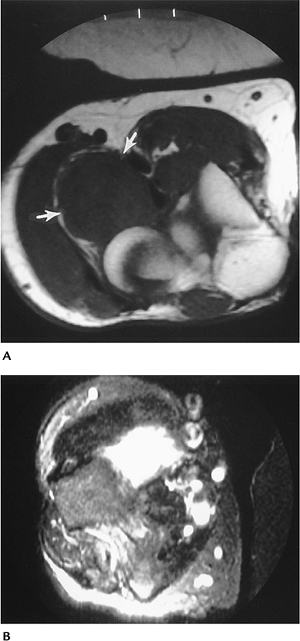
FIGURE 10-34 Malignant fibrous histiocytoma. Routine radiographs showing a lytic lesion in the left ileum (A) that 11 months later (B) has increased dramatically and fractured laterally. (C,D) Axial CT images showing bone destruction and large soft tissue mass with osseous sequestra.
|
P.696
Suggested Reading
Taconia WK, Mulder JD. Fibrosarcoma and malignant fibrous histiocytoma of long bones. Radiographic features and grading. Skel Radiol 1984;11:237–245.
Unni KK. Dahlin’s bone tumors: General aspects and data on 11,087 cases. Philadelphia: Lippincott-Raven; 1996:217–224.
P.697
Bone Tumors/Tumorlike Conditions: Adamantinoma
Key Facts
-
Clinical:
-
Adamantinomas account for less than 1% of all malignant bone tumors. Patients present with local pain.
-
-
Age: 74% in the second and third decades
-
Sex: no sex predilection
-
Common locations: tibial diaphysis (90%)
-
Imaging features:
-
Radiographic features: eccentric lytic
areas with sclerosis. Bone expanded. Typically dominant central lesion.
May be multiple. Both the tibia and fibula may be involved. -
CT: defines cortical and soft tissue involvement
-
MRI: features variable and not well documented
-
-
Differential diagnosis:
-
Fibrous dysplasia
-
Fibroma
-
-
Treatment: excision with wide margins
P.698
 |
|
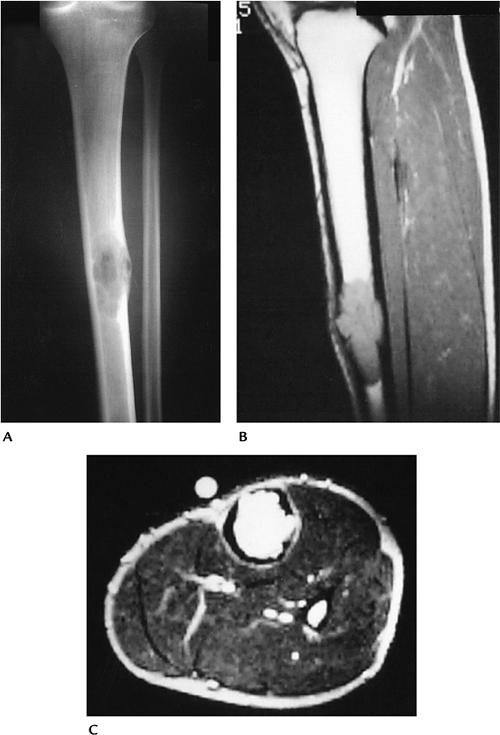
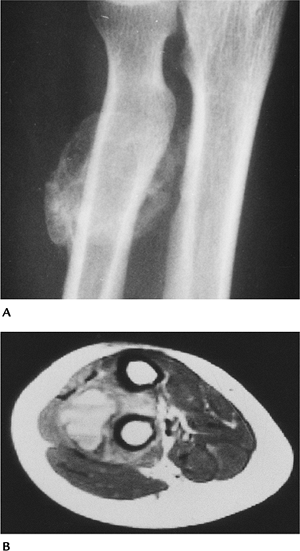
FIGURE 10-35 Adamantinoma in a 21-year-old man. (A) Radiograph showing a lytic expanding lesion with cortical involvement in the midtibia. Sagittal T1-weighted (B) and axial T2-weighted (C) images showing a muscle intensity lesion on T1-weighted (B) and high-intensity lesion on T2-weighted (C) MR images.
|
P.699
Suggested Reading
Levine SM, Lambiase RE, Petchprapa CN. Cortical lesions of the tibia: Characteristic appearances on radiography. Radiographics 2003;23:157–177.
Weiss
SW, Dorfman HD. Adamantinoma of long bones: An analysis of nine cases
with emphasis on metastasizing lesions and fibrous dysplasia-like
changes. Hum Pathol 1977;8:141–153.
SW, Dorfman HD. Adamantinoma of long bones: An analysis of nine cases
with emphasis on metastasizing lesions and fibrous dysplasia-like
changes. Hum Pathol 1977;8:141–153.
P.700
Bone Tumors/Tumorlike Conditions: Paget Sarcoma
Key Facts
-
Clinical:
-
Malignant degeneration occurs in 1% to 6%
of patients with Paget disease. Most (50%) are osteosarcomas, followed
by fibrosarcoma, chondrosarcoma, and other histologic types. Patients
present with increasing or new pain in the region of Paget involvement.
-
-
Age: elderly
-
Sex: Males outnumber females 2:1.
-
Common locations: pelvis, proximal humerus
-
Imaging features:
-
Radiographic features: Most lesions are
lytic, but mixed lytic and sclerotic occur. Soft tissue involvement
common. Originate in bone affected by Paget disease. -
CT: cortical destruction and soft tissue involvement more clearly defined
-
MRI: variable signal intensity. Soft
tissue extension easily identified. Low signal intensity on T1-weighted
images in areas of lucency on the radiograph suggests malignant
degeneration.
-
-
Treatment: wide excision or amputation. Radiation for nonsurgical cases.
P.701
 |
|
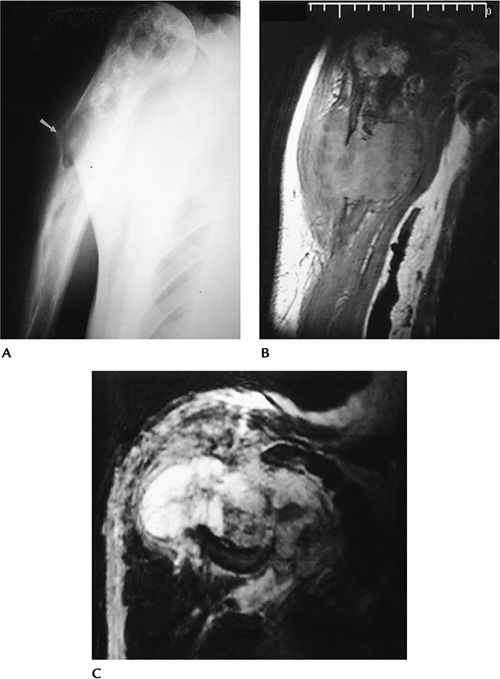
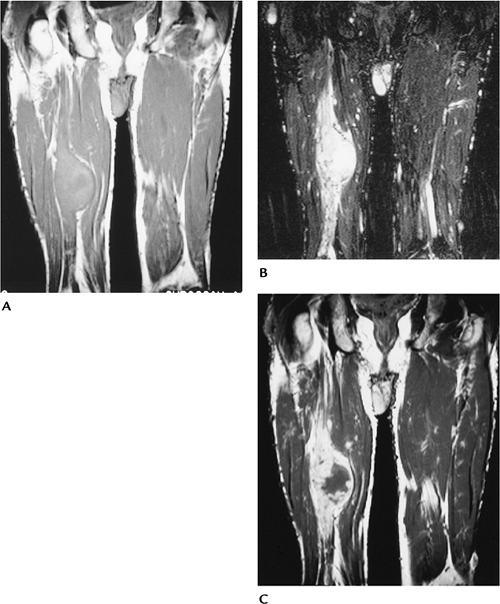
FIGURE 10-36 Paget sarcoma (osteosarcoma) in a 62-year-old man. (A) Radiograph showing changes of Paget disease with a lytic area and cortical destruction laterally (arrow). Coronal T1-weighted (B) and T2-weighted (C) MR images clearly define the bone destruction and large soft tissue mass.
|
Suggested Reading
Hall FM. Incidence of bone sarcoma in Paget’s disease. Radiology 1983;148:865.
Sundarum
M, Khanna G, El-Khoury GY. T1-weighted MR imaging for distinguishing
large osteolysis of Paget disease from sarcomatous degeneration. Skel Radiol 2001;30:378–383.
M, Khanna G, El-Khoury GY. T1-weighted MR imaging for distinguishing
large osteolysis of Paget disease from sarcomatous degeneration. Skel Radiol 2001;30:378–383.
P.702
Bone Tumors/Tumorlike Conditions: Metastasis
Key Facts
-
Clinical:
-
Pain is the most frequent presenting symptom.
-
-
Age: adults
-
Sex: no sex predilection
-
Common locations: axial skeleton, proximal long bones
-
Imaging features:
-
Radiographic features: solitary or multiple lesions. Lesions may be lytic, sclerotic, or mixed, depending on primary tumor.
-
Radionuclide scans: best screening technique for most metastatic lesions. Seen as areas of increased tracer.
-
CT: useful for treatment planning of focal lesions
-
MRI: signal intensity varies:
-
Sclerotic, decreased signal on T1- and T2-weighted images
-
Lytic, decreased T1- and increased signal on T2-weighted images
-
Enhancement variable for lytic and
sclerotic. Diffusion or chemical shift imaging may assist in
differentiating between benign and malignant compression fractures in
the spine.
-
-
-
Differential diagnosis:
-
Multiple myeloma
-
Lymphoma
-
Brown tumors
-
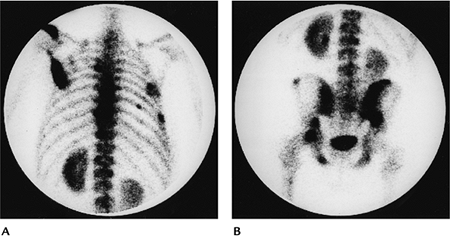 |
|
FIGURE 10-37 Radionuclide bone scans of the upper (A) and lower (B) axial skeleton showing multiple foci of increased tracer caused by metastasis.
|
P.703
 |
|
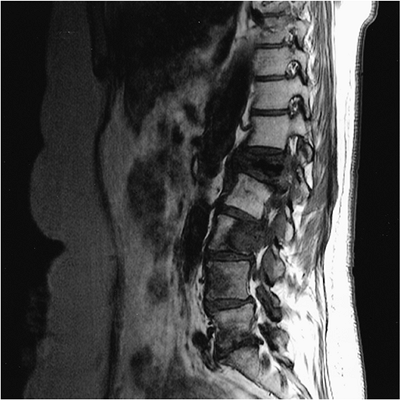
FIGURE 10-38
Sagittal T1-weighted image of the lumbar spine demonstrates a burst fracture of L1 with a large metastatic lesion in L3 extending into the posterior elements and a third lesion in L4. |
Suggested Reading
Simon MA, Karluk MB. Skeletal metastasis of unknown origin: Diagnostic strategy for orthopedic surgeons. Clin Orthop 1983;166:96–103.
Zajick
DC, Morrison WB, Schweitzer ME. Benign and malignant processes: Normal
values and differentiation with chemical shift MR imaging in vertebral
marrow. Radiology 2005;237:590–596.
DC, Morrison WB, Schweitzer ME. Benign and malignant processes: Normal
values and differentiation with chemical shift MR imaging in vertebral
marrow. Radiology 2005;237:590–596.
P.704
Bone Tumors/Tumorlike Conditions: Myeloma
Key Facts
-
Clinical:
-
Myeloma is the most common primary bone
malignancy. Patients present with local pain and often associated
weakness and weight loss.
-
-
Age: usually more than 60 years; rare in those aged less than 40 years
-
Sex: Males outnumber females 2:1.
-
Common locations: skull, axial skeleton, ribs
-
Imaging features:
-
Radiographic features: typically multiple
small lytic foci. May be a solitary lesion. Bone expansion and soft
tissue mass common, especially in the ribs. -
CT: generally not performed unless focal lesion
-
MRI: lesions low intensity on T1-weighted and high intensity on T2-weighted sequences, although variable. May be normal.
-
-
Differential diagnosis:
-
Metastasis
-
Lymphoma
-
-
Treatment: chemotherapy. Surgical intervention for pending pathologic fractures.
P.705
P.706
 |
|
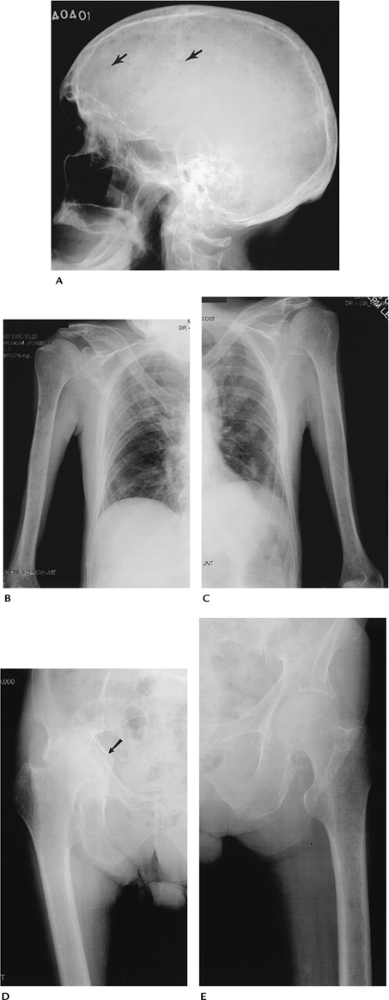
FIGURE 10-39 Multiple myeloma. (A) Lateral radiograph of the skull demonstrates multiple “punched out” lesions (arrows). (B,C) AP radiographs of the humeri and chest wall show multiple rib fractures and multiple lytic lesions in the humeri. (D,E) AP radiographs of the hips and femurs showing focal lytic lesions, osteopenia, and pathologic acetabular fracture (arrow) on the right (D).
|
P.707
 |
|
FIGURE 10-40 Sagittal T1-weighted image of the lumbar spine showing diffuse marrow infiltration caused by multiple myeloma.
|
Suggested Reading
Kyle RA, Elvebrack LR. Management and prognosis of multiple myeloma. Mayo Clin Proc 1976;51:751–760.
P.708
Bone Tumors/Tumorlike Conditions: Lymphoma
Key Facts
-
Clinical:
-
Primary malignant lymphoma accounts for
less than 5% of malignant bone lesions. Patients present with pain and
swelling in involved region.
-
-
Age: 10 to 80 years of age; most common in those aged in their 60s and 70s
-
Sex: Males outnumber females 1.8:1.
-
Common locations: Distal femur and
proximal tibia are most commonly involved followed by the femoral and
humeral shafts. Lesions may involve single or multiple sites. -
Imaging features:
-
Radiographic features: permeative lytic
diaphyseal destruction (70%) and mixed in 28%. May be sclerotic as
well, especially in vertebral bodies. Associated soft tissue mass is
common (48%). Periosteal reaction in 58% and sequestra in 16%. -
CT: useful to define cortical destruction and soft tissue extension of solitary lesions
-
MRI: useful to define cortical destruction and soft tissue extension of solitary lesions. Image features not specific.
-
-
Differential diagnosis:
-
Ewing sarcoma
-
Osteomyelitis
-
Metastasis
-
Osteosarcoma
-
-
Treatment: radiation/chemotherapy
P.709
 |
|
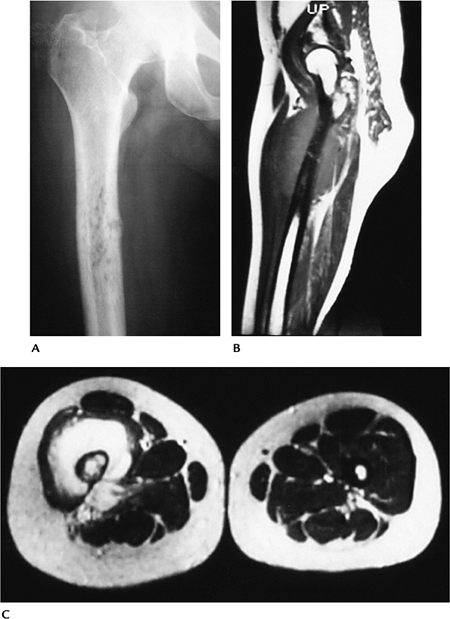
FIGURE 10-41 Lymphoma. (A) Radiograph of the femur showing a permeative lesion in the upper diaphysis. Sagittal T1-weighted (B) and axial T2-weighted (C) MR images showing the marrow changes and large associated soft tissue mass.
|
P.710
Suggested Reading
Daffner RH, Lupetin AR, Dask N, et al. MRI in detection of malignant infiltration of bone marrow. AJR Am J Roentgenol 1986;146:353–358.
Mulligan ME, McRae GA, Murphey MD. Imaging features of primary lymphoma of bone. AJR Am J Roentgenol 1999;173:1691–1697.
P.711
Soft Tissue Masses: Lipoma
Key Facts
-
Clinical:
-
Lipomas are the most common soft tissue
mass. They are composed of mature adipose tissue. Lesions may grow but
usually stabilize. Lipomas may be superficial or deep. Lesions are
multiple in 5% to 8% of patients.
-
-
Age: 50 to 70 years
-
Sex: Males slightly outnumber females.
-
Common locations: deep lipomas—chest
wall, retroperitoneum, hands, and feet. Superficial—back, neck,
shoulder, abdomen, gluteal regions. -
Imaging features:
-
Radiographic features: Larger lipomas may be seen as well-defined fat density masses.
-
CT: fat attenuation, well-defined mass. May contain fibrous septations.
-
MRI: fat intensity on all pulse sequences. May have fibrous septa. No enhancement with gadolinium.
-
-
Differential diagnosis:
-
Low-grade liposarcoma
-
-
Treatment: local resection or observe
P.712
 |
|
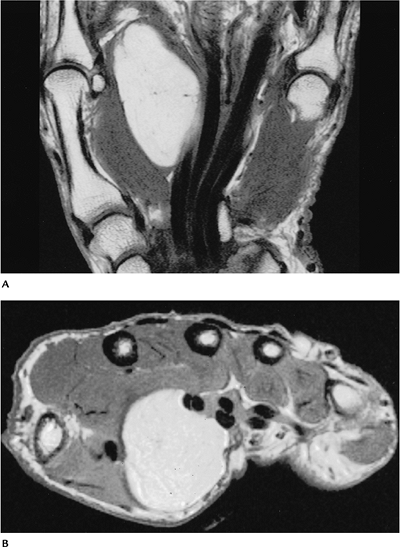
FIGURE 10-42 Benign lipoma. Coronal (A) and axial (B) T1-weighted MR images showing a well-defined mass of fat signal intensity along the flexor tendons of the hand.
|
P.713
Suggested Reading
Dooms
GC, Hricak H, Sollitta RA, et al. Lipomatous tumors and tumors with
fatty components. MR imaging potential and comparison of MR and CT
results. Radiology 1985;157:479–483.
GC, Hricak H, Sollitta RA, et al. Lipomatous tumors and tumors with
fatty components. MR imaging potential and comparison of MR and CT
results. Radiology 1985;157:479–483.
Hosono
M, Kobayashi H, Fujimoto R, et al. Septum-like structures in lipoma and
liposarcoma: MR imaging with pathologic correlation. Skel Radiol 1997;26:150–154.
M, Kobayashi H, Fujimoto R, et al. Septum-like structures in lipoma and
liposarcoma: MR imaging with pathologic correlation. Skel Radiol 1997;26:150–154.
P.714
Soft Tissue Masses: Liposarcoma
Key Facts
-
Clinical:
-
Liposarcoma is the second most common
soft tissue sarcoma in adults (16% to 18% of malignant lesions) after
malignant fibrous histiocytoma. There are five categories: (i) low
grade (54%); (ii) myxoid liposarcoma (23%), (iii) dedifferentiated
(10%); (iv) pleomorphic (7%); (v) round cell (5%). Patients present
with an ill-defined mass.
-
-
Age: 40 to 60 years
-
Sex: Males slightly outnumber females.
-
Common locations: lower extremities (66%–75%), retroperitoneum (20%–33%)
-
Imaging features:
-
Radiographic features: soft tissue mass. May be partially fat density.
-
CT: fat density mass with areas of
increased attenuation with low-grade liposarcoma. High-grade tumors may
have little fat density. -
MRI: low grade: fat intensity mass with
thickened septa and areas of inhomogeneity (decreased signal
T1-weighted, increased signal T2-weighted image). High grade: Signal
intensity varies. There may be little fat intensity. Irregular
enhancement with gadolinium.
-
-
Differential diagnosis:
-
Lipoma variants
-
Malignant fibrous histiocytoma
-
Other soft tissue sarcomas
-
-
Treatment: excision with or without
postoperative radiation. The incidence of local recurrence is 25% to
45% in the extremities and 90% to 100% in the retroperitoneum.
P.715
 |
|
FIGURE 10-43 Low-grade liposarcoma. Coronal T1-weighted MR image of the proximal forearm showing areas of low intensity compared with fat (arrowheads). Compare with Figure 10-44.
|
 |
|
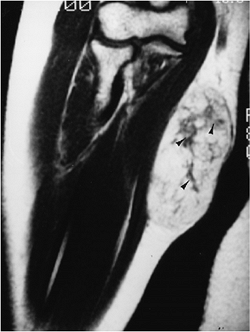
FIGURE 10-44 Intermediate-grade myxoid liposarcoma in the popliteal fossa. Sagittal T1-weighted (A) and T2-weighted (B) images showing little fat signal on T1-weighted (A) and increased signal intensity on the T2-weighted image (B).
|
P.716
Suggested Reading
Kransdorf
MJ, Bancroft LW, Peteron JJ, et al. Imaging of fatty tumors.
Distinction of lipoma and well-differentiated liposarcoma. Radiology 2002;224:99–104.
MJ, Bancroft LW, Peteron JJ, et al. Imaging of fatty tumors.
Distinction of lipoma and well-differentiated liposarcoma. Radiology 2002;224:99–104.
Peterson
JJ, Kransdorf MJ, Bancroft LW, et al. Malignant fatty tumors:
Classification, clinical course, imaging appearance, and treatment. Skel Radiol 2003;32:493–503.
JJ, Kransdorf MJ, Bancroft LW, et al. Malignant fatty tumors:
Classification, clinical course, imaging appearance, and treatment. Skel Radiol 2003;32:493–503.
P.717
Soft Tissue Masses: Myxoma (Intramuscular)
Key Facts
-
Clinical:
-
Patients with this benign mass present with palpable soft tissue mass.
-
-
Age: 40 to 70 years
-
Sex: Females outnumber males 2:1.
-
Common locations: thigh, upper arm and shoulder, gluteal region
-
Imaging features:
-
Radiographic features: none. May see soft tissue mass.
-
CT: solid, well-defined intramuscular mass
-
MRI: well-defined mass with low intensity on T1-weighted and homogeneous high intensity on T2-weighted images
-
-
Differential diagnosis:
-
Myxoid liposarcoma
-
Rhabdomyosarcoma
-
Myxoid lipoma
-
Myxoid neurofibroma
-
-
Treatment: local excision
P.718
 |
|
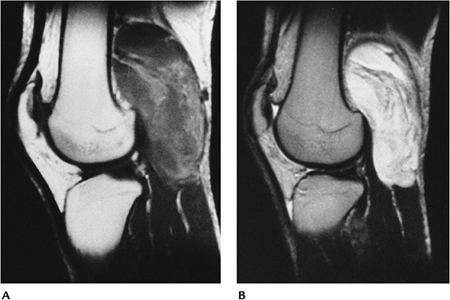
FIGURE 10-45 Myxoma. (A) Coronal T1-weighted, (B) axial proton density, and (C) T2-weighted MR images showing a well-defined lesion with homogeneous low signal on T1-weighted (A) (arrow) and high signal intensity on T2-weighted (C) images.
|
Suggested Reading
Peterson KK, Renfrew DL, Fedderson RM, et al. Magnetic resonance imaging of myxoid-containing tumors. Skel Radiol 1991;20:245–250.
P.719
Soft Tissue Masses: Hemangioma
Key Facts
-
Clinical:
-
Hemangiomas are common (7% of soft tissue
tumors) and represent the most common tumor in children. There are many
variants, but most are classified as capillary or cavernous in type.
Lesions may change in size and can be painful. There are multiple
associated syndromes. -
Maffucci: multiple enchondromas and soft tissue cavernous hemangiomas
-
Klippel-Trenaunay-Weber: cutaneous hemangiomas, bone and soft tissue hypertrophy, varicose veins
-
Osler-Weber-Rendu: hereditary hemorrhagic telangiectasia
-
Kasabach-Merritt: large hemangiomas and thrombocytopenic purpura
-
Sturge-Weber: facial port wine nevus, seizures, glaucoma, buphthalmos, and mental retardation
-
Von Hippel-Lindau: central nervous system
hemangioblastomas, retinal angiomas, renal and pancreatic cysts, renal
cell carcinoma, pheochromocytomas
-
-
Age: less than 30 years (90% present by 30 years of age)
-
Sex: no sex predilection
-
Common locations: superficial—head and neck. Deep—lower extremities.
-
Imaging features:
-
Radiographic features: normal.
Phleboliths may be seen, especially in cavernous hemangiomas. Bone
changes in up to 33% of patients (periosteal reaction, cortical
erosion). -
CT: phlebolith calcifications. Vessels identified with intravenous contrast.
-
MRI: Serpiginous vessels using
conventional spin-echo sequences or MR angiography. Cavernous
hemangiomas may have large amounts of fat and nonvascular tissue, and
they are larger than capillary hemangiomas.
-
-
Differential diagnosis:
-
Lipoma
-
Angiosarcoma
-
-
Treatment: observation. Embolization or resection in selected cases.
P.720
 |
|
FIGURE 10-46 Hemangioma. (A) Axial T2-weighted and (B)
coronal gradient echo MR images demonstrating deep and superficial hemangiomas in the distal thigh with markedly increased signal intensity in serpiginous vascular structures. |
P.721
Suggested Reading
Beutow PC, Kransdorf MJ, Mosen RP, et al. Radiographic appearance of hemangioma with emphasis on MR imaging. AJR Am J Roentgenol 1990;154:563–567.
Sung MS, Kang HS, Lee HG. Regional bone changes in deep soft tissue hemangiomas: Radiographic and MR features. Skel Radiol 1998;22:205–210.
Vilanova JC, Barcelo J, Smirniotopoulos JG, et al. Hemangioma from head to toe: MR imaging with pathologic correlation. Radiographics 2004;24:367–385.
P.722
Soft Tissue Masses: Lymphangioma
Key Facts
-
Clinical:
-
The lesion is made up of lymphatic
channels with fat and other stromal elements. Cause is unknown, but may
be congenital or related to obstruction. Capillary, cavernous, and
cystic varieties exist; the latter are most common.
-
-
Age: birth to 30 years
-
Sex: no sex predilection
-
Common locations: cystic—head and neck. Other—mediastinum, retroperitoneum, extremities
-
Imaging features:
-
Radiographic features: soft tissue mass. Calcification rare.
-
CT: soft tissue mass. Vessel-like structures in fatty tissue.
-
MRI: cystic-type low signal intensity on
T1-weighted and homogeneous high signal intensity on T2-weighted
images. Serpiginous vessels may be difficult to differentiate from
veins or arteries of other vascular lesions.
-
-
Differential diagnosis:
-
Hemangioma
-
Cyst or ganglion
-
-
Treatment: resection, depending on extent and risks
P.723
 |
|
FIGURE 10-47 Lymphangioma. Axial (A) and coronal (B,C) images of the lower extremities demonstrating low signal intensity dilated lymphatic vessels on the right.
|
Suggested Reading
Siegel MF, Glazer HS, St. Amour TE, et al. Lymphangiomas in children. MR imaging. Radiology 1989;170:467–470.
P.724
Soft Tissue Masses: Benign Peripheral Nerve Sheath Tumor
Key Facts
-
Clinical:
-
Benign peripheral nerve sheath tumors
include neurofibromas and schwannomas. Symptoms are similar—slowly
growing mass. Pain and paresthesias may be present.
-
-
Age: 20 to 50 years
-
Sex: no sex predilection
-
Common locations: neurofibroma—cutaneous
nerves. Schwannoma— head, neck, flexor surface of extremities,
mediastinum, retroperitoneum -
Imaging features:
-
Radiographic features: typically none
-
CT: well-defined soft tissue mass
-
MRI: neurofibroma—target appearance on
T2-weighted images. Low-intensity center with peripheral higher
intensity. Central zone enhances on T1-weighted postgadolinium images.
Schwannoma—similar to neurofibroma in 46% or low intensity on
T1-weighted and high intensity on T2-weighted images. Nerve visible
along or inside the mass in 90%.
-
-
Differential diagnosis:
-
Cyst
-
Myxoma
-
Soft tissue sarcoma
-
-
Treatment: resection of schwannoma. Neurofibroma cannot be successfully resected without sacrificing the underlying nerve.
 |
|
FIGURE 10-48 Schwannoma. Axial proton density (A) and T2-weighted (B) images showing a well-defined lesion with high intensity on the T2-weighted image.
|
P.725
 |
|
FIGURE 10-49 Neurofibroma. (A)
Axial T2-weighted image showing a high-intensity lesion with central low intensity (target appearance) characteristic of neurofibroma. (B) Axial post-contrast T1-weighted image showing central enhancement. |
Suggested Reading
Varma DGK, Moulopulos A, Sara AS, et al. MR imaging of extracranial nerve sheath tumors. J Comput Assist Tomogr 1992;16:448–453.
P.726
Soft Tissue Masses: Malignant Peripheral Nerve Sheath Tumor
Key Facts
-
Clinical:
-
Malignant peripheral nerve sheath tumors
account for 6% to 10% of all soft tissue sarcomas. Half occur in
patients with neurofibromatosis. Patients present with enlarging masses
with or without pain.
-
-
Age: 20 to 50 years
-
Sex: no sex predilection
-
Common locations: major nerves or plexus; therefore, upper and lower extremities or trunk
-
Imaging features:
-
Radiographic features: normal or soft tissue mass
-
CT: soft tissue mass in or near major neural structure
-
MRI: irregular margins with signal inhomogeneity on T2-weighted images. Irregular bone destruction not uncommon.
-
-
Differential diagnosis:
-
Malignant fibrous histiocytoma
-
Leiomyosarcoma
-
Synovial sarcoma
-
-
Treatment: wide excision. Five-year
survival is only 15% to 40%. Prognosis worse if the lesion is larger
than 5 cm and in patients with neurofibromatosis.
P.727
 |
|
FIGURE 10-50 Malignant nerve sheath tumor. Coronal T1-weighted (A) and T2-weighted (B)
images showing a large mass with nerve enlargement at its margins. The mass is high intensity on T2 with a large low-intensity central zone. T1-weighted contrast-enhanced image (C) showing peripheral enhancement of the tumor and adjacent nerve. |
Suggested Reading
Ducetman BS, Scheithaurer BW, Piepgras DG, et al. Malignant nerve sheath tumors. A clinicopathological study of 120 cases. Cancer 1986;57:2006–2021.
Lin
J, Martel W. Cross-sectional imaging of peripheral nerve sheath tumors:
Characteristic signs on CT, MR imaging, and sonography. AJR Am J Roentgenol 2001;176:75–82.
J, Martel W. Cross-sectional imaging of peripheral nerve sheath tumors:
Characteristic signs on CT, MR imaging, and sonography. AJR Am J Roentgenol 2001;176:75–82.
P.728
Soft Tissue Masses: Deep Fibromatosis (Desmoid Tumor)
Key Facts
-
Clinical:
-
Fibromatoses may be superficial, which
are diagnosed clinically, or deep, which often require imaging for
detection and diagnosis. Although benign lesions, they have an
aggressive clinical behavior. Multiple lesions are reported in 10% to
15% of cases. Patients present with a soft tissue mass.
-
-
Age: adolescent to 40 years
-
Sex: no sex predilection
-
Common locations: most in lower extremity, upper extremity, shoulder
-
Imaging features:
-
Radiographic features: Soft tissue mass may be evident. Pressure erosions of adjacent bone (6% to 16%).
-
CT: poorly defined soft tissue mass. Good for early bone involvement.
-
MRI: Variable portions to entire mass may
have low signal intensity on all pulse sequences because of fibrous
tissue. More often, areas of intermediate signal intensity on
T2-weighted images also are present. Irregular margins. Neurovascular
and bone involvement easily identified.
-
-
Differential diagnosis:
-
Fibrosarcoma
-
Malignant fibrous histiocytoma
-
-
Treatment: wide excision when possible. Recurrence rate greater than 75%.
P.729
 |
|
FIGURE 10-51 Desmoid tumor. Axial T1-weighted (A) and axial (B) and sagittal (C)
T2-weighted images showing a poorly defined mass with areas of low signal intensity on both sequences characteristic of a fibrous lesion. The lesion encases the metatarsals. |
Suggested Reading
Lee JC, Thomas JM, Phillips S, et al. Aggressive fibromatosis: MRI features with pathologic correlation. AJR Am J Roentgenol 2006;186:247–254.
Sundaram
M, McGuire MH, Schajowicz F. Soft tissue masses: Histologic bases for
decreased signal (short T2) on T2-weighted MR images. AJR Am J Roentgenol 1987;148:1247–1250.
M, McGuire MH, Schajowicz F. Soft tissue masses: Histologic bases for
decreased signal (short T2) on T2-weighted MR images. AJR Am J Roentgenol 1987;148:1247–1250.
P.730
Soft Tissue Masses: Elastofibroma
Key Facts
-
Clinical:
-
Elastofibroma is a tumorlike mass
resulting from friction between the scapula and chest wall. The lesion
is not uncommon and is found in 24% of females and 11% of males at
autopsy when patients are aged more than 55 years. Half are
asymptomatic.
-
-
Age: more than 55 years; mean 70 years
-
Sex: Females outnumber males 2:1.
-
Common locations: Between scapula and chest wall in 99%; up to 67% are bilateral.
-
Imaging features:
-
Radiographic features: normal. Rarely, scapula displaced.
-
CT: soft tissue mass. Location more specific for diagnosis than imaging features.
-
MRI: soft tissue mass with well-defined
margins. Signal intensity similar to muscle on T1- and T2-weighted
images with scattered areas of fat intensity. Irregular enhancement
with gadolinium.
-
-
Differential diagnosis:
-
Fibroma
-
Desmoid
-
-
Treatment: surgical excision
 |
|
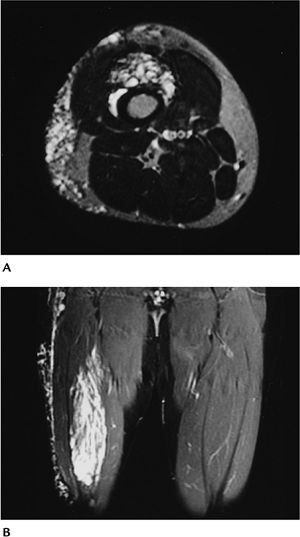
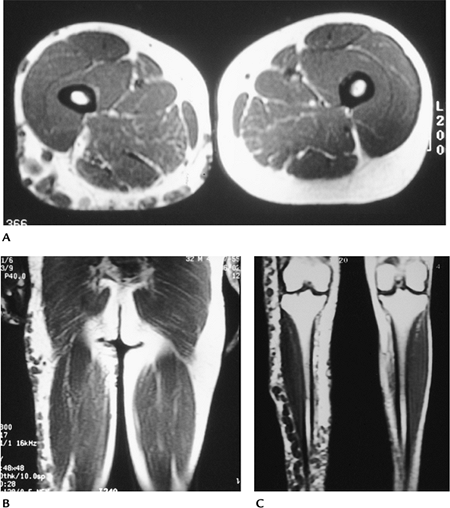
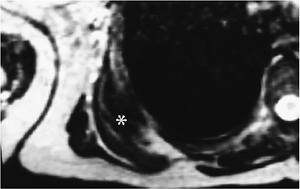
FIGURE 10-52 Elastofibroma. Axial T2-weighted MR image showing a muscle density infrascapular lesion (asterisk) with linear areas of fat density.
|
P.731
 |
|
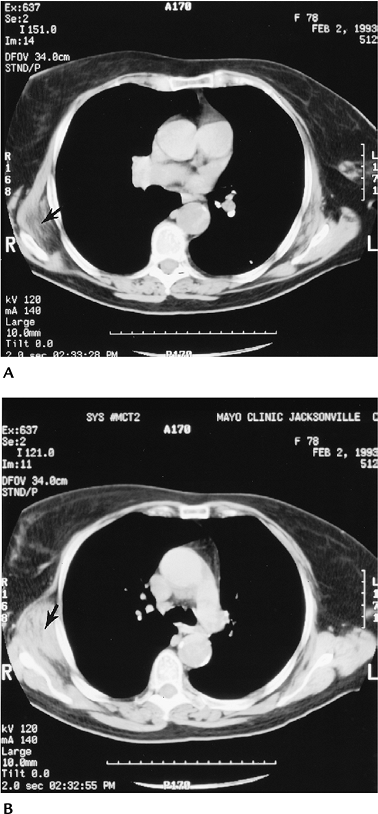
FIGURE 10-53 Axial CT images demonstrate a subscapular mass (arrow) on the right with areas of fat infiltration.
|
Suggested Reading
Kransdorf MJ, Meis JM, Montgomery E. Elastofibroma. MR and CT appearance with radiological-pathological correlation. AJR Am J Roentgenol 1992;159:575–579.
P.732
Soft Tissue Masses: Ganglion
Key Facts
-
Clinical:
-
Ganglia are often asymptomatic,
well-defined juxta-articular lesions. Some may present with pain. Most
are less than 2 cm in size.
-
-
Age: 25 to 45 years
-
Sex: much more common in females than in males
-
Common locations: Wrist and hand most common, but occur around any articular location.
-
Imaging features:
-
Radiographic features: normal or small soft tissue mass
-
CT: well-defined soft tissue mass with fluid density
-
MRI: well-defined lesion with uniformly
high intensity on T2-weighted and low signal intensity on T1-weighted
sequences. May vary if complicated by hemorrhage or thick proteinaceous
debris. Wall enhances with gadolinium.
-
-
Differential diagnosis:
-
Synovial sarcoma
-
Nerve sheath tumor
-
-
Treatment: aspiration or, more often, resection
P.733
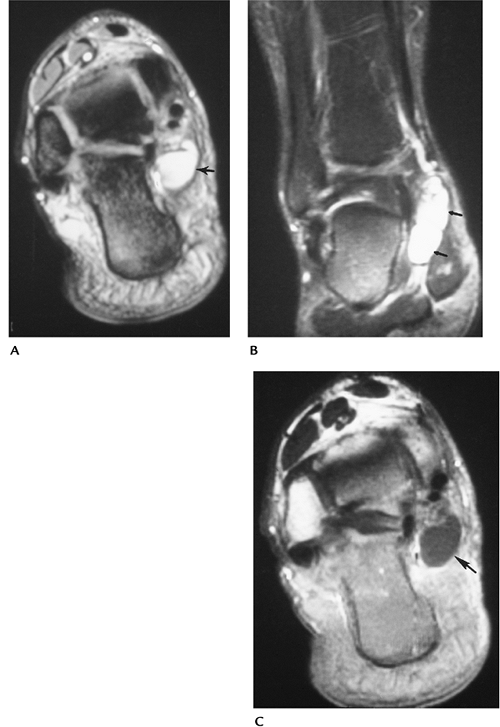 |
|
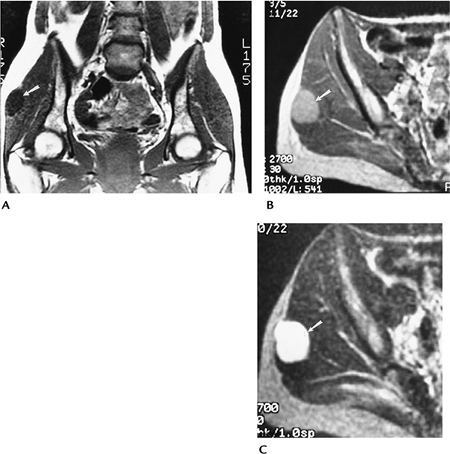
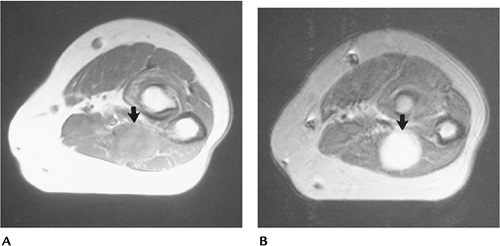
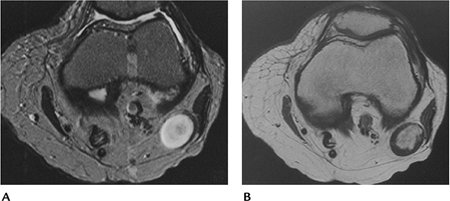
FIGURE 10-54 Ganglion cyst. Axial (A) and coronal (B) T2-weighted images showing a well-defined high signal intensity lesion (arrows). (C) Post-contrast T1-weighted image showing cyst wall enhancement (arrow).
|
Suggested Reading
Feldman F, Surgson SD, Staron RB. Magnetic resonance imaging of para-articular and ectopic ganglia. Skel Radiol 1989;18:353–358.
P.734
Soft Tissue Masses: Giant Cell Tumor of Tendon Sheath
Key Facts
-
Clinical:
-
Giant cell tumors of the tendon sheath
may be focal or diffuse. The localized lesion is most common in the
hand, usually the flexor tendons. Patients present with a slow-growing
soft tissue mass.
-
-
Age: 30 to 50 years
-
Sex: Females outnumber males.
-
Common locations: hand; less commonly, foot, knee, hip
-
Imaging features:
-
Radiographic features: soft tissue mass. Bone erosion in 15%.
-
CT: Soft tissue mass associated with tendon. Bone involvement easily appreciated.
-
MRI: Mass associated with a tendon and
low intensity (muscle density) on T1-weighted and intermediate to low
intensity on T2-weighted sequences. Irregular enhancement with
gadolinium.
-
-
Differential diagnosis:
-
Granuloma
-
Fibroma
-
-
Treatment: resection. Recurrence occurs in up to 20%.
P.735
P.736
 |
|
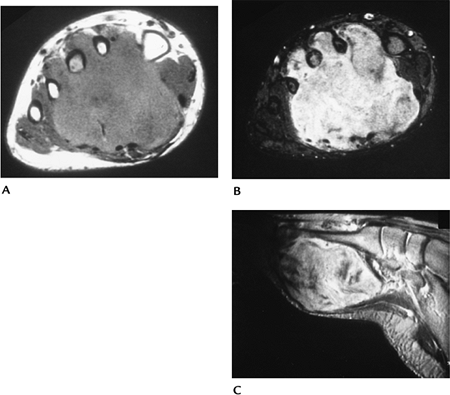
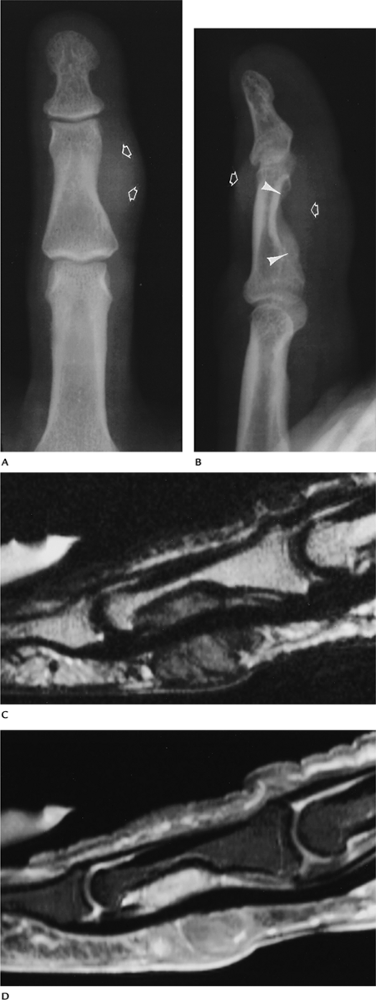
FIGURE 10-55 Giant cell tumor of the tendon sheath. AP (A) and lateral (B) radiographs demonstrate a soft tissue mass (open arrows) with bone erosion (arrowheads). Sagittal T2-weighted (C) image shows intermediate and low signal intensity with bone erosion. There is irregular enhancement (D) after contrast.
|
P.737
Suggested Reading
Jelinek JS, Kransdorf MJ, Utz JA, et al. MR imaging of giant cell tumor of the tendon sheath. AJR Am J Roentgenol 1994;162:919–922.
P.738
Soft Tissue Masses: Hematoma
Key Facts
-
Clinical:
-
Patients present with history of trauma
or mass that may be painful. Hematomas may be acute (hours, days),
subacute (3 weeks to 3 months), or chronic (more than 3 months).
-
-
Age: occurs at any age
-
Sex: no sex predilection
-
Common locations: lower extremities
-
Imaging features:
-
Radiographic features: normal or soft tissue mass
-
CT: Soft tissue mass with areas of increased attenuation caused by blood. Usually well-defined margins.
-
MRI
-
Acute: muscle density on T1-weighted and variable on T2-weighted sequences.
-
Subacute: increased signal on T1- and T2-weighted sequences. May have low-intensity fibrous rim.
-
Chronic: similar to subacute
-
-
-
Differential diagnosis:
-
Sarcoma
-
Abscess
-
-
Treatment: Observe or resect, depending on location and symptoms.
P.739
 |
|
FIGURE 10-56 Acute hematoma. (A) T1-weighted axial MR image showing a muscle density mass (arrows). (B) The hematoma is high intensity on the T2-weighted image.
|
Suggested Reading
Aoki T, Norkata H, Watanabe H, et al. The radiologic findings of chronic expanding hematoma. Skel Radiol 1999;28:396–401.
P.740
Soft Tissue Masses: Myositis Ossificans
Key Facts
-
Clinical:
-
Patients may or may not have a history of trauma. Pain, tenderness, and soft tissue mass are common findings.
-
-
Age: children, adults
-
Sex: no sex predilection
-
Common locations: Eighty percent are in the large muscles of the extremities, especially lower extremities.
-
Imaging features:
-
Radiographic features: faint soft tissue calcification within 2 to 6 weeks. May have well-defined bony margins by 8 weeks.
-
Separated from periosteum by lucent zone.
-
CT: Characteristic feature is peripheral ossification.
-
MRI: Features vary with age.
-
Early: low intensity on T1-weighted and high intensity on T2-weighted images. Soft tissue edema with similar pattern.
-
Late: peripheral rim of low intensity on
all sequences. Irregular areas of increased signal intensity on
T2-weighted sequences and fluid–fluid levels centrally. Later, central
signal intensity similar to fat on all sequences or areas of low
intensity caused by ossification or fibrosis.
-
-
Differential diagnosis:
-
Parosteal sarcoma
-
Juxtacortical osteosarcoma
-
-
Treatment: resection
P.741
 |
|
FIGURE 10-57 Myositis ossificans of intermediate age. (A) Radiograph showing an area of ossification near the proximal radius. (B) Proton-density MR image showing a lesion with fluid–fluid levels. Mineralization is seen as a subtle rim of decreased signal.
|
Suggested Reading
DeSmet AA, Norris MA, Fisher DR. Magnetic resonance imaging of myositis ossificans. Skel Radiol 1992;21:503–507.
P.742
Soft Tissue Masses: Malignant Fibrous Histiocytoma
Key Facts
-
Clinical:
-
Malignant fibrous histiocytoma is the
most common soft tissue sarcoma in adults more than 45 years of age.
Patients usually present with a painless enlarging lower extremity mass.
-
-
Age: 45 to 70 years
-
Sex: Males outnumber females 2:1.
-
Common locations: thigh, lower extremity, upper extremity, and retroperitoneum in decreasing frequency
-
Imaging features:
-
Radiographic features: soft tissue mass. Rarely calcifies.
-
CT: soft tissue mass with variable enhancement after intravenous contrast
-
MRI: irregular margins with low intensity
on T1-weighted and inhomogeneous high signal intensity on T2-weighted
sequences. Variable enhancement with gadolinium.
-
-
Differential diagnosis:
-
Pleomorphic liposarcoma
-
Fibrosarcoma
-
Desmoid tumor
-
-
Treatment: wide excision. Radiation and chemotherapy as adjuvant or palliative measures
P.743
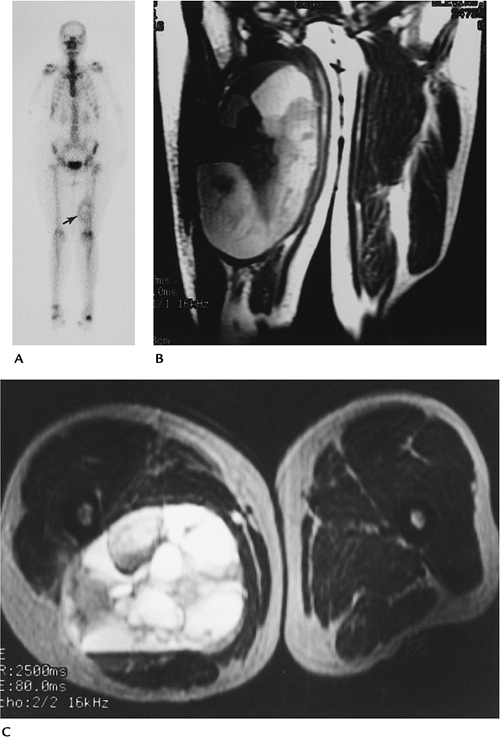 |
|
FIGURE 10-58 Malignant fibrous histiocytoma. (A) Radionuclide bone scan showing increased tracer in the soft tissues along the distal left femur (arrow). Coronal T1-weighted (B) and axial T2-weighted (C) images showing a large inhomogeneous lesion with areas of hemorrhage.
|
P.744
Suggested Reading
Weiss SW, Goldblum JR. Enzinger and Weiss soft tissue tumors, 4th ed. St. Louis: Mosby; 2001:535–570.
P.745
Soft Tissue Masses: Synovial Sarcoma
Key Facts
-
Clinical:
-
Synovial sarcoma is fairly common,
accounting for 10% of soft tissue sarcomas. Patients present with a
slow-growing, often innocent-appearing mass. The mass typically is near
a joint and associated with a tendon sheath, bursa, or fascial plane.
Metastasis is present at time of diagnosis in 25% of patients. Pain
also is commonly present.
-
-
Age: 15 to 40 years
-
Sex: Males slightly outnumber females.
-
Common locations: extremities near larger joints, especially the knee
-
Imaging features:
-
Radiographic features: normal or well-defined soft tissue mass. Calcification occurs in 33%. Bone involvement occurs in 20%.
-
CT: well-defined soft tissue mass near a joint. Subtle calcification is easily appreciated.
-
MRI: inhomogeneous signal on T2-weighted
sequences. May have cystic appearance and fluid–fluid levels.
Calcifications seen as areas of low intensity on all sequences.
-
-
Differential diagnosis:
-
Benign cyst
-
Hematoma
-
Epithelioid sarcoma
-
Malignant nerve sheath tumor
-
-
Treatment: wide excision, adjuvant radiation therapy
P.746
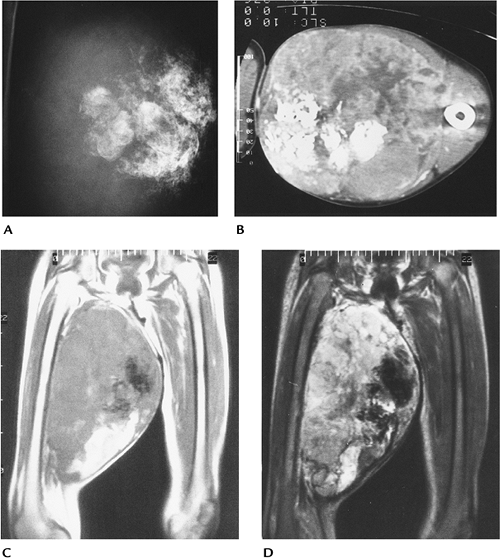 |
|
FIGURE 10-59 Synovial sarcoma. (A) Radiograph showing a large calcified mass in the thigh. (B) CT image showing a large calcified soft tissue mass in the medial thigh. Coronal T1-weighted (C) and T2-weighted (D)
MR images showing a large inhomogeneous mass. The calcifications are seen as low-intensity regions in the medial aspect of the mass with hemorrhage seen inferiorly. |
Suggested Reading
Morton MJ, Berquist TH, McLeod RA, et al. MR imaging of synovial sarcoma. AJR Am J Roentgenol 1990;156:337–340.
P.747
Soft Tissue Masses: Rhabdomyosarcoma
Key Facts
-
Clinical:
-
Rhabdomyosarcoma is the most common soft
tissue sarcoma in children aged less than 15 years, but also is common
in adolescents and young adults. Patients present with soft tissue mass
when extremities are involved. Metastasis is present at the time of
diagnosis in 20%.
-
-
Age: children, young adults
-
Sex: Males slightly outnumber females.
-
Common locations: head, neck, genitourinary tract, retroperitoneum, and extremities, in decreasing order of frequency
-
Imaging features:
-
Radiographic features: vary with
location. Most poorly defined masses. Lower genitourinary tract
(botryoid sarcoma) may look like multiple cysts in 25% of cases. -
CT: similar to radiographic
-
MRI: variable. Typically, high signal
intensity on T2-weighted and low on T1-weighted sequences. May be
inhomogeneous on T2-weighted sequences, with poorly defined margins.
-
-
Differential diagnosis:
-
Transitional cell (bladder)
-
Leiomyosarcoma
-
Lymphoma
-
-
Treatment: wide excision when possible. Varies with location. Recurrence and metastasis are common.
P.748
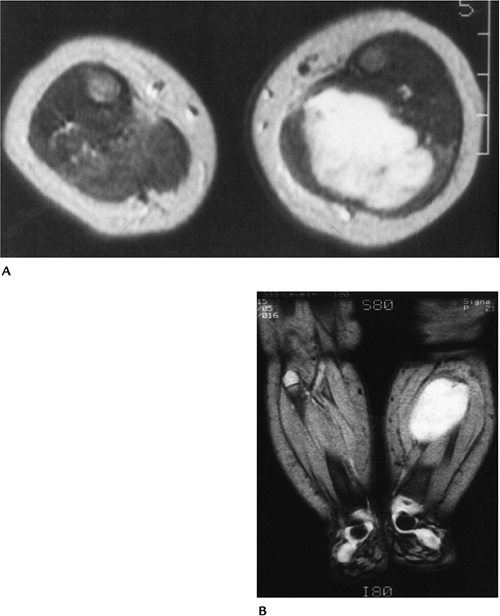 |
|
FIGURE 10-60 Rhabdomyosarcoma in a 3-month-old girl. Axial T2-weighted (A) and coronal gradient-echo (B) weighted MR images showing a high signal intensity muscle mass caused by an embryonal rhabdomyosarcoma.
|
Suggested Reading
Weis SW, Goldblum JR. Enzinger and Weiss’s soft tissue tumors, 4th ed. St. Louis: Mosby; 2001:785–836.