
-
A phased array torso, cardiac, or dedicated hip coil is required to evaluate femoroacetabular impingement using high-resolution images.
-
FS PD FSE images in the coronal axial and sagittal planes are used to identify anterior and lateral acetabular labral tears.
-
Axial oblique images are used to estimate the alpha angle in the nonspherical femoral head in cam-type femoroacetabular impingement.
-
MR arthrography is an optional adjunct and is not a replacement for routine FS PD FSE imaging.
-
The flexor muscles, including the iliopsoas, rectus femoris and sartorius
-
The extensor muscles, including the gluteus maximus and the hamstring muscles (the biceps femoris, semimembranosus, and semitendinosus)
-
The abductor muscles, including the gluteus medius and minimus
-
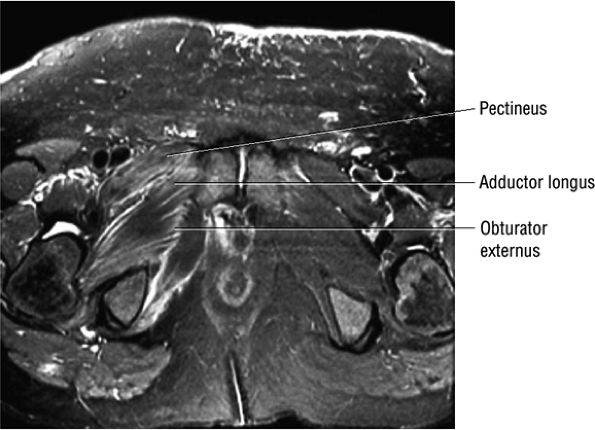
The adductor muscles, including the adductor brevis, longus, and magnus muscles, the pectineus, and the gracilis
-
The muscles of external rotation, including the obturator internus and externus, the superior and inferior gemellus, the quadratus femoris, and the piriformis
-
The muscles of internal rotation, including the gluteus medius and minimus (secondary function), the tensor fasciae latae, the semimembranosus, the semitendinosus, the posterior pectineus, and the adductor magnus
-
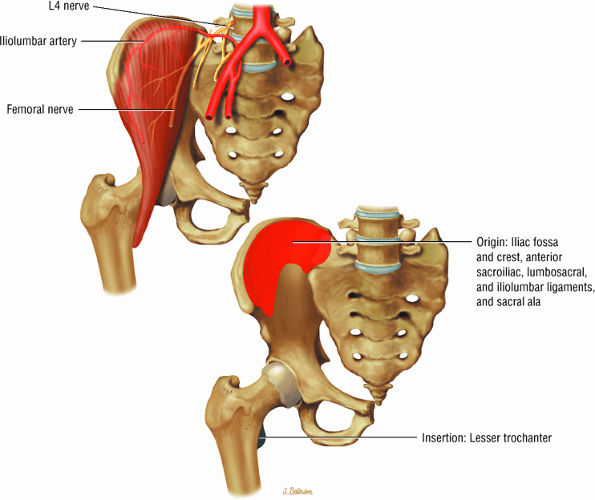
The muscles of the iliac region, including the psoas major (Fig. 3.2), psoas minor (Fig. 3.3), and iliacus (Fig. 3.4)
-
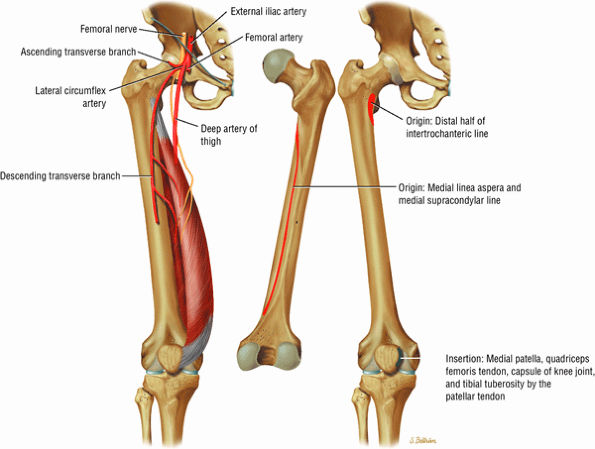
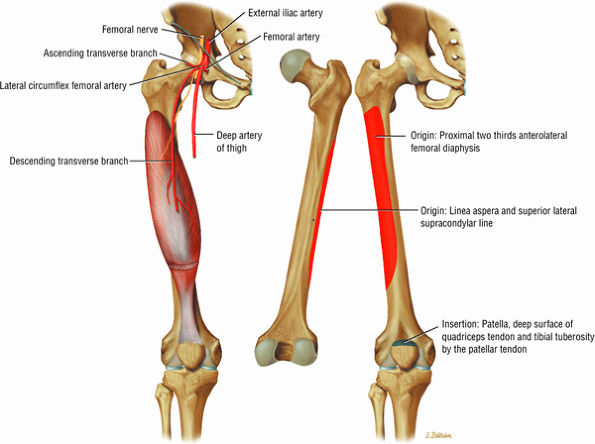
The anterior muscles of the thigh, including the sartorius (Fig. 3.5), the rectus femoris (Fig. 3.6), the vastus lateralis (Fig. 3.7), the vastus medialis (Fig. 3.8), and the vastus intermedius (Fig. 3.9). The vastus lateralis, vastus medialis, vastus intermedius, and rectus femoris are the quadriceps muscles.
-
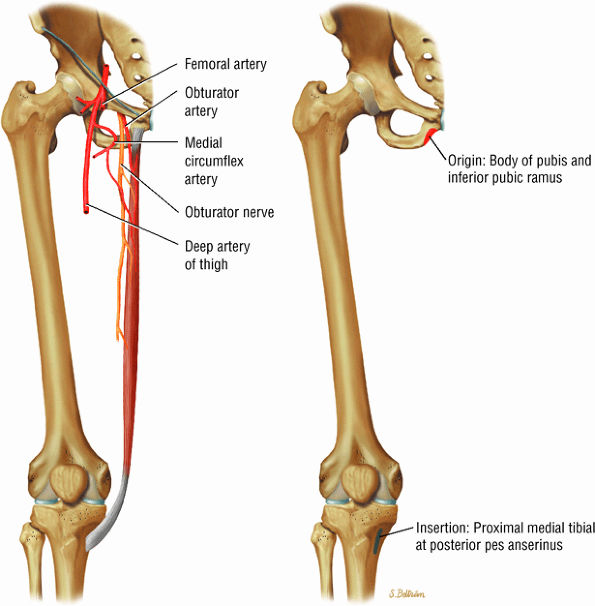
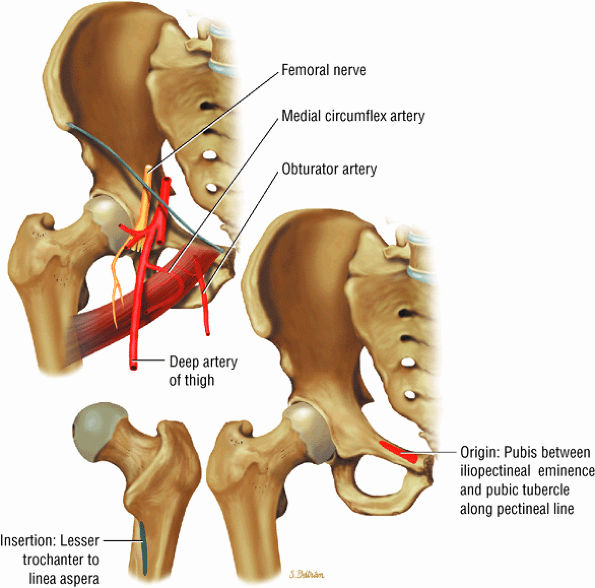
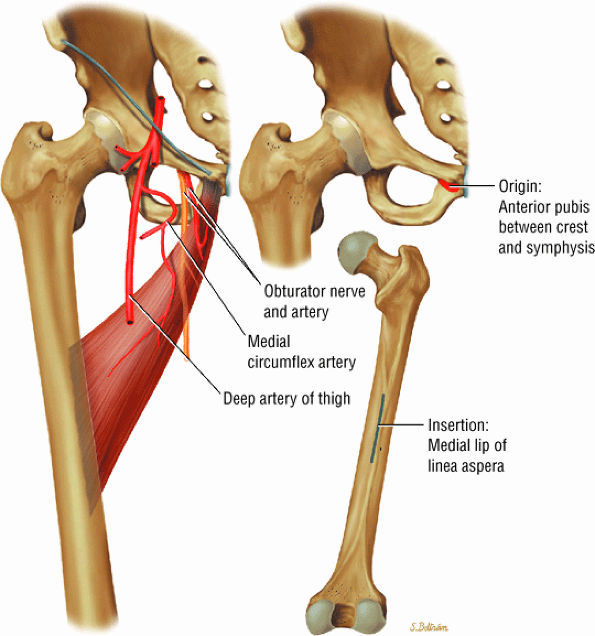
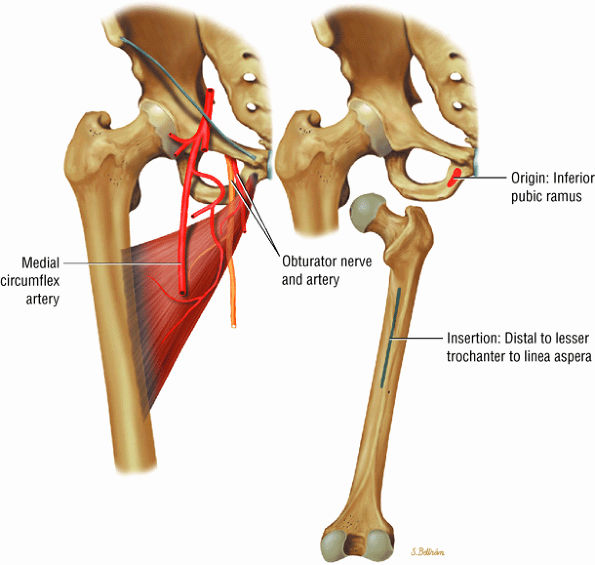
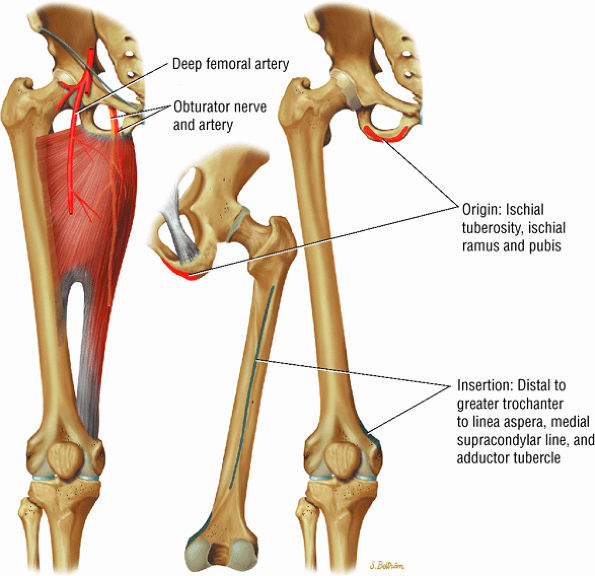
The medial muscles of the thigh, including the gracilis (Fig. 3.10), the pectineus (Fig. 3.11), the adductor longus (Fig. 3.12), the adductor brevis (Fig. 3.13), and the adductor magnus (Fig. 3.14)
-
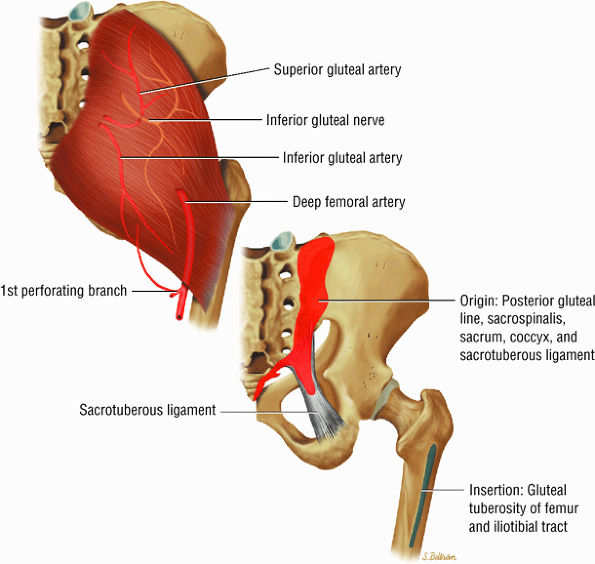
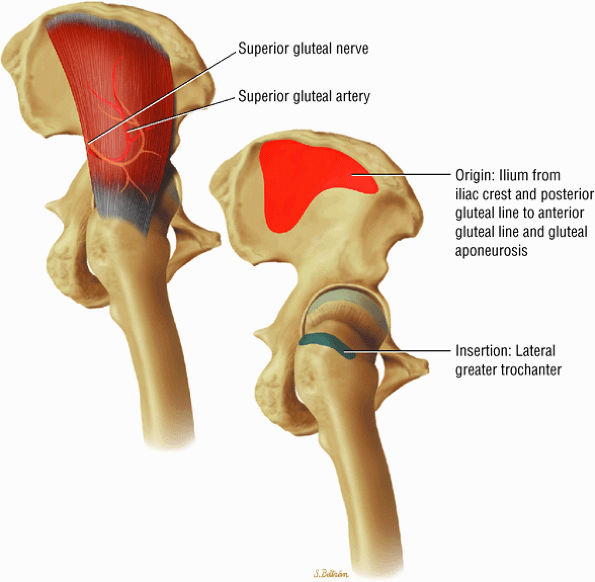
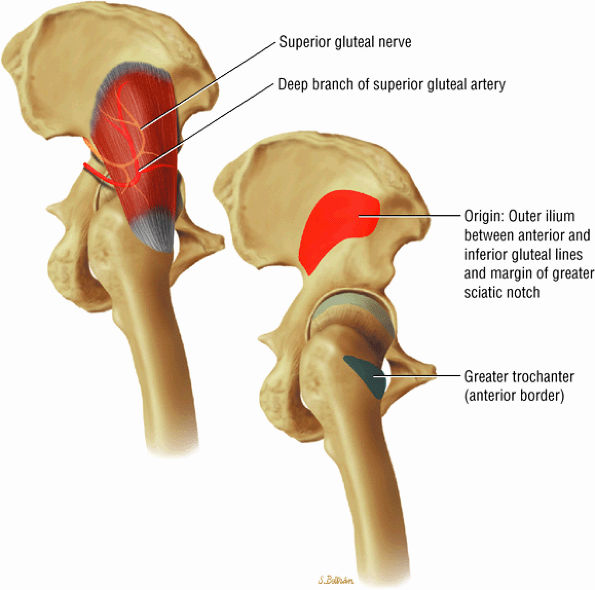
The muscles of the gluteal region, including the gluteus maximus (Fig. 3.15), the gluteus medius (Fig. 3.16), the gluteus minimus (Fig. 3.17), the tensor fasciae latae
P.43P.44P.45P.46P.47P.48P.49P.50P.51P.52P.53P.54P.55P.56P.57P.58
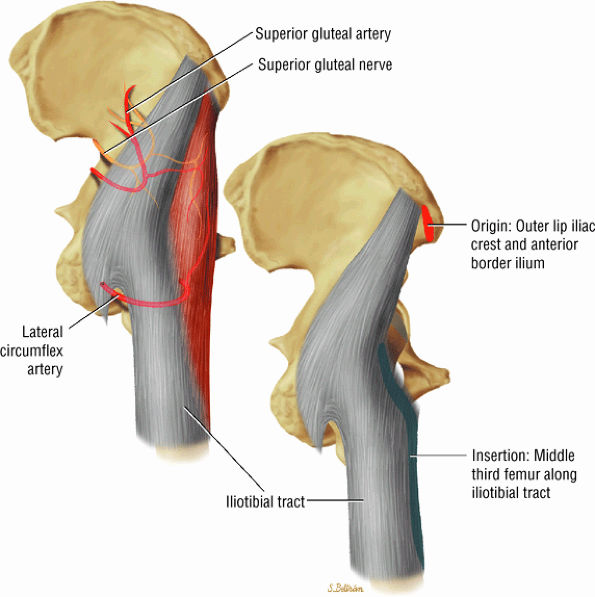
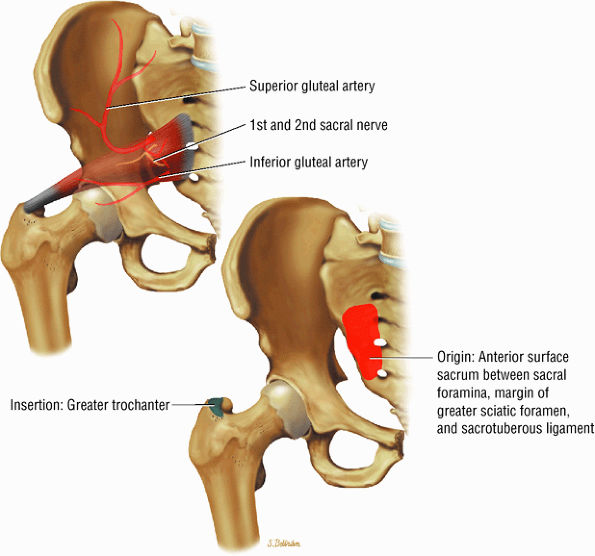
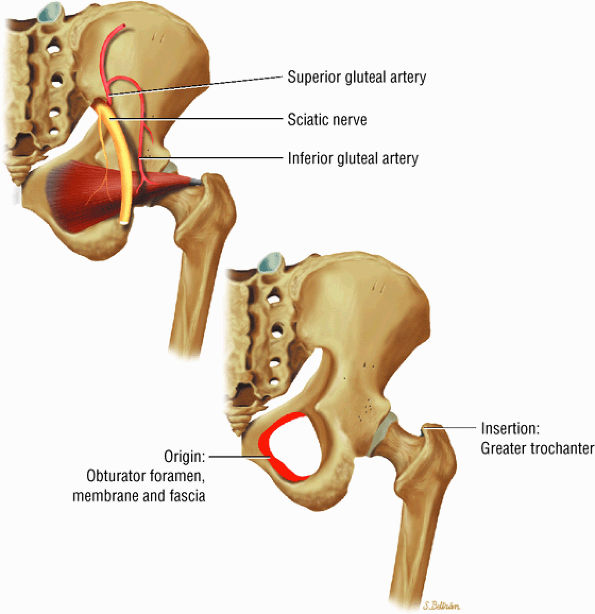
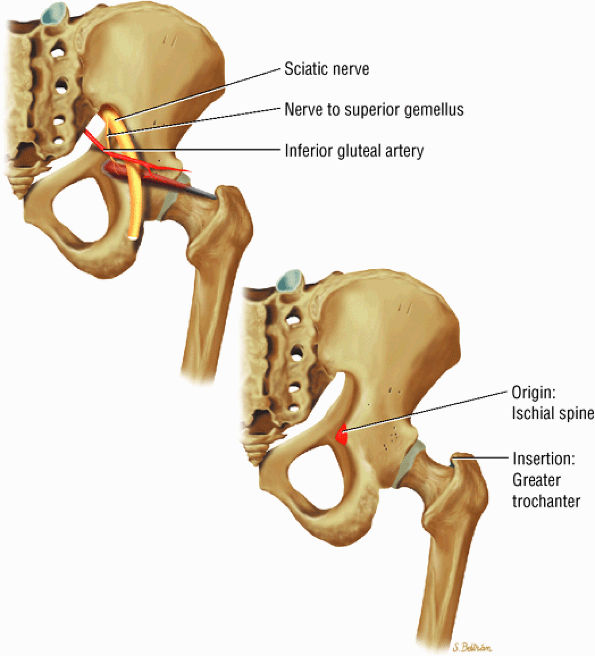
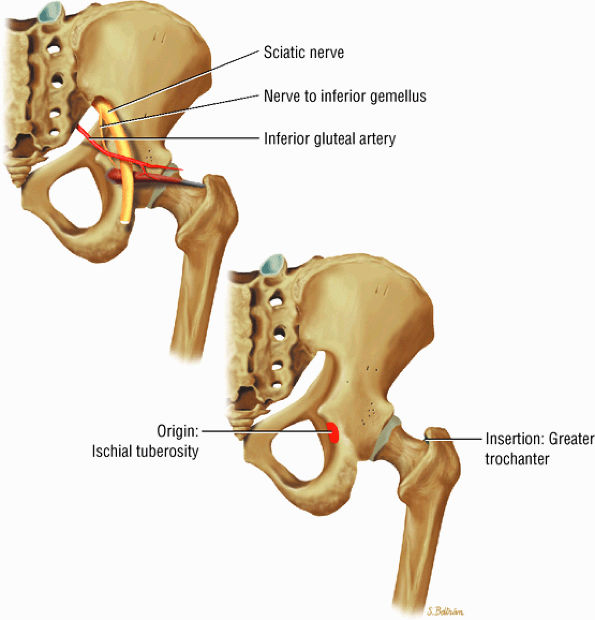
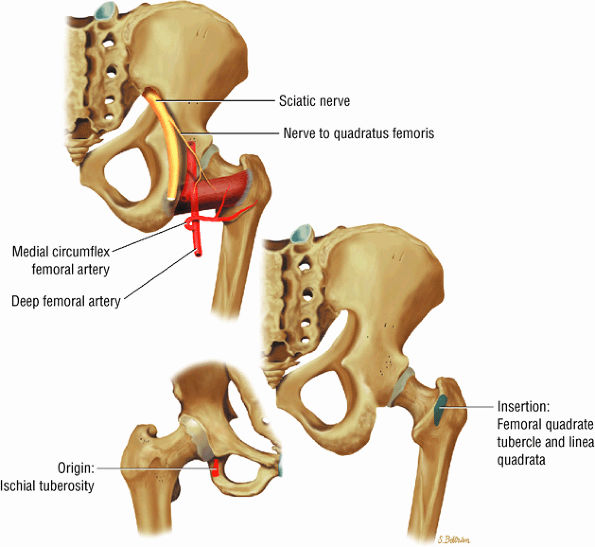
(Fig. 3.18), the piriformis (Fig. 3.19), the obturator internus (Fig. 3.20), the gemellus superior (Fig. 3.21) and gemellus inferior (Fig. 3.22), the quadratus femoris (Fig. 3.23), and the obturator externus (Fig. 3.24) -
The posterior muscles of the thigh, including the biceps femoris (Fig. 3.25), the semimembranosus (Fig. 3.26), and the semitendinosus (Fig. 3.27).
 |
|
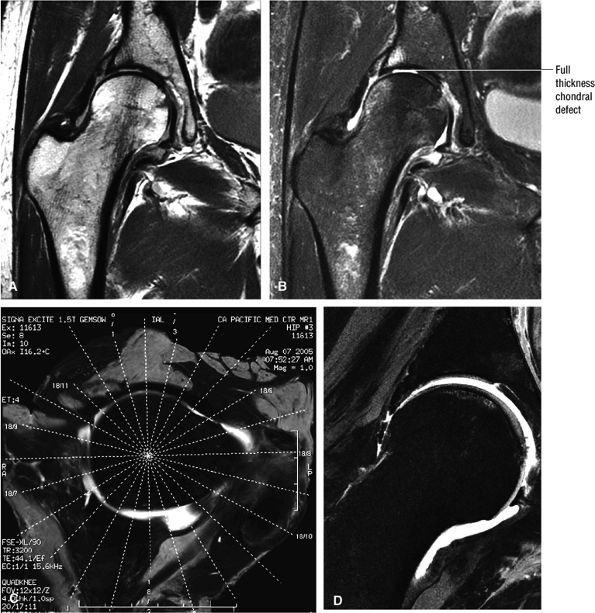
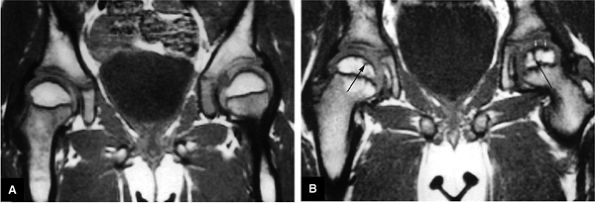
FIGURE 3.1 ● (A, B) Coronal plane images of the hip using a phased-array surface coil. Subtle acetabular sclerosis is identified on the coronal PD FSE image (A), and the full-thickness acetabular roof chondral defect is conspicuous on the FS PD FSE images (B and D). Although PD-weighted images are used more frequently than T1-weighted images, subchondral sclerosis is more apparent on T1-weighted contrast. (C) Radial image locations are prescribed from this FS PD FSE axial image centered on the femoral head. (D) High-resolution coronal FS PD FSE image (MR arthrogram) showing the potential to separate chondral surfaces of the acetabulum and femoral head.
|
 |
|
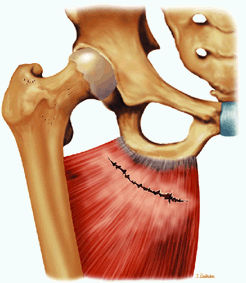
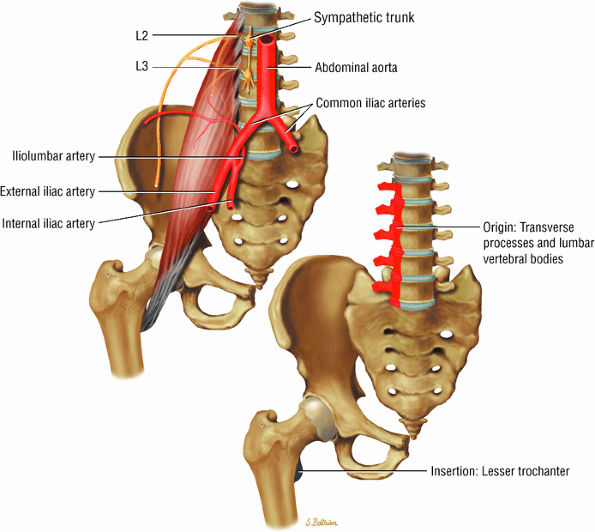
FIGURE 3.2 ● PSOAS MAJOR The psoas major flexes the femur (thigh) and vertebral spine on the pelvis when the leg is fixed. The psoas major and iliacus form the iliopsoas muscle group. Iliopsoas muscle tendon strain is the result of forceful contraction of the iliopsoas when the thigh is fixed or in the extended position.
|
 |
|
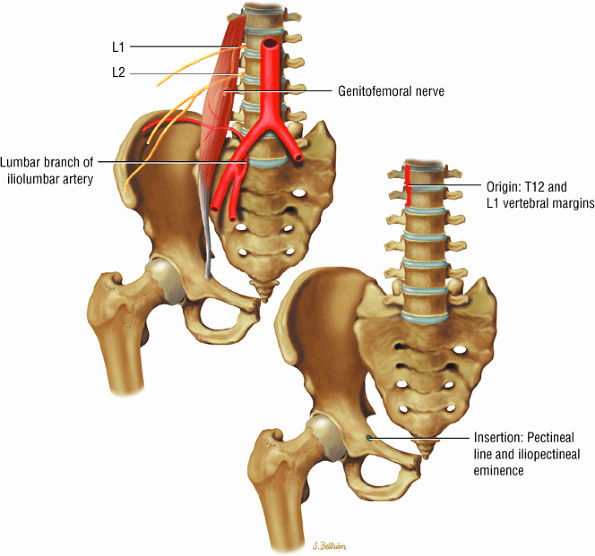
FIGURE 3.3 ● PSOAS MINOR The psoas minor flexes the pelvis on the spine and assists the psoas major in flexing the spine. The psoas minor may be absent in 40% of individuals.
|
 |
|
FIGURE 3.4 ● ILIACUS The iliacus muscle flexes the femur (thigh) and tilts the pelvis anteriorly when the leg is fixed.
|
 |
|
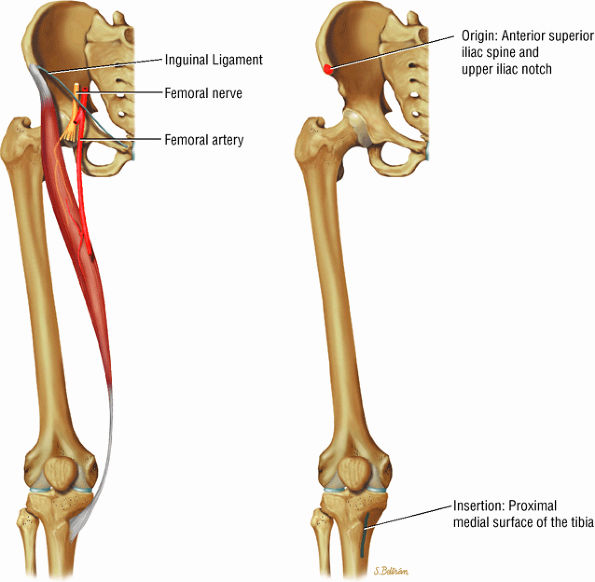
FIGURE 3.5 ● SARTORIUS The sartorius flexes and externally rotates the hip and flexes the leg on the thigh. The anterior superior iliac spine at the origin of the sartorius is a common location for an avulsion fracture. These injuries are usually seen in athletes (sprinters, jumpers, soccer players, and football players).
|
 |
|
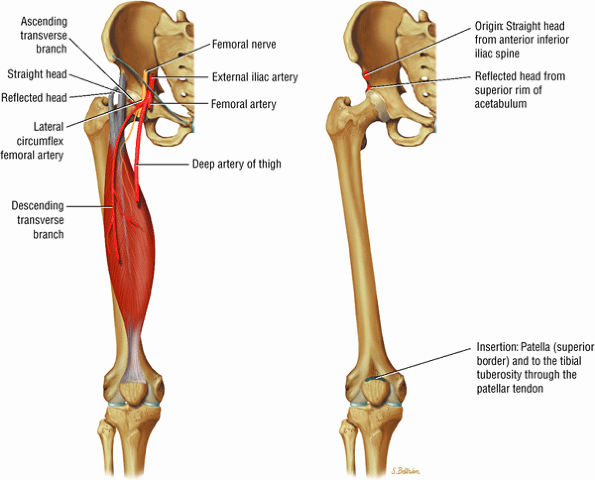
FIGURE 3.6 ● RECTUS FEMORIS The rectus femoris flexes the thigh (hip) and extends the leg (knee). Of the four quadriceps muscles (the vastus lateralis, vastus medialis, vastus intermedius, and rectus femoris), only the rectus femoris has an origin that crosses the hip joint. Soccer, football, and basketball players and track and field athletes are at risk for distal musculotendinous junction injuries and proximal intrasubstance tears of the musculotendinous junction of the indirect head of the rectus.
|
 |
|
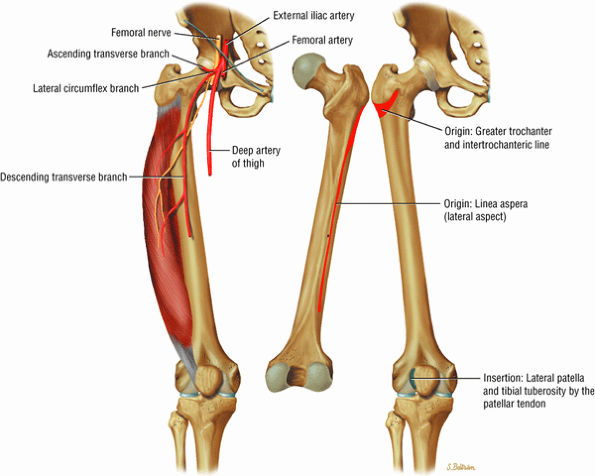
FIGURE 3.7 ● VASTUS LATERALIS The vastus lateralis extends the leg and flexes the thigh (hip) and is one of the quadriceps muscles (vastus lateralis, vastus medialis, vastus intermedius, and rectus femoris). Quadriceps muscle fibers are predominantly type II and are adapted for rapid forceful activity. The vastus lateralis obliquus (VLO) fibers of the vastus lateralis muscle interdigitate with the lateral intermuscular septum and insert onto the patella. In a lateral retinacular release, the VLO may be selectively sectioned without involving the main vastus lateralis tendon proper.
|
 |
|
FIGURE 3.8 ● VASTUS MEDIALIS The vastus medialis extends the leg and pulls the patella medially. The quadriceps muscle group includes the vastus lateralis, the vastus medialis, the vastus intermedius, and the rectus femoris. The quadriceps muscles converge distally, forming the quadriceps tendon, which inserts on the proximal pole of the patella. The vastus medialis assists in preventing patellar dislocations and may be weak in patellofemoral disorders. Therefore, vastus medialis obliquus injuries are frequently associated with transient patellar dislocation.
|
 |
|
FIGURE 3.9 ● VASTUS INTERMEDIUS The vastus intermedius extends the leg and covers the articularis genu. Quadriceps (vastus lateralis, vastus medialis, vastus intermedius, and rectus femoris) injuries, including strains and tendon ruptures, result from eccentric muscle contractions. The articularis genu muscle represents a few separate muscle fibers deep to the vastus intermedius and is responsible for contracting the knee joint capsule superiorly in extension.
|
 |
|
FIGURE 3.10 ● GRACILIS The gracilis muscle adducts the thigh and flexes and internally rotates the leg and can be used for anterior cruciate ligament reconstructions. The gracilis is the one muscle of the medial aspect adductors of the thigh that does not attach to the linea aspera of the femur (as opposed to the adductor longus, magnus, and brevis and pectineus muscles).
|
 |
|
FIGURE 3.11 ● PECTINEUS The pectineus muscle adducts, flexes, and medially rotates the thigh. The adductor muscles, the pectineus, and the gracilis represent the muscles of the medial aspect of the thigh.
|
 |
|
FIGURE 3.12 ● ADDUCTOR LONGUS The adductor longus adducts and assists in the flexion of the thigh. The adductor group muscles (longus, magnus, and brevis) originate at the symphysis pubis and inferior pubic ramus and insert on the linea aspera of the femur.
|
 |
|
FIGURE 3.13 ● ADDUCTOR BREVIS The adductor brevis muscle adducts and assists in flexing the thigh.
|
 |
|
FIGURE 3.14 ● ADDUCTOR MAGNUS The adductor magnus adducts the femur (thigh). The proximal portion flexes the thigh and the distal portion extends it.
|
 |
|
FIGURE 3.15 ● GLUTEUS MAXIMUS The gluteus maximus extends the thigh and assists in adduction and lateral rotation of the femur (thigh). Trunk extension is accomplished by action on its insertion.
|
-
The fibrocartilaginous limbus, or acetabular labrum, is visualized as a low-signal-intensity triangle interposed between the superolateral aspect of the femoral head and the inferolateral aspect of the acetabulum.
-
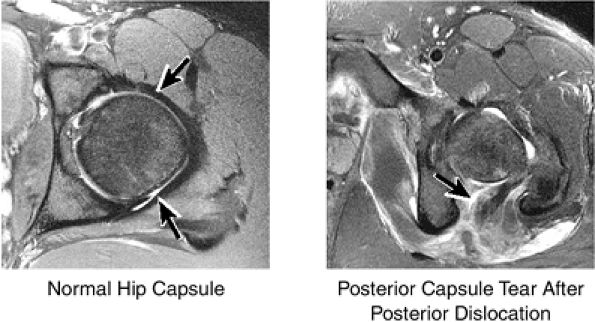
The joint capsule is visualized as a low-signal-intensity structure circumscribing the femoral neck. In the presence of fluid, the capsule distends and the lateral and medial margins become convex.
-
Anterior coronal images demonstrate that the articular cartilage of the femoral head can be seen medially at the ligamentum teres insertion site. The reflected head of the rectus femoris is shown lateral to the proximal portion of the iliofemoral ligament.
-
Anteriorly, the iliopsoas muscle and tendon are in a 7-o—clock position relative to the femoral head.
-
The low-signal-intensity iliofemoral ligament is present on the lateral aspect of the femoral neck, near the greater trochanter.
-
The superior acetabular labrum is located deep to the proximal portion of the iliofemoral ligament along the lateral inferior margin of the acetabulum. The orbicular zone may be identified as a small outpouching on
P.59P.60P.61P.62P.63P.64P.65P.66P.67P.68
the medial aspect of the junction of the femoral head and neck. -
The intraarticular femoral fat pad is located between the medial femoral head and the acetabulum and displays increased signal intensity on T1-weighted images.
-
The obturator externus muscle crosses the femoral neck on posterior coronal images.
-
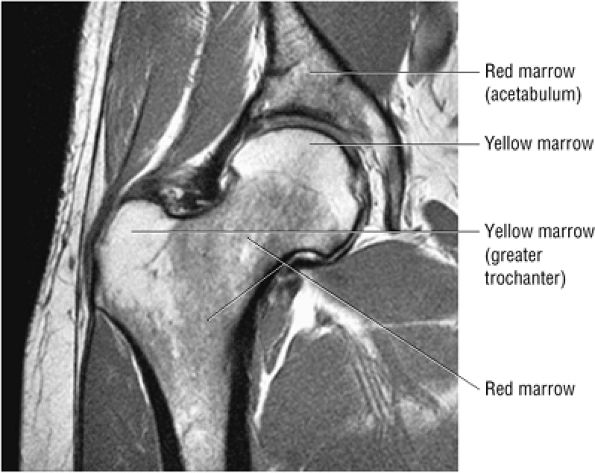
Inhomogeneity of marrow signal intensity in the acetabulum, ilium, and ischium is a normal finding on T1-weighted images, representing normal red and yellow marrow inhomogeneity.
 |
|
FIGURE 3.16 ● GLUTEUS MEDIUS The gluteus medius abducts and medially rotates the thigh when the extremity is extended.
|
 |
|
FIGURE 3.17 ● GLUTEUS MINUMUS The gluteus minimus abducts and medially rotates the thigh when the extremity is extended.
|
 |
|
FIGURE 3.18 ● TENSOR FASCIAE LATAE The tensor fasciae latae assists in flexion, abduction, and medial rotation of the femur (thigh) and counteracts the posterior pull of the gluteus maximus on the iliotibial tract.
|
 |
|
FIGURE 3.19 ● PIRIFORMIS The piriformis rotates the femur (thigh) laterally and abducts the thigh in flexion.
|
 |
|
FIGURE 3.20 ● OBTURATOR INTERNUS The obturator internus rotates the femur (thigh) laterally and abducts the femur in flexion.
|
 |
|
FIGURE 3.21 ● GEMELLUS SUPERIOR The gemellus superior rotates the femur (thigh) laterally.
|
 |
|
FIGURE 3.22 ● GEMELLUS INFERIOR The gemellus inferior rotates the femur (thigh) laterally.
|
 |
|
FIGURE 3.23 ● QUADRATUS FEMORIS The quadratus femoris adducts and rotates the femur (thigh) laterally.
|
 |
|
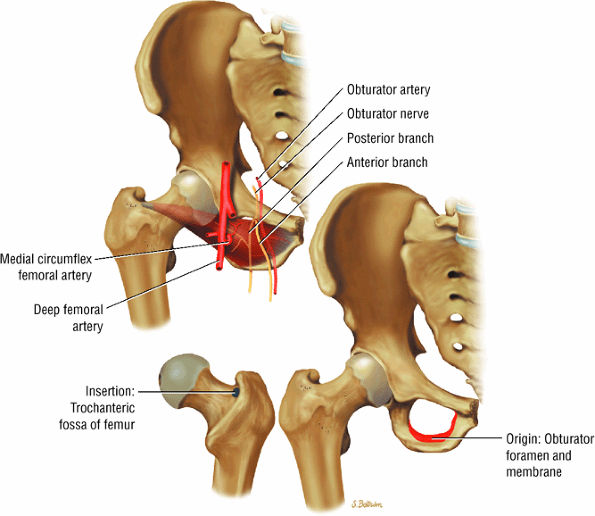
FIGURE 3.24 ● OBTURATOR EXTERNUS The obturator externus adducts and rotates the femur (thigh) laterally.
|
 |
|
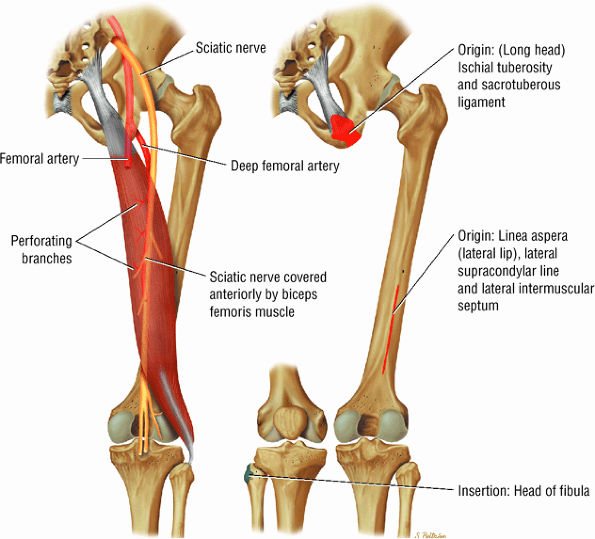
FIGURE 3.25 ● BICEPS FEMORIS The biceps femoris extends the thigh and flexes the leg in external rotation of the tibia, contributing to lateral stability of the knee. The muscles of the hamstring group (biceps femoris, semimembranosus, and semitendinosus), except for the short head of the biceps femoris, all cross the hip and the knee joint. Musculotendinous junctions extend the entire length of the muscle and serve as potential sites for strains. The short head is innervated by the peroneal branch of the sciatic nerve; the other hamstring muscles derive innervation from the tibial branch of the sciatic nerve.
|
 |
|
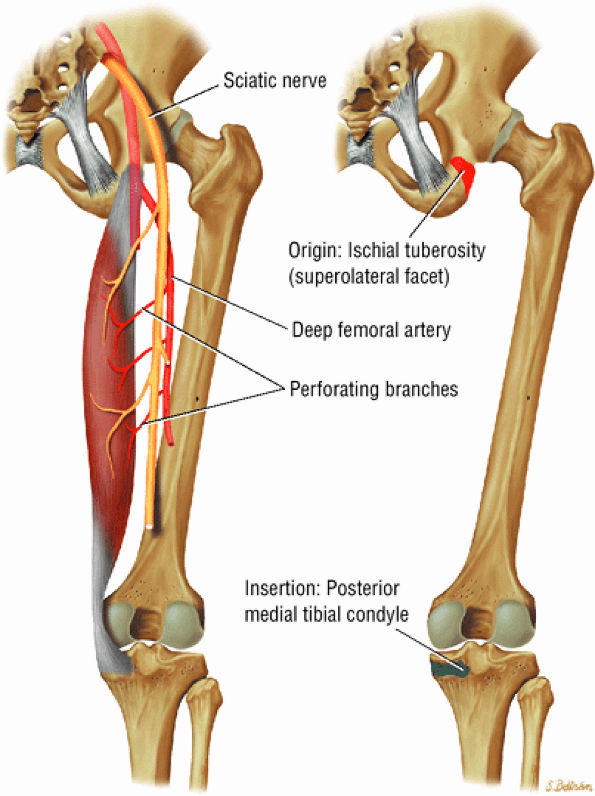
FIGURE 3.26 ● SEMIMEMBRANOSUS The semimembranosus extends the thigh and flexes the leg. It is part of the hamstring muscle group (biceps femoris, semimembranosus, and semitendinosus) in the posterior thigh. Except for the short head of the biceps, the origins of the hamstring tendons are from the ischial tuberosity and are involved in ischial avulsion fractures in the young athlete.
|
-
The hip musculature demonstrates intermediate signal intensity on T1-weighted images. The gluteal muscles—the gluteus medius laterally, the gluteus minimus deep, and the gluteus maximus posteriorly—can be differentiated from one another by high-signal-intensity fat along fascial divisions. The tensor fasciae latae muscle is seen anterior to the gluteus medius and is bordered anteriorly by subcutaneous fat. The iliopsoas muscle group is anterior to the femoral head in a 12-o—clock position. The sartorius muscle is the most anterior, and the rectus femoris is positioned between the more lateral tensor fasciae latae and the medial iliopsoas. The obturator internus muscle is visualized medial to the anterior and posterior acetabular columns.
-
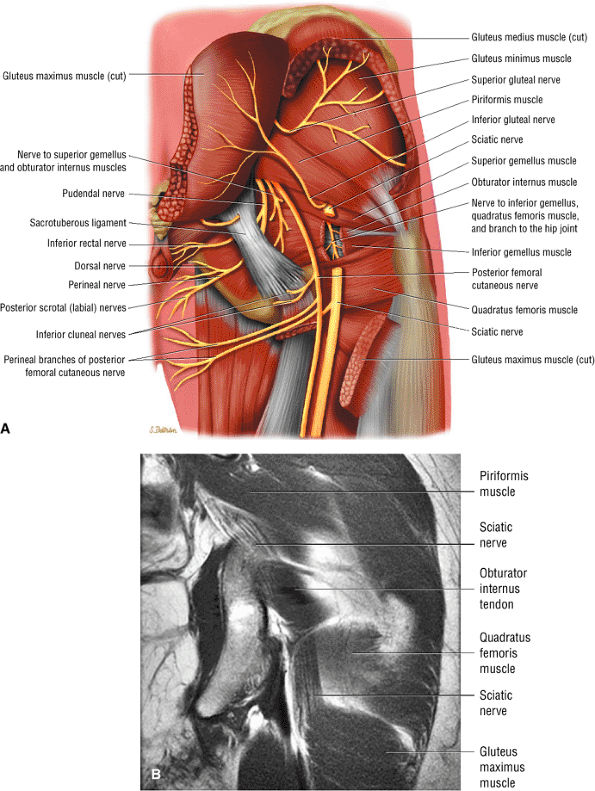
The sciatic nerve, located directly posterior to the posterior column of the acetabulum, demonstrates intermediate signal intensity. It exits the pelvis through the greater sciatic foramen (the greater sciatic foramen is bordered by the ilium, the rim of the greater sciatic notch, the sacrotuberous ligament, and the sacrospinous ligament) inferior to the piriformis muscle.
-
Entrapment of the sciatic nerve at this location may be associated with the piriformis syndrome. Asymptomatic hypertrophy of the piriformis muscle in this syndrome is best appreciated on axial images. The piriformis originates from the anterior sacrum and greater sciatic notch and inserts on the upper border of the greater trochanter. The piriformis divides the greater sciatic foramen into superior and inferior portions.
-
The external iliac vessels, which are of low signal intensity, are medial to the iliopsoas muscle and anterior to the anterior acetabular column.
-
The low-signal-intensity tendon of the rectus femoris blends with the low-signal-intensity cortex of the anterior inferior iliac spine. The tendon of the reflected head of the rectus femoris muscle is anterolateral to the iliofemoral ligament and follows the contours of the lateral acetabulum.
-
At the level of the femoral head, the more distal femoral artery and vein are visualized.
-
The femoral head articular cartilage demonstrates intermediate signal intensity, and the anterior and posterior fibrocartilaginous acetabular labrum may also be identified at this level. The acetabular labrum is triangular, with the apex oriented laterally.
-
At the level of the greater trochanter and femoral neck, the obturator internus is identified medial to the pubis and ischium.
-
The iliofemoral ligament is of low signal intensity and blends with the dark (i.e., low signal intensity) cortex of the anterior femoral neck.
-
The sciatic nerve, lateral to the ischial tuberosity, is encased in fat between the quadratus femoris muscle anteriorly and the gluteus maximus muscle posteriorly.
-
The iliotibial tract can be seen peripherally as a thin, low-signal-intensity band surrounded by high-signal-intensity fat on the medial and lateral surfaces.
-
The low-signal-intensity obturator vessels are encased in high-signal-intensity fat and can be identified posterolateral to the pubic bone, between the pectineus and obturator internus muscles.
-
The adductor muscles anteromedially, the obturator externus and the quadratus femoris muscles medially, the ischial tuberosity attachment of the long head of the biceps femoris, and the semitendinosus tendons posteriorly can be visualized at the level of the proximal femur.
-
The ischiofemoral ligament is identified anterior to the quadratus femoris, medial to the ischium, and applied to the posterior hip capsule.
-
The sacrotuberous ligament is seen posteromedial to the ischium.
 |
|
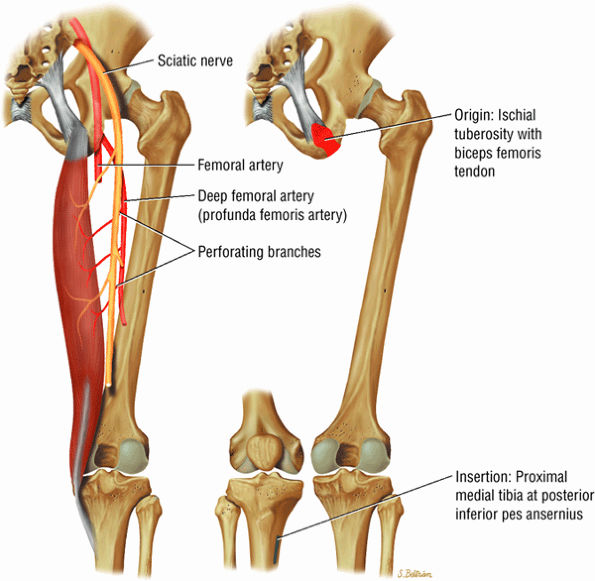
FIGURE 3.27 ● SEMITENDINOSUS The semitendinosus, which is part of the hamstring muscle group, extends the thigh and flexes the leg. It may be used for anterior cruciate ligament reconstructions, posterolateral knee reconstructions, and tenodesis for patellar subluxation. It is the most posteromedial tendon on axial knee images at the joint line. Hip hyperflexion and simultaneous knee extension is a mechanism of injury for proximal hamstring injuries in adults and apophyseal avulsions in young skeletally immature athletes.
|
|
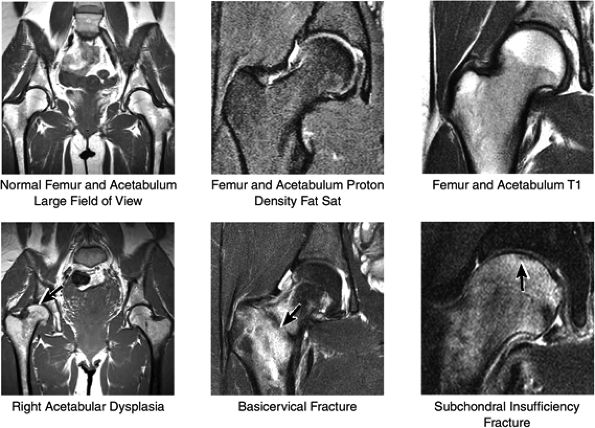
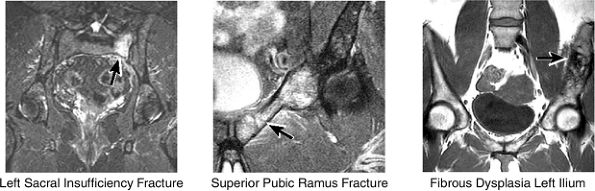
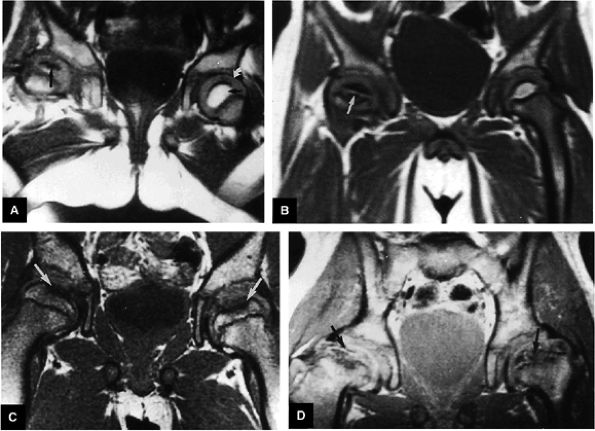
FIGURE 3.28 ● Normal coronal anatomy of the hip. (A, B) In the setting of pubic rami fractures, the sacrum and sacroiliac joints should be examined for the presence of fractures or a diastasis completing the pelvic ring fracture. (C, D) Sacral insufficiency fractures or sacroiliitis is seen only on images with a large field of view. Occasionally they are the only significant finding in a patient with unilateral hip pain. (E, F) Images with a large field of view should also be used to examine the pelvic viscera, especially in women, for adenopathy, masses, and adnexal or uterine pathology. (G, H) Articular cartilage covering the acetabulum and femoral head is clearly displayed. A small portion of the medial femoral head (the fovea) and a large portion of the medial acetabulum (the acetabular fossa) are devoid of cartilage. (I, J) Early signs of degenerative arthrosis may be seen in the anterior superior quadrant of the hip, including cartilage thinning and fraying, subchondral edema in the anterosuperior acetabulum, and anterosuperior labral tearing. (K, L) The anterior superior portions of the bilateral acetabuli are visualized on images obtained with a large field of view. These images allow appreciation of subtle differences in symmetry of the acetabular contour. Even mild acetabular dysplasia may be accompanied by unilateral labral tears and chondral degeneration. (M, N) Osseous spurring at the symphysis pubis is a common finding. Occasionally, acute or insufficiency fractures occur immediately to the left or right of the symphysis pubis, and are seen only on images obtained with a large field of view.
|
|
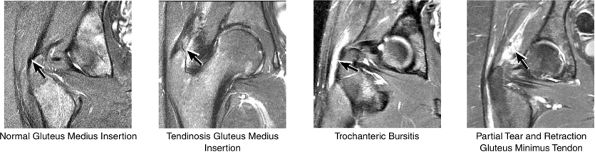
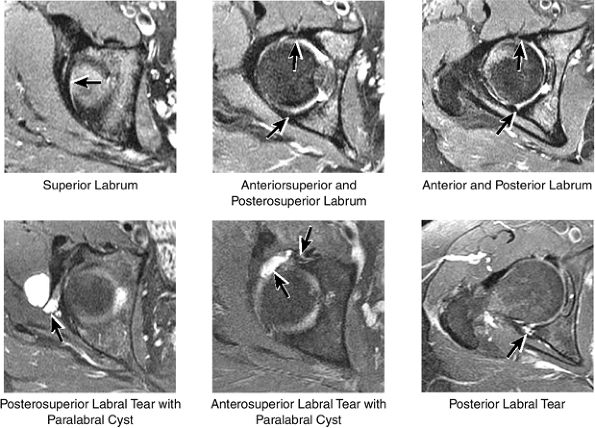
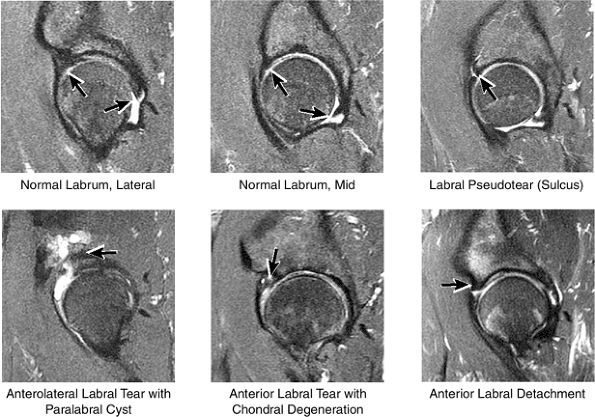
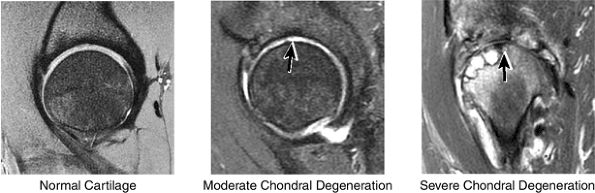
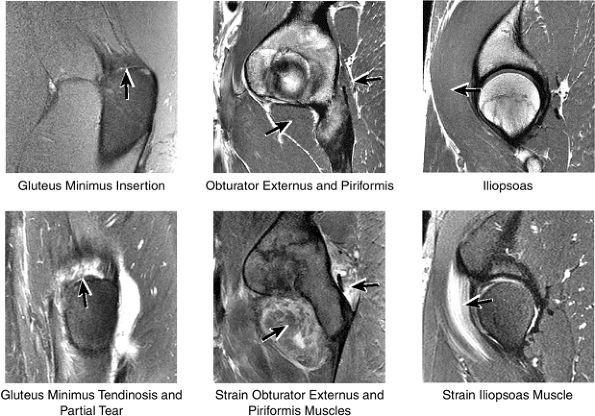
FIGURE 3.29 ● Normal axial anatomy of the hip. (A, B) At this level, the sciatic nerve can be seen exiting the sciatic foramen, deep to the piriformis muscle. Asymmetric enlargement of the piriformis muscle or masses in this region can cause impingement of the sciatic nerve, the so-called piriformis syndrome. (C, D) At this level the transition from the acetabular roof to the top of the femoral head is visualized. The thin arc of dark signal along the lateral margin of the acetabular roof represents the superior margin of the labrum. High signal in the superior labrum can be identified as a labral tear, and accompanying paralabral cysts are commonly identified extending superficial to the labrum. (E, F) The anterior labrum and the posterior labrum on axial images are identified as dark-signal triangles at the lateral margin of the acetabuli. Labral tears present as linear or irregular fluid signal extending through the substance of the labrum, or as expansion of the labrum by fluid signal extending to the surface of the labrum. Fluid signal interposed between the labrum and the acetabulum at the labral attachment indicates labral detachment.(G, H) Tendinosis of the gluteus medius and minimus insertions on the greater trochanter is visualized as thickening and increased signal of the tendons. Trochanteric bursitis can be identified either superficial or deep to the gluteus medius and minimus insertions. (I, J) A fluid collection anteromedial or anterolateral (or both) to the iliopsoas tendon is compatible with iliopsoas bursitis. Occasionally, iliopsoas bursitis may be present adjacent to an anterior labral tear, in which case it may be difficult to distinguish from a paralabral cyst. (K, L) The common hamstring origin on the ischium comprises the biceps femoris and semitendinosus tendons. The common hamstring tendon is a frequent site for tendinosis or partial tears, and the pathology is commonly symmetric.
|
-
The tendon of the obturator externus is anterior and inferior to the greater trochanter.
-
The piriformis tendon is situated between the iliofemoral ligament anteriorly and the gluteus medius tendon posteriorly.
-
The iliofemoral ligament extends inferiorly, directly anterior to the anterior acetabular labrum.
-
The iliopsoas muscle and tendon course obliquely anterior to the iliofemoral ligament, anterior to the femoral head.
-
The ischiofemoral ligament is closely applied to the surface of the posterior femoral head, anterior to the inferior gemellus muscle and obturator internus tendon.
-
The femoral physeal scar is seen as a horizontal band of low signal intensity in an anterior-to-posterior orientation.
asymmetry in acetabular contour. Acetabular dysplasia is associated with labral tears and early osteoarthritis (OA), a condition known as lateral rim syndrome. Even a mildly abnormal shallow acetabulum predisposes to the development of premature degenerative chondral changes and labral tears. A shallow acetabulum is best visualized on anterior coronal images. Marrow signal throughout the pelvis and femur is often heterogeneous, as the pelvis is a common reservoir for red marrow.
|
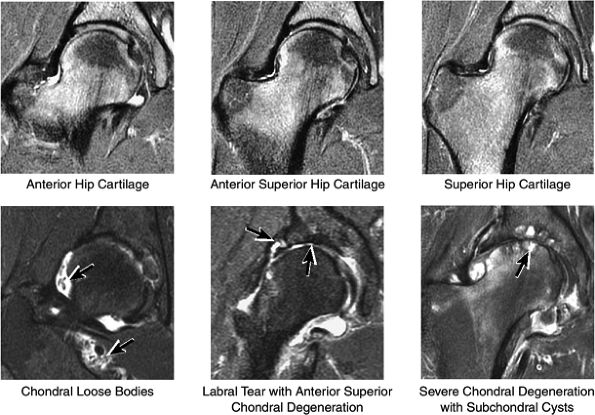
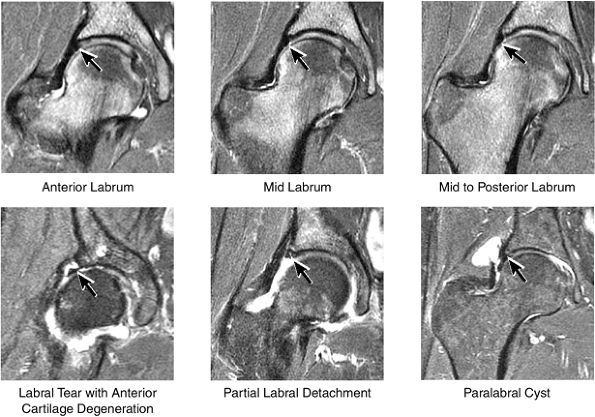
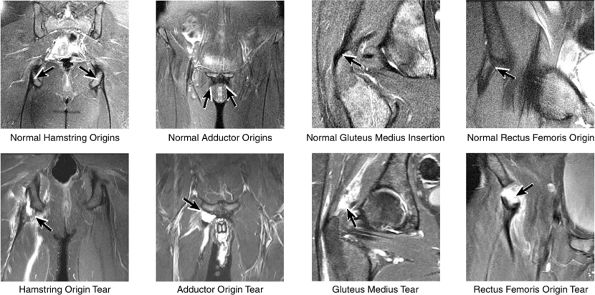
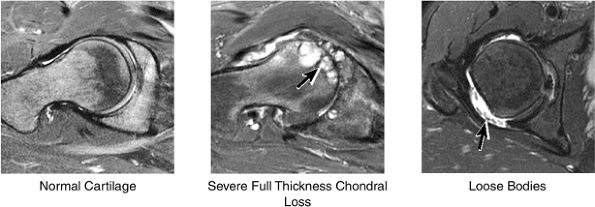
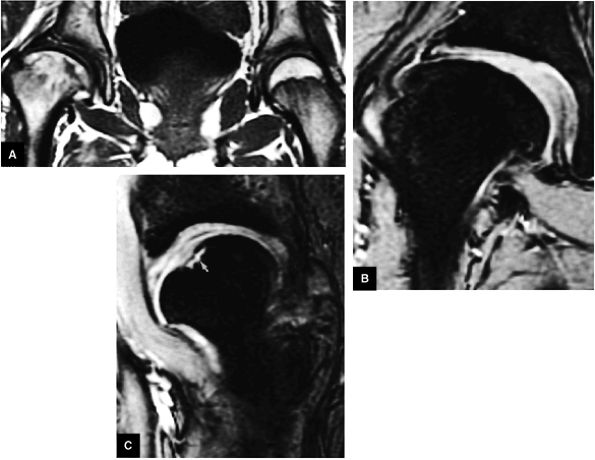
FIGURE 3.30 ● Normal sagittal anatomy of the hip. (A and B) On medial sagittal images, the course of the obturator internus, piriformis, and the adductor muscles can be followed and analyzed for strain injury or tears. (C and D) Tendinosis and tears of the common hamstring tendon origin on the ischial tuberosity are optimally viewed at this location and are extremely common in middle aged and elderly patients. (E and F) Although thinning and fraying of the articular cartilage can occur anywhere in the joint, chondral degeneration is most commonly seen first in the anterior superior quadrant, often accompanied by anterior labral tears, subchondral edema, and cystic change in the anterior acetabulum. When any one of these findings is present, a careful search for the others should be performed. (G and H) Linear tears of the anterior labrum can be mimicked by fluid filling a normal recess between the anterior labrum and the anterior joint capsule. Imaging in the axial and coronal planes is used to distinguish between a true tear and the normal recess, since a tear is visualized and confirmed in the axial and coronal planes, whereas a recess is only seen prominently in the sagittal plane. (K and L) The gluteus medius and minimus tendons have been referred to as the “rotator cuff” of the hip. The gluteus medius tendon inserts posteriorly on the greater trochanter, and the gluteus minimus tendon inserts anterolaterally on the greater trochanter. (I and J) Loose bodies commonly lodge in the joint recesses anterior and posterior to the femoral neck (deep to the iliofemoral and ischiofemoral ligaments). They are commonly seen (particularly in the sagittal plane) in patients with chondral degeneration. (M and N) Acute tears of the gluteus medius and minimus often mimic symptoms of a proximal femoral fracture. Chronic partial tears and tendinosis are frequently associated with trochanteric bursitis, and are common in middle-aged and elderly patients.
|
 |
|
FIGURE 3.31 / Femur and Acetabulum.
|
 |
|
FIGURE 3.32 / Hip Cartilage.
|
 |
|
FIGURE 3.33 / Labrum.
|
 |
|
FIGURE 3.34 / Muscle and Tendon Insertions.
|
and the ilium is analyzed for marrow-signal abnormalities, tumor, and fractures. The sacroiliac joints are examined for arthritis, posttraumatic changes, and infection. The sacrum is also a common location for both posttraumatic and insufficiency fractures.
 |
|
FIGURE 3.35 / Greater Trochanter.
|
or secondary to communication with the hip joint. Trochanteric bursitis suspected on coronal images is confirmed on axial images.
 |
|
FIGURE 3.36 / Pelvic Bones.
|
 |
|
FIGURE 3.37 / Labrum.
|
 |
|
FIGURE 3.38 / Cartilage.
|
 |
|
FIGURE 3.39 / Femur.
|
 |
|
FIGURE 3.40 / Muscles.
|
 |
|
FIGURE 3.41 / Iliopsoas.
|
 |
|
FIGURE 3.42 / Hip Capsule.
|
labral tear; to avoid this pitfall, suspected labral tears should be confirmed in all three planes.
 |
|
FIGURE 3.43 / Labrum.
|
 |
|
FIGURE 3.44 / Cartilage.
|
 |
|
FIGURE 3.45 / Femur and Acetabulum.
|
 |
|
FIGURE 3.46 / Muscles.
|
 |
|
FIGURE 3.47 / Sample Hip Case.
|
 |
|
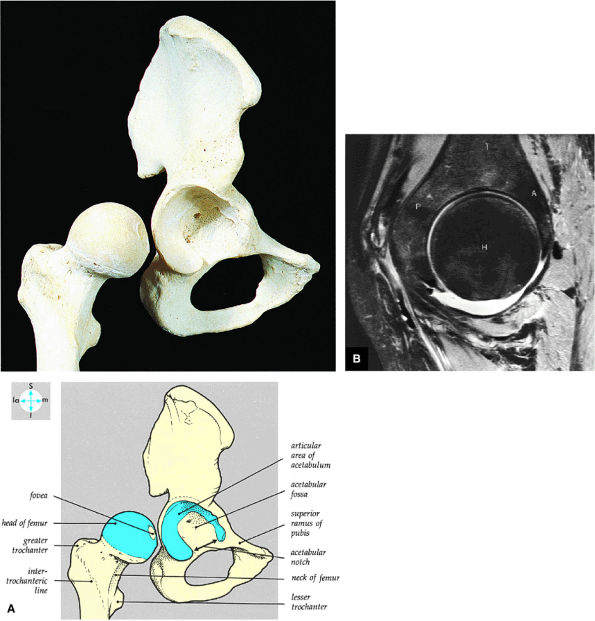
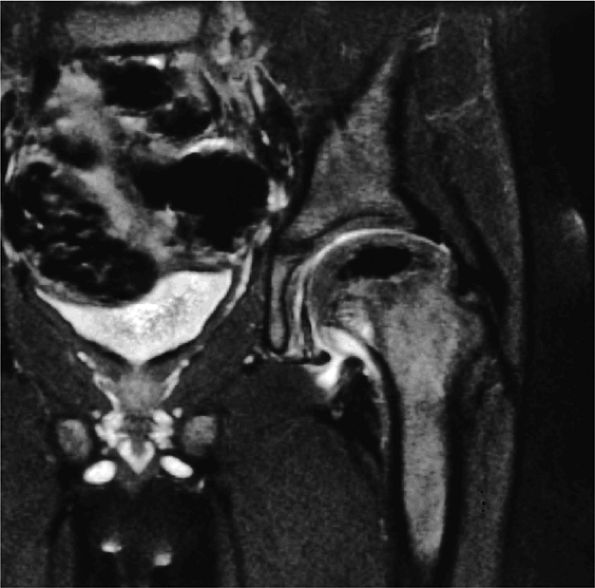
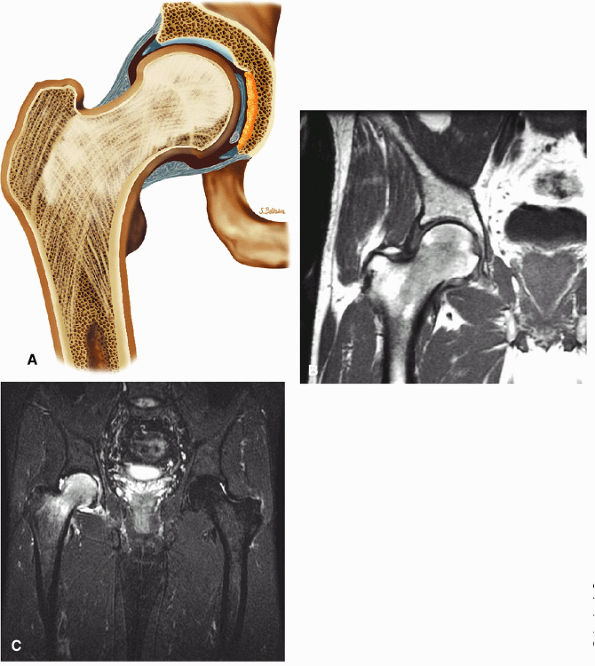
FIGURE 3.48 ● (A) Articular surfaces of the hip joint comprise the acetabulum of the hip bone and the head of the femur. (B) A sagittal MR arthrogram of the hip demonstrating capsular distention and the articular relationship of the femoral head (H) to the anterior (A) and posterior (P) aspects of the acetabulum and ilium (I). Fat-suppressed T2-weighted fast spin-echo.
|
-
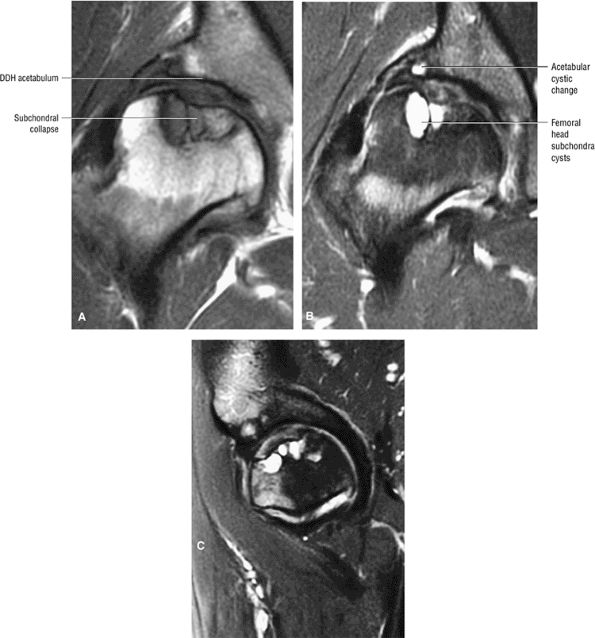
Degenerative arthritis of the right hip, with severe anterior superior chondral loss, anterior and superior labral tearing, an adjacent large paralabral cyst, and subchondral cystic changes involving the anterior acetabulum
-
Dysplastic bump in the anterolateral femoral head-neck junction associated with cam-type femoroacetabular impingement
-
No evidence of avascular necrosis
-
The stellate lesion or crease represents a normal bare area superior to the acetabular fossa.
-
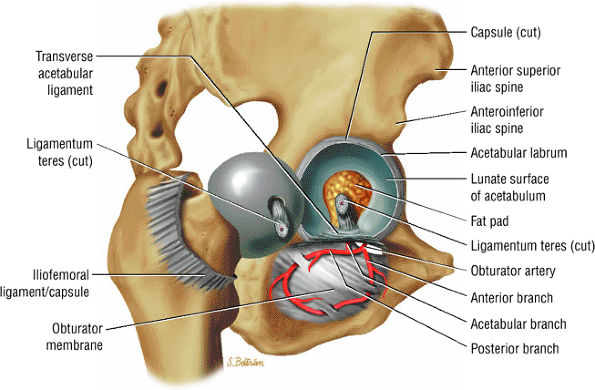
The transverse acetabular ligament bridges the incomplete acetabular ring inferiorly. The acetabular labrum ends at the anterior and posterior margins of the inferior aspect of the acetabulum.
-
Normal labral variants are visualized posteroinferiorly, anterosuperiorly at the junction of the transverse ligament and labrum, and between the capsule and labrum lateral to the acetabular rim.
-
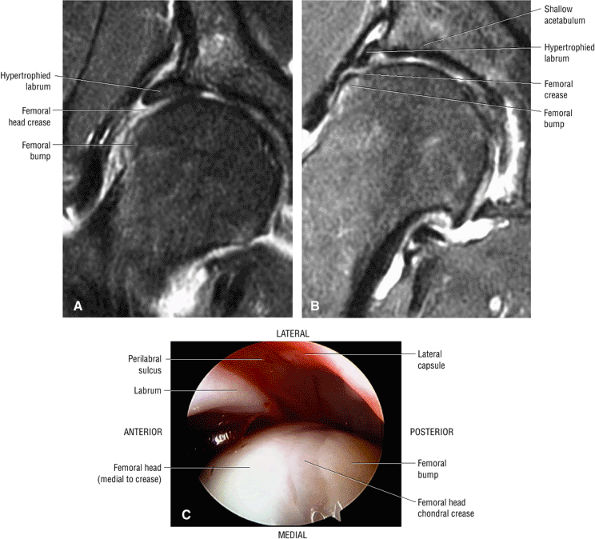
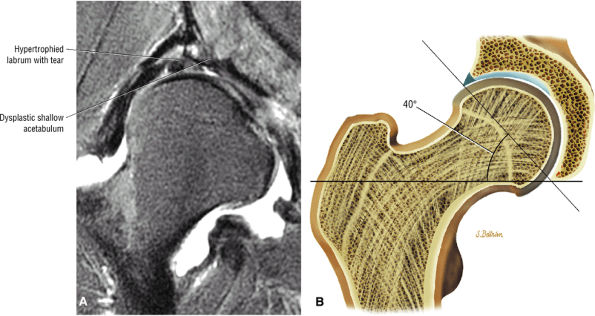
In DDH the labrum may be hypertrophic and associated with a femoral head chondral crease.
-
The sciatic nerve sheath contains two peripheral nerves: the tibial and common peroneal nerves.
-
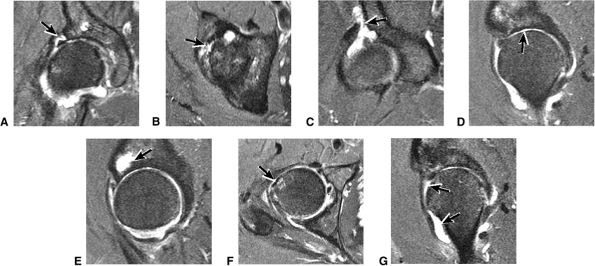
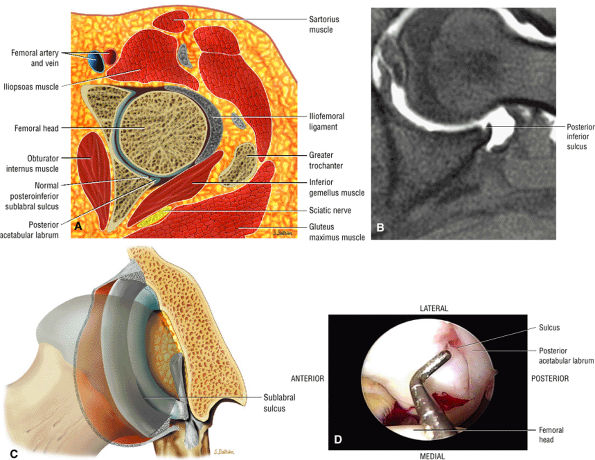
The posterior inferior sublabral sulcus (Fig. 3.60) should not be misinterpreted as a posterior labral tear on axial images.15,16 When depicted, this sublabral groove is seen on one or two axial oblique images superior to the transition between the transverse ligament and the posteroinferior labrum. This sulcus is in fact characterized as a labrocartilaginous cleft and can be shown arthroscopically.
-
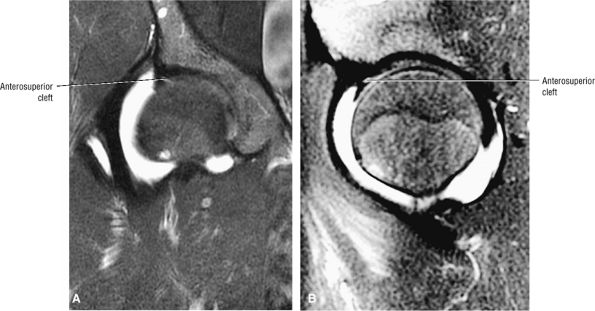
An anterosuperior cleft (Fig. 3.61) may be seen as a normal variant in the presence of a normal lateral acetabular labrum. On anterior coronal or sagittal images, this cleft is seen as a partial undercutting of the labrum on a single image. The extension of fluid into this cleft occurs from the femoral side. It may be more commonly seen in labral hypertrophy associated with mild developmental dysplasia of the hip (DDH).
-
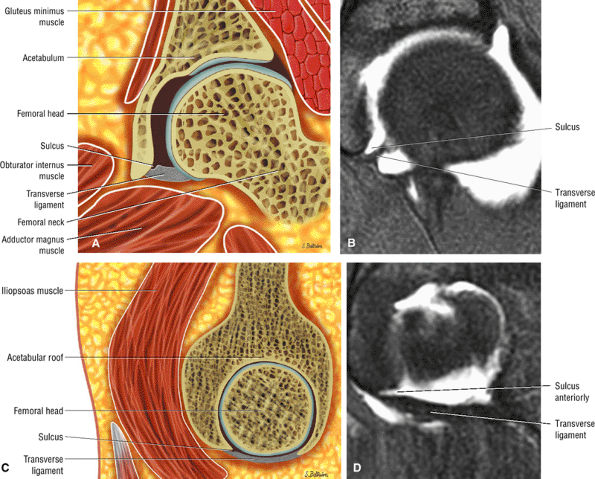
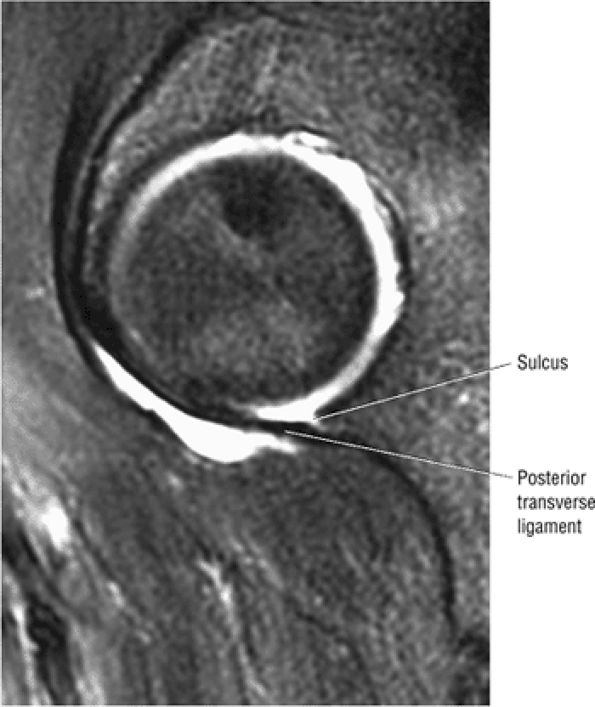
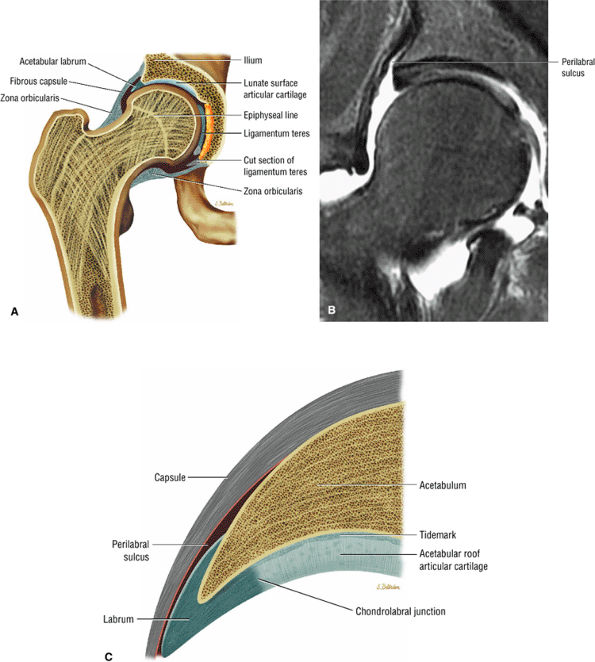
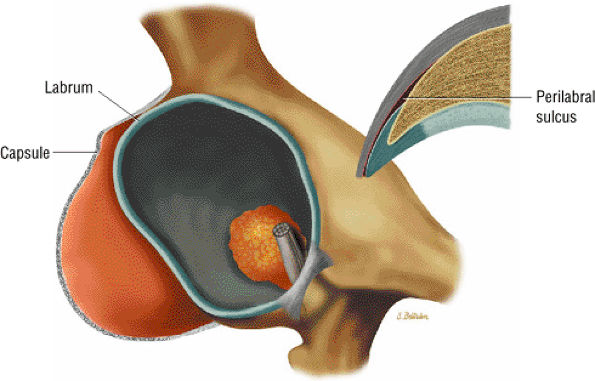
A transverse ligament-labral junction sulcus is a normal sulcus or recess that may be seen between the transverse ligament and the labrum either anteriorly (Fig. 3.62) or posteriorly (Fig. 3.63). The perilabral sulcus (Fig. 3.64) represents a normal space between the acetabular labrum and capsule visualized on coronal images. The capsule attaches directly to the osseous rim of the acetabulum. A normal sulcus may exist at the junction of the transverse ligament and labrum (see Fig. 3.62) on medial sagittal images. A normal perilabral sulcus is present on coronal images between the capsules and labrum and does not represent a pathologic detachment. This sulcus is a distinct and normal potential separation from the labrum (Fig. 3.65). The
P.102P.103P.104
perilabral sulcus is more conspicuous on MR arthrography. In comparison and contrast with the glenohumeral joint of the shoulder, the acetabular labrum of the hip is not critical in providing stability. However, it does maintain a role in creating the vacuum seal of the hip joint. -
An enlarged or hypertrophied labrum may occur in patients with mild DDH.17 We have observed a femoral head chondral crease (Fig. 3.66) in these patients, creating a demarcation trough medial to a femoral head bump immediately proximal to the physeal scar. Patients who demonstrate femoroacetabular impingement (or lateral acetabular rim syndrome in DDH) also have direct impingement between the lateral acetabular labrum and the femoral head.
 |
|
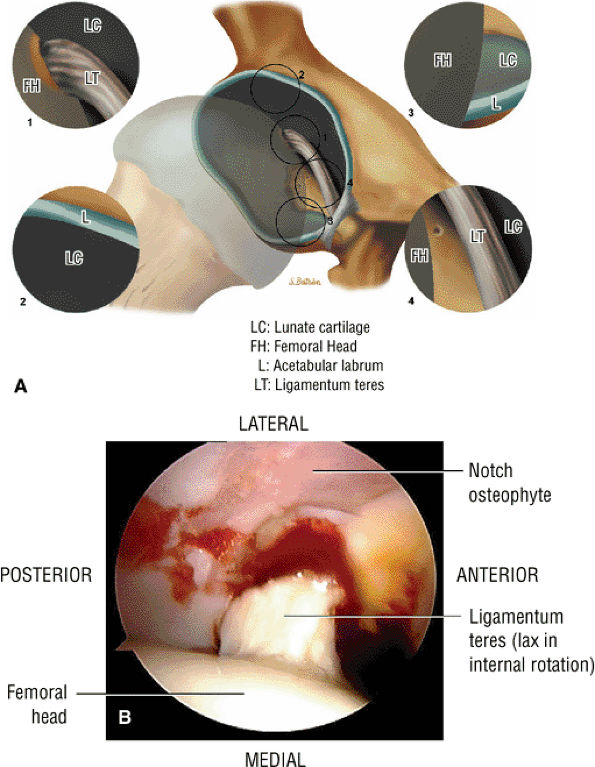
FIGURE 3.49 ● A normal cortical articular ridge of the acetabulum (arrow) is seen on (A) T2*-weighted coronal and (B) 3D CT images. This bony ridge should not be mistaken for osseous pathology. The acetabular notch (open arrow) is shown on the 3D CT rendering. (A: TR, 400 msec; TE, 20 msec; flip angle, 25°). (C) Arthroscopic view of acetabular notch.
|
 |
|
FIGURE 3.50 ● (A) Arthroscopic anatomy demonstrating the labrum, ligamentum teres, and articular cartilage of the lunate surface of the acetabulum. (B) Arthroscopic view of the ligamentum teres with the hip in internal rotation.
|
 |
|
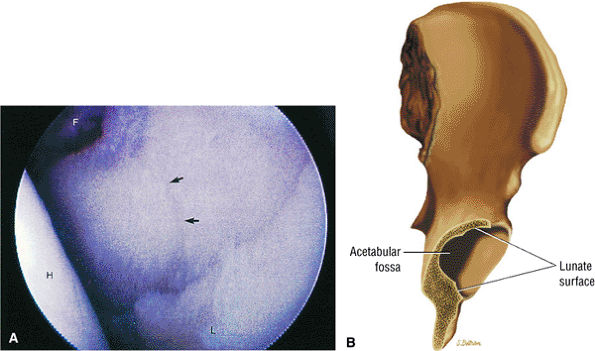
FIGURE 3.51 ● (A) The stellate crease (arrows) is shown above the acetabular fossa (F) and within the lunate surface of the acetabulum. The stellate crease, (lesion) represents a bare area deficient in hyaline cartilage and not degeneration. Arthroscopically, this bare area may appear as an indentation. The femoral head (H) is indicated. Anterior is down and posterior is up. (B) The articular lunate surface of the acetabulum. The osseous acetabular rim is angled anteroinferior relative to the sagittal plane. The adult aperture angle is 17°.
|
 |
|
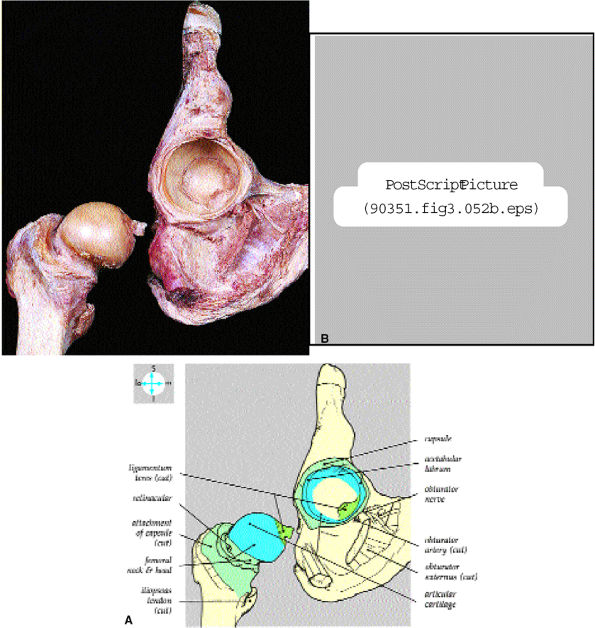
FIGURE 3.52 ● (A) Internal features are revealed by disarticulation of the joint after cutting the ligamentum teres and joint capsule. (B) The lunate-shaped articular surface covers the acetabular fossa and forms two thirds of a sphere.
|
 |
|
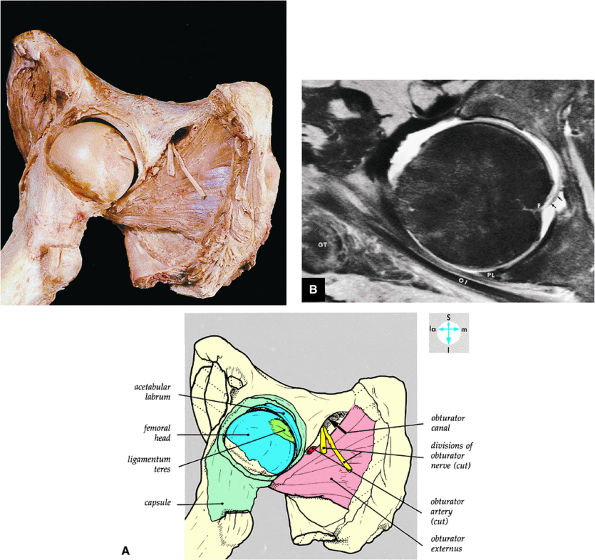
FIGURE 3.53 ● (A) The joint capsule has been opened anteriorly and reflected to show the interior of the joint. The femur has been abducted and externally rotated. (B) Axial MR arthrogram identifying the fovea (F), ligamentum teres (arrows), posterior labrum (PL), obturator internus tendon (OI), and greater trochanter (GT). Fat-suppressed T2-weighted fast spin-echo image.
|
 |
|
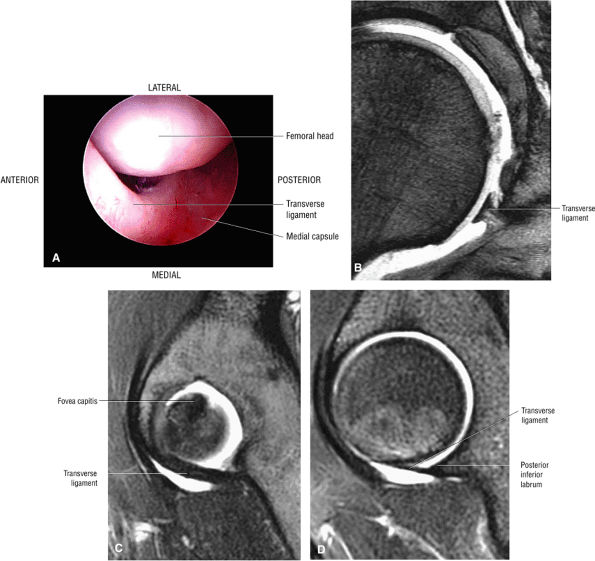
FIGURE 3.54 ● Transverse ligament. (A) Arthroscopic view. (B) Coronal T2* gradient echo image. (C) Sagittal FS PD FSE medially. (D) Sagittal FS PD FSE at posterior labrum-transverse ligament transition.
|
 |
|
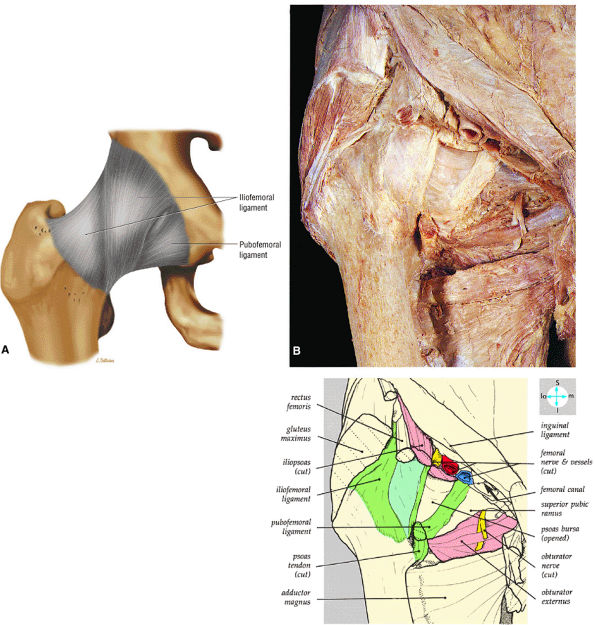
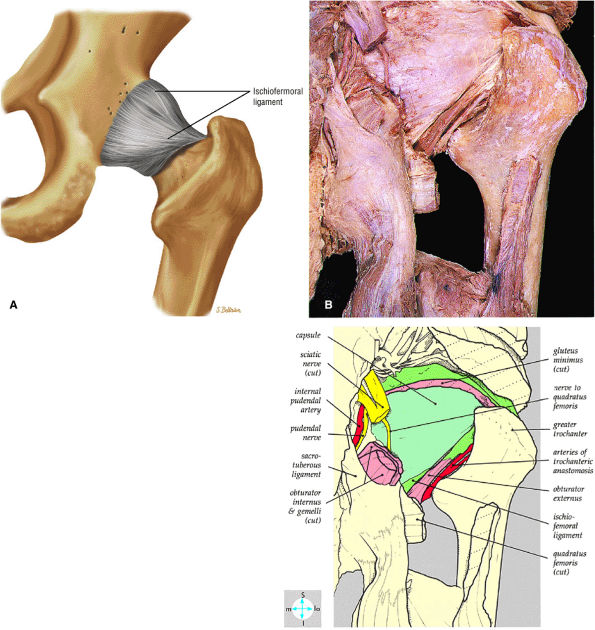
FIGURE 3.55 ● (A) The inverted Y-shaped iliofemoral ligament spirals from the superior acetabulum to the anterior femoral neck. The weaker pubofemoral ligament blends with the medial aspect of the iliofemoral ligament. The iliofemoral ligament fibers are taut in full hip extension. (B) Anterior surface of the joint capsule, associated ligaments, and adjacent structures.
|
 |
|
FIGURE 3.56 ● (A) The ischiofemoral ligament, which reinforces the posterior capsule, originates from the ischial portion of the acetabular rim. Its fibers spiral laterally and superiorly across the femoral neck to blend with the fibers of the zona orbicularis. (B) Posterior surface of the joint capsule and the ichioremoral ligament.
|
 |
|
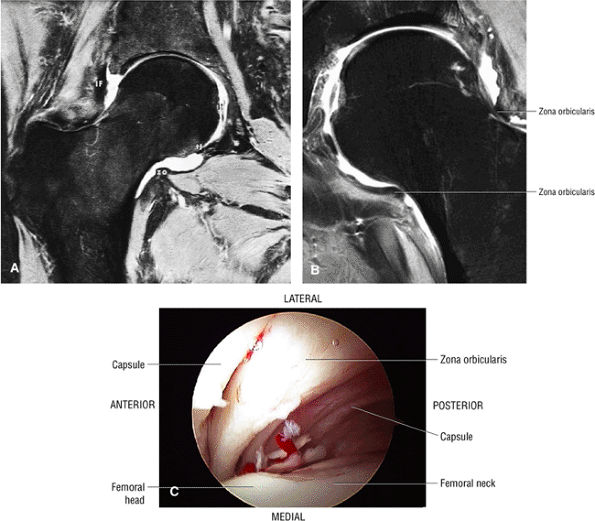
FIGURE 3.57 ● (A) Coronal MR arthrogram displaying hip joint and capsular anatomy. The distal insertion of the capsule is at the base of the femoral neck. The zona orbicularis (zo) is seen as an area of capsular thickening and tightening over the middle of the femoral neck. The transverse ligament (tl), iliofemoral ligament (IF), and ligamentum teres (lt) are identified. The acetabular labrum is absent. This coronal MR section cuts through the supra-articular recess, the intra-articular recess, and the recess colli (the recess at the base of the femoral neck). Fat-suppressed T2-weighted fast spin-echo image. (B) Coronal FS PD FSE image showing the zona orbicularis fibers at the base of the femoral neck circumferentially surrounding the posterior capsule. The zona orbicularis represents a deep layer of circularly oriented fibers that do not directly attach to the femur. (C) Arthroscopic view of the zona orbicularis.
|
 |
|
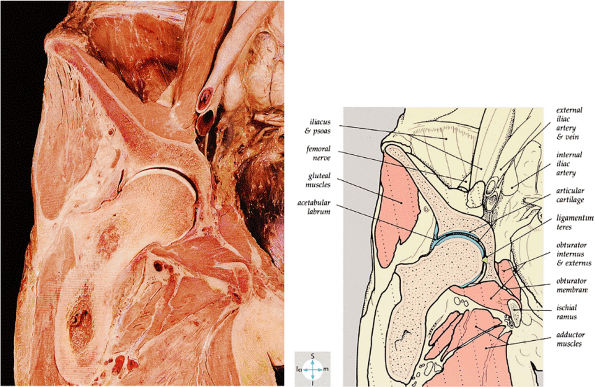
FIGURE 3.58 ● A coronal section through the hip joint shows its anatomic relations.
|
 |
|
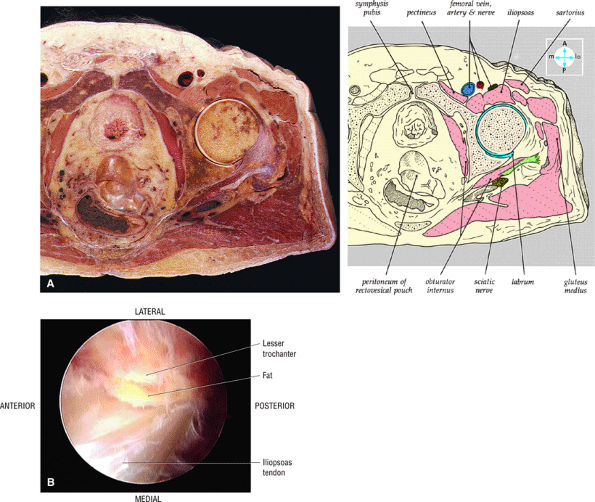
FIGURE 3.59 ● (A) A transverse section through the hip joint shows its anatomic relations. (B) Arthroscopic view of the iliopsoas tendon relative to its lesser trochanter insertion. The iliopsoas flexes, laterally rotates, and adducts the thigh.
|
 |
|
FIGURE 3.60 ● The posterior inferior sublabral sulcus or groove does not extend completely underneath the labrum and is not analogous to the sublabral foramen. (A) Axial color illustration. (B) Axial FS PD FSE image. (C) Coronal 3D color illustration of the posteroinferior sulcus. (D) Arthroscopic view of the posterior inferior sulcus.
|
 |
|
FIGURE 3.61 ● Coronal (A) and sagittal (B) FS PD FSE images of an anterosuperior cleft in a patient with mild DDH and a hypertrophied labrum. The cleft does not extend completely through the lateral or anterior labrum.
|
 |
|
FIGURE 3.62 ● Normal transverse ligament labral sulcus. (A) Coronal color illustration. (B) Coronal FS T1 MR arthrogram. (C) Sagittal (lateral) color illustration. (D) Sagittal FS PD FSE image.
|
 |
|
FIGURE 3.63 ● Sagittal FS PD FSE image showing the posterior transverse ligament of the labral sulcus.
|
 |
|
FIGURE 3.64 ● (A) Coronal section through hip joint. (B) Coronal FS PD FSE image showing the perilabral sulcus between the capsule and lateral acetabular rim and labrum. (C) Normal chondrolabral junction and perilabral sulcus.
|
 |
|
FIGURE 3.65 ● 3D image showing correlation between capsule and labrum and a corresponding coronal section of the perilabral sulcus lateral to the acetabular rim and labrum.
|
 |
|
FIGURE 3.66 ● Femoral head chondral crease with adjacent bump proximal to the physis in a mild DDH case with a hypertrophied labrum. (A) A mild crease is shown on this coronal FS PD FSE image. (B) This coronal FS PD FSE image shows a prominent femoral head crease secondary to impingement between the hypertrophied labrum and the articular surface of the lateral femoral head proximal to the physeal scar in another DDH patient. (C) Arthroscopic view of femoral head crease demarcating the femoral head articular cartilage medially from the lateral bump. The crease or cleft is opposite the lateral edge of the hypertrophied labrum. The normal perilabral sulcus is also shown between the labrum and capsule.
|
 |
|
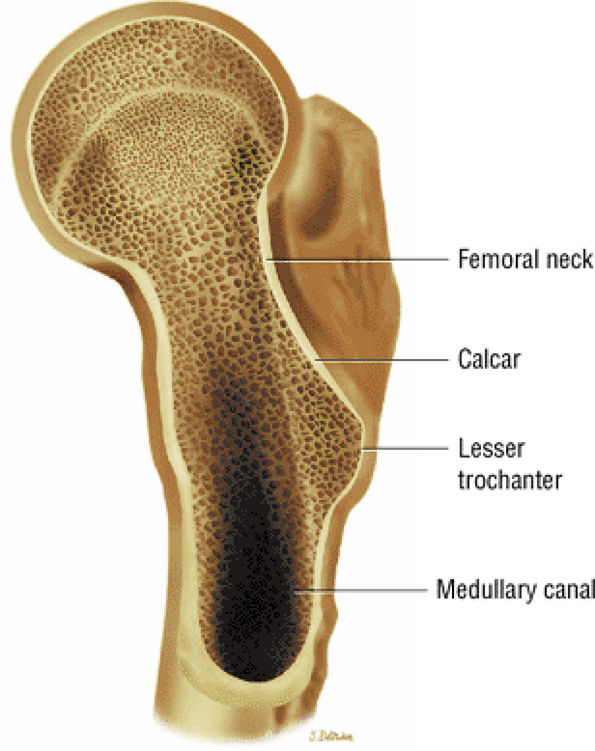
FIGURE 3.67 ● Relationship of the femoral neck and calcar.
|
 |
|
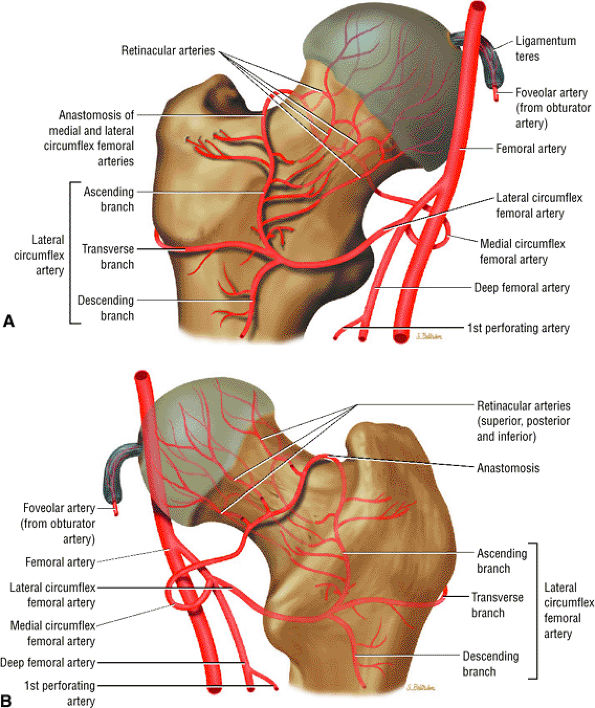
FIGURE 3.68 ● Anterior (A) and posterior (B) perspectives of femoral head arterial supply. The arteries are derived from an anastomosis of three sets of vessels, the retinacular vessels (from the medial circumflex femoral artery and, to a lesser extent, the lateral circumflex femoral artery), the terminal branches of the medullary artery of the femoral shaft, and the artery of the ligamentum teres from the posterior division of the obturator artery.
|
 |
|
FIGURE 3.69 ● Vascular supply of the hip joint. The relationship of the obturator artery and the small foveolar artery contained within the ligamentum teres is shown.
|
-
The sciatic nerve (Fig. 3.70) is composed of the upper sacral plexus roots from the anterior and posterior divisions of L4, L5, S1, S2, and S3. The two peripheral nerves, the tibial (anterior divisions) and the common peroneal (posterior divisions), are contained within the same connective tissue sheath as the sciatic nerve.
-
The femoral nerve is derived from the posterior branches of the second, third, and fourth lumbar nerve roots (the hip). The femoral nerve overlies the iliopsoas muscle proximal to its entry into the thigh through the femoral triangle.
-
The obturator nerve is formed from the anterior divisions of L2, L3, and L4 and crosses the quadrilateral surface of the acetabulum medial to the obturator internus muscle. The obturator neurovascular bundle exits the pelvis through the obturator canal in the superolateral aspect of the obturator foramen.
-
The acetabular notch and fat pad, loose bodies, synovial tissue, and notch osteophytes
-
Tears or avulsions of the ligamentum teres
-
The posterior labrum
-
The lateral labrum
-
The anterior labrum
-
Labral hypertrophy
-
Soft, blistered, or delaminated acetabular cartilage
-
Perilabral sulcus, cysts, spurring, and labral tears
-
Femoral head fovea and ligamentum teres
-
Transverse acetabular ligament
-
Zona orbicularis
-
Iliopsoas tendon reflection or capsule
-
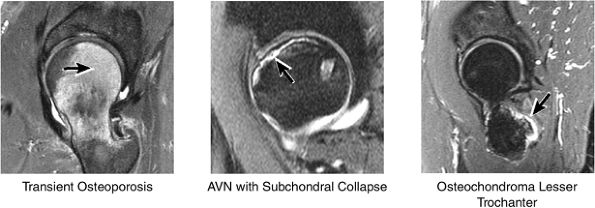
AVN usually involves the anterolateral aspect of the femoral head.
-
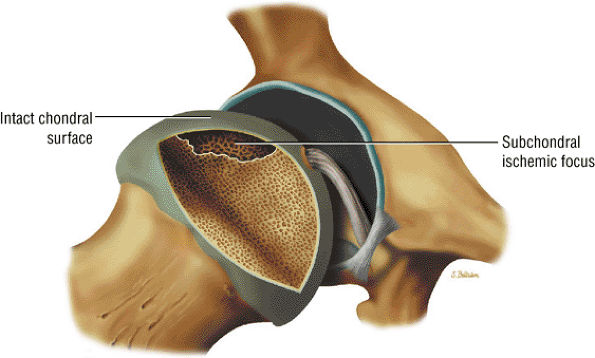
Articular cartilage is intact at the initial presentation of ischemia.
-
Sagittal images are the most accurate in assessing the femoral head changes that occur with subchondral fracture.
-
The double line sign may be absent in 20% of cases.
-
Loss of the spherical shape of the femoral head corresponds to Ficat stage 3.
-
Many cases of previously diagnosed transient osteoporosis of the hip are, in fact, subchondral femoral head stress fractures.
 |
|
FIGURE 3.70 ● (A) Posterior color illustration of the neural structures of the posterior proximal thigh. The sciatic nerve is sectioned. The sciatic nerve arises from the lumbosacral plexus and is composed of the ventral rami of the fourth and fifth lumbar roots and the first, second, and third sacral roots. It is shown exiting the pelvis through the sciatic notch inferior to the piriformis muscle. The sciatic nerve is completely motor in function. (B) Coronal T1 FSE image of the normal sciatic nerve.
|
 |
|
FIGURE 3.71 ● In a lateral arthroscopic approach the lateral acetabulum is directed superiorly. The left hip is demonstrated.
|
 |
|
FIGURE 3.72 ● Coronal PD FSE image showing the normal distribution of yellow marrow fat signal intensity in the greater trochanter and femoral epiphysis. In the femoral neck and proximal femoral diaphysis, red marrow is seen with intermediate or lower in signal intensity.
|
 |
|
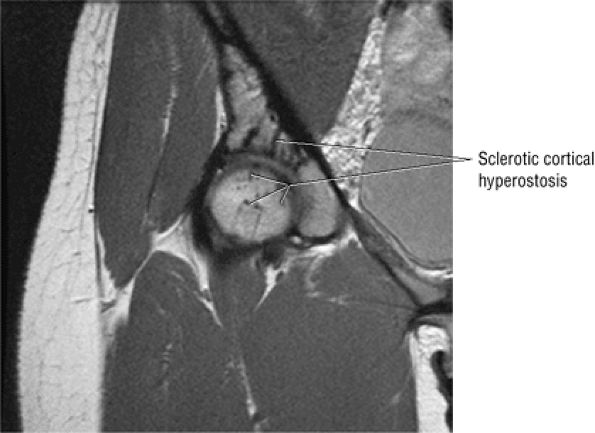
FIGURE 3.73 ● Hypointense sclerotic melorheostosis involving the acetabulum, femoral head, and ilium. Melorheostosis may cross the joint and can be associated with bone pain, limited range of motion, and joint effusion. The cortical hyperostosis (candle wax morphology) occurs in a dermatomal distribution. Subsequent evaluations may demonstrate flexion contractures, although this process is often an incidental finding. Coronal PD FSE image.
|
-
The classic presentation includes hip, groin, or gluteal pain, with or without referred thigh or knee pain. Groin pain is characteristic of hip pathology. The C sign is pain described by a cupped hand placed above the greater trochanter, indicating deep joint pain.
-
The pain is described as deep and throbbing and is worse with ambulation or activity, particularly twisting motions such as occur in turning or changing direction.
-
The patient may describe pain with sitting and difficulty ascending and descending stairs.
-
Hip rotation and range of motion are decreased, particularly in the presence of a joint effusion.
-
There may be a catching or popping sensation.
-
A Trendelenburg gait is often noted.
 |
|
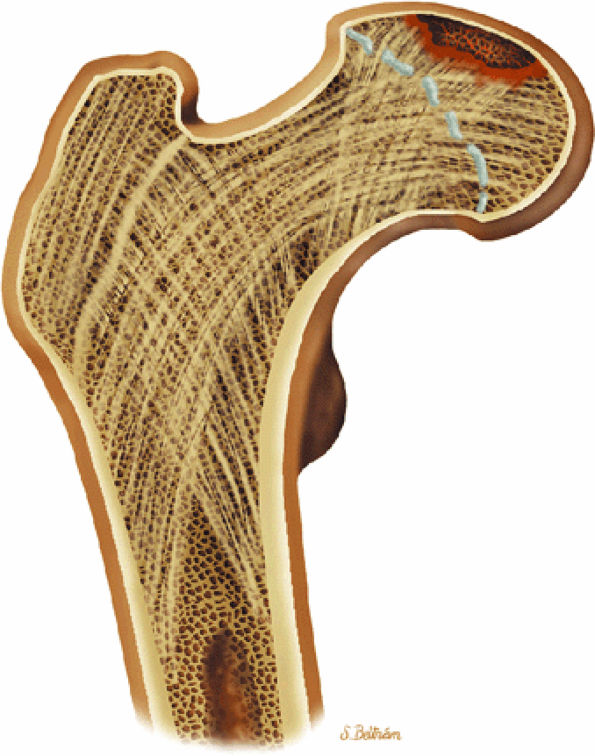
FIGURE 3.74 ● Crescentic subchondral involvement of the femoral head prior to segmental flattening of the articular surface.
|
 |
|
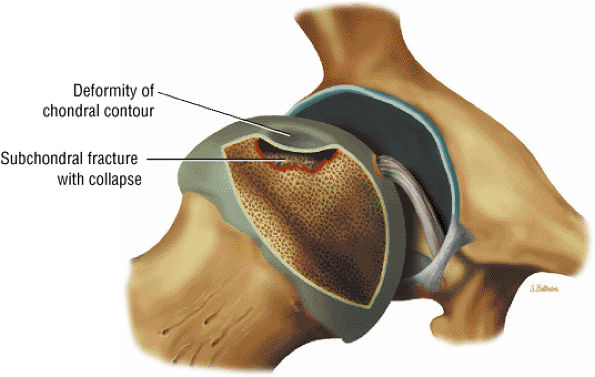
FIGURE 3.75 ● Segmental flattening with loss of the spherical shape of the femoral head. Subchondral collapse produces the characteristic crescent sign.
|
-
A hypointense peripheral band (primarily granulation tissue and to a lesser extent sclerosis) outlining a central region of bone marrow represents the reactive interface between necrotic and reparative zones, as seen on T1-weighted images.
-
There may be associated bone marrow edema of head and neck of the femur.
-
A joint effusion may be seen and is hypointense on T1-weighted images and hyperintense on FS PD FSE images.
-
Post-contrast enhancement corresponds to a reparative zone, seen as a hypointense band. There may be decreased enhancement with gadolinium in early AVN, and there is no enhancement with nonviable trabeculae and marrow.
-
The alpha angle, determined on coronal images, is used to assess the largest area of necrosis (with the vertex of the angle at the center of the femoral head).33 Alpha angles greater than 75° are associated with a poor prognosis.33 (See discussion below on alpha angles.)
-
A wedge-shaped subchondral infarct may also be seen.
 |
|
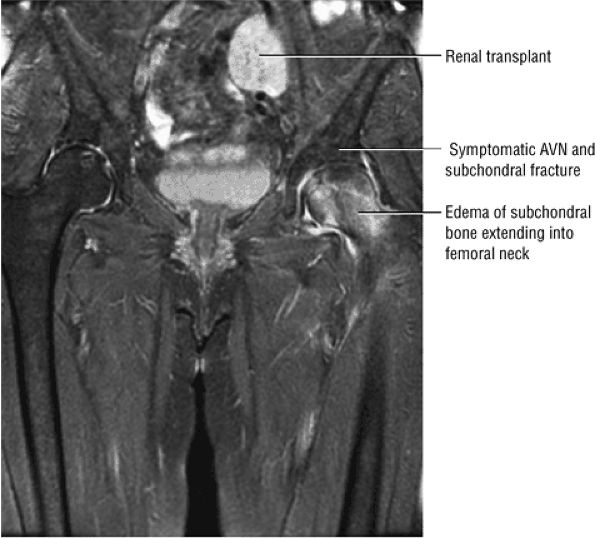
FIGURE 3.76 ● Bilateral AVN (after renal transplant). The right hip is asymptomatic and there is a diffuse edema pattern of the left femoral head and neck associated with ischemic change and subchondral fracture. Coronal FS PS FSE image.
|
 |
|
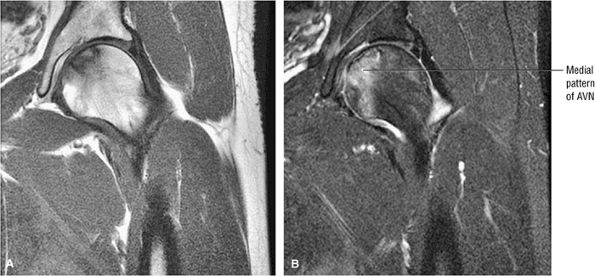
FIGURE 3.77 ● Medial osteonecrosis on coronal T1-weighted (A) and FS PD FSE images (B). Osteonecrosis involving the one third or less of the weight-bearing portion of the femur is less likely to progress to femoral head collapse.
|
 |
|
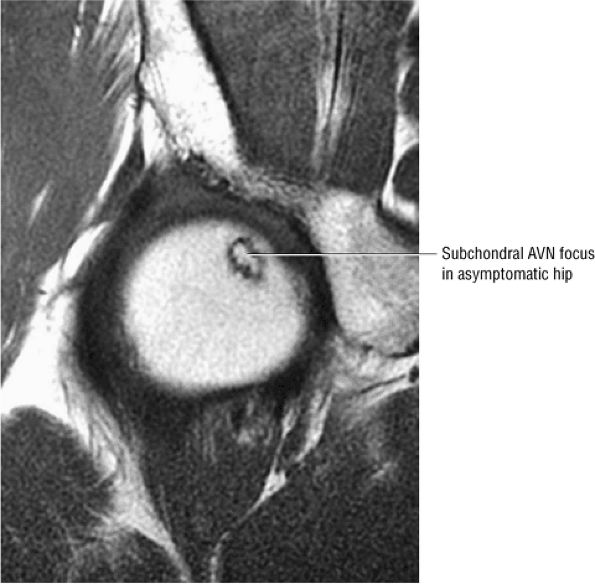
FIGURE 3.78 ● Early AVN focus extending toward the subchondral plate. Central marrow fat signal intensity is shown within the ischemic zone.
|
-
Stage 0: Bone biopsy shows osteonecrosis, but imaging findings are normal.
-
Stage I: Bone scans are positive; MR imaging may or may not show early changes of AVN.
-
Stage II: Mottled femoral head with sclerosis/cyst/osteopenia on radiographs. There is no collapse; bone scans are positive.
-
Stage III: Crescent sign lesion and depression of the femoral head articular surface
-
Stage IV: Flattening of the articular surface and joint space narrowing with secondary acetabular changes
 |
|
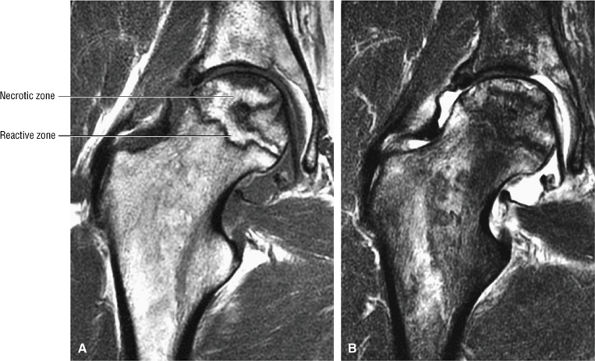
FIGURE 3.79 ● Coronal T1-weighted (A) and FS PD FSE (B) images show osteonecrosis with approximately 70% femoral head involvement without associated articular collapse. Marrow edema extends into the intertrochanteric area.
|
-
Stage 0: Diagnosed on the basis of scintigraphic or MR imaging when a painful contralateral hip is being evaluated. There are no clinical or radiographic changes found. There is a double-line sign on the MR image in the asymptomatic hip in this stage.
-
Stage I: The trabeculae appear normal or slightly porotic. MR imaging may show a single line on T1-weighted images and the double line sign on FS PD FSE images. The double-line sign is specific and pathognomonic for AVN. The hyperintensity at the periphery of the necrotic focus is probably caused by hypervascular granulation tissue, a hyperemic response adjacent to thickened trabeculae.27 Pathologic specimens from lesions in these early stages show viable bone on necrotic bone with marrow spaces infiltrated by mononuclear cells and histiocytes, explaining the imaging changes.
-
Stage II: There is sclerosis and porosis of the trabeculae, and a shell of reactive bone demarcates the area of infarct. Within this area, the trabeculae and marrow spaces are acellular. There may be an extended pattern of associated marrow edema from the nonischemic region of the femoral head into the femoral neck (Fig. 3.80).
-
Stage III: The onset of stage III disease is marked by the loss of the spherical shape of the femoral head (Fig. 3.81). The AP radiograph may appear normal, but the lateral view often reveals a crescent sign, or radiolucency, under the subchondral bone. This represents a fracture between the subchondral bone and the underlying femoral head (Fig. 3.82). The crescent sign is the
P.127P.128
earliest indication of mechanical failure from accumulated stress fractures of nonrepaired necrotic trabeculae.27 At this stage, there is also separation of the subchondral plate from the underlying necrotic cancellous bone. The necrotic area becomes radiodense (Fig. 3.83) as a result of mineral deposition in the marrow spaces. The joint space remains preserved or may actually increase in height. -
Stage IV: The femoral head undergoes further collapse, leading to articular cartilage destruction and joint space narrowing (Fig. 3.84). Segmental collapse and subchondral fracture may result in pain and disability. Frequently this is the stage at which the patient presents for evaluation, although attention is sometimes sought earlier. Pain may be attributed to increased intraosseous pressure and microfractures.
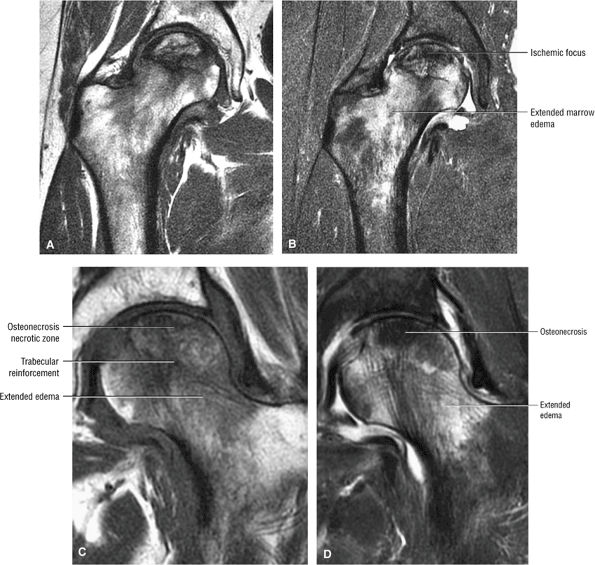 |
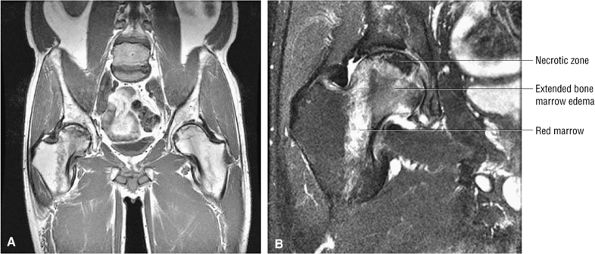
|
FIGURE 3.80 ● Extended pattern of marrow edema in association with osteonecrosis. Edema of the femoral neck is hypointense on T1-weighted image (A) and hyperintense on FS PD FSE image (B). (C, D) A separate case of AVN with an ischemic focus demonstrating attenuated fat signal with adjacent reactive femoral head and neck edema. The marrow edema does not extend into the ischemic region. (C) Coronal T1-weighted image. (D) Coronal FS PD FSE image.
|
 |
|
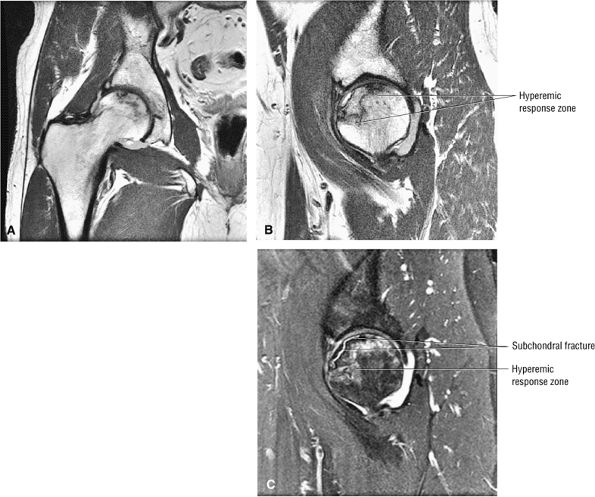
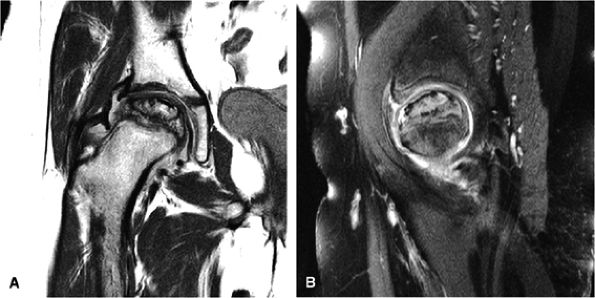
FIGURE 3.81 ● AVN with subchondral fracture. The focus of osteonecrosis involves a portion of the weight-bearing surface. (A) Coronal T1-weighted image. (B) Sagittal T1-weighted image. (C) Sagittal FS PD FSE image.
|
 |
|
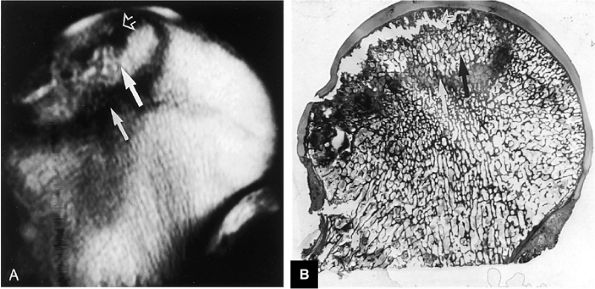
FIGURE 3.82 ● AVN. (A) T1-weighted coronal image demonstrates high-signal-intensity cortical necrosis (large arrow), low-signal-intensity sclerotic peripheral interface between necrosis and viable marrow (small arrow), and low-signal-intensity subchondral fracture (open arrow) (TR, 600 msec; TE, 20 msec). (B) A macroslide of a gross specimen shows corresponding subchondral collapse (open arrow), reactive periphery (white arrow), and cortical necrosis (black arrow).
|
 |
|
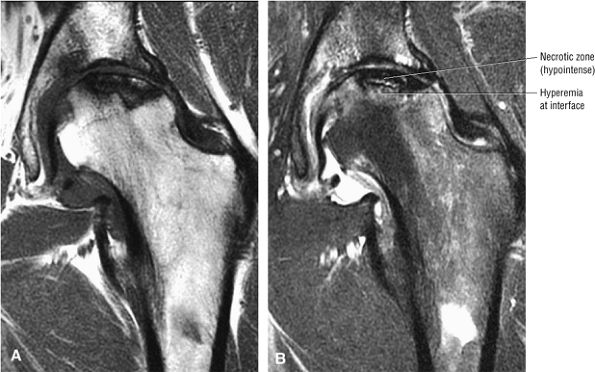
FIGURE 3.83 ● Hypointense ischemic area on coronal T1-weighted (A) and FS PD FSE (B) images.
|
-
Class A: In MR class A disease (Fig. 3.85), the osteonecrotic lesion demonstrates signal characteristics analogous to fat. There is a central region of high signal intensity on images obtained with short TR/TE settings (T1-weighted images) and intermediate signal intensity on images obtained with long TR/TE settings (T2-weighted images).
-
Class B: Class B hips demonstrate the signal characteristics of blood or hemorrhage (i.e., high signal intensity on both short and long TR/TE sequences).
-
Class C: Hips identified as class C demonstrate the signal properties of fluid (i.e., low signal intensity on short TR/TE sequences and high signal intensity on long TR/TE sequences).
-
Class D: Class D hips exhibit the signal characteristics of fibrous tissue (i.e., low signal intensity on short and long TR/TE sequences) (Fig. 3.86).
 |
|
FIGURE 3.84 ● Osteonecrosis in a dysplastic hip with a shallow acetabulum. There is frank subchondral collapse and femoral head cystic change. Changes in the acetabulum represent superimposed degenerative arthritis with joint space narrowing. (A) T1-weighted coronal image. (B) FS PD FSE coronal image. (C) FS PD FSE sagittal image.
|
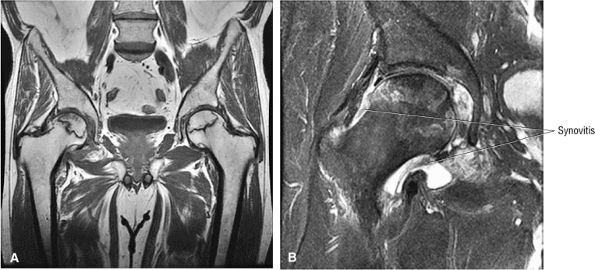 |
|
FIGURE 3.85 ● Coronal T1 FSE (A) and FS PD FSE (B) images showing AVN with associated synovitis. The central AVN focus demonstrates marrow fat signal intensity. Synovitis demonstrates intermediate signal intensity.
|
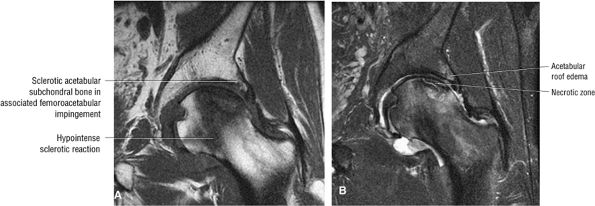 |
|
FIGURE 3.86 ● AVN associated with acetabular degenerative changes. Note the hypointense sclerotic reaction of the femoral head. (A) Coronal T1-weighted image. (B) Coronal FS PD FSE image.
|
-
Necrosis of cancellous bone and yellow bone marrow, which occurs prior to the development of capillary and mesenchymal ingrowth, corresponds to the central region of hyperintensity.41
-
A sclerotic margin of reactive tissue at the interface between necrotic and viable bone corresponds to the hypointense peripheral band.
-
Thickened trabecular bone and the high water content of mesenchymal tissue are seen as low signal intensity on T1-weighted images and intermediate to high signal intensity on T2-weighted images.
-
Inflammation with granulation tissue or hyperemia inside the reactive bone interface is thought to produce the double-line sign. It is present in 80% of cases of AVN.28
-
Softening within the necrotic cancellous bone at the interface with viable bone appears as resorption of the necrotic focus. There may be rim enhancement of granulation tissue at the reactive interface, with a lack of contrast enhancement with the central nonviable marrow.
-
Collapse of the femoral head load-bearing segment and collapse of the femoral head with articular cartilage destruction, loose bodies, and marginal osteophytes. Collapse is visualized as a subchondral fracture.
-
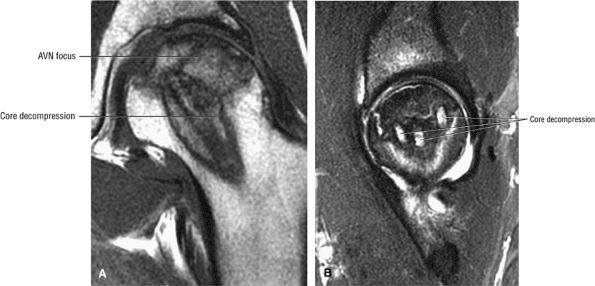
Areas of vascular engorgement and inflammation are indicated by decreased signal intensity on T2-weighted images and are associated with successful core decompression treatments.
-
A breach in the overlying articular cartilage is associated with fluid signal intensity in the subchondral fracture on FS PD FSE images.42
-
With intravenous gadolinium administration, enhanced and nonenhanced areas correspond to viable and necrotic bone, respectively.43,44
-
Perfusion, as assessed on gadolinium-enhanced T1-weighted images, and marrow composition, as measured with hydrogen-1 MR spectroscopy, were shown to be inversely related to marrow fat content in healthy subjects and were higher in patients at risk for AVN (e.g., patients with systemic lupus erythematosus).45
-
Joint effusions demonstrate low signal intensity on T1-weighted images and high signal intensity on T2-weighted images and are commonly associated with more advanced stages of AVN.46 It is not known whether the presence or absence of a joint effusion is of prognostic significance for the course and treatment of the disease. However, joint effusion is also associated with a bone marrow edema pattern prior to the irreversible demarcation (double-line sign) of the necrotic focus.
100 asymptomatic patients.53 In another study of renal transplant recipients, followed for 22 months using serial radiographs and MR, untreated AVN was shown to have a benign course without progression from Ficat stage 0.54 Jiang and Shih reported that the presence of a complete or dense physeal scar on MR scans was associated with a high risk for AVN of the femoral head.55 Segmental or incomplete scars in AVN were uncommon. The sealed-off or complete scar was shown to be a risk factor in patients with or without a history of steroid or alcohol abuse (associated lipogenic factors). Because it is possible to identify MR changes of focal osteonecrosis when radionuclide scans are negative and CT and plain film findings are normal,56 a limited or modified MR examination could be used as a low-cost screening tool in at-risk populations.
 |
|
FIGURE 3.87 ● Osteonecrosis with adjacent column of red marrow. Red or hematopoietic marrow should not be mistaken for an extended edema pattern, which is partially shown in the medial femoral head/neck junction. (A) Coronal T1-weighted image, (B) Coronal FS PD FSE image.
|
-
Conservative management, observation, and protected weight-bearing, which is of limited utility
-
Surgical management, including core decompression (with or without bone grafts), osteotomy, electrical stimulation, and arthroplasty
 |
|
FIGURE 3.88 ● Post-core decompression for an ischemic focus with associated subchondral fracture without femoral head collapse. Arthroscopy has been performed for stage IV or post-collapse patients who are also candidates for osteotomy or vascularized graft. Delamination of articular cartilage is treated with débridement and core decompression, although improvement may be limited. (A) Coronal T1-weighted image. (B) Sagittal FS PD FSE image.
|
metabolic bone disease do not benefit greatly from osteotomy.
-
Results in infarction of the bony capital epiphysis
-
Catterall classification estimates the amount of femoral head involvement.
-
Hypointense irregularity of the periphery of the ossific nucleus and linear hypointensity traversing the femoral ossification center are early findings on T1- or PD-weighted images.
 |
|
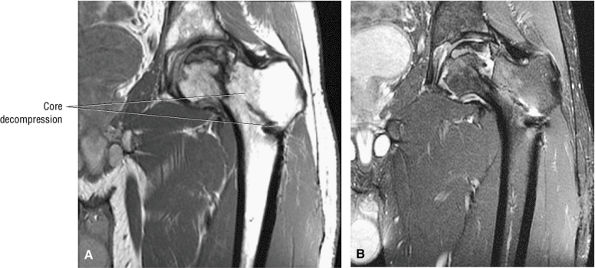
FIGURE 3.89 ● Post-core decompression for pain reduction and to delay femoral head collapse in a separate case. A fibular strut graft can also be used to prevent femoral head collapse. (A) Coronal T1-weighted image. (B) Coronal FS PD FSE image.
|
-
Insufficiency of the capital epiphyseal blood supply, with the physis acting as a barrier; ischemia may be arterial or venous and leads to intraepiphyseal infarction
-
Medial and lateral overgrowth of articular cartilage
-
Infarction and trabecular fracture, with decreased epiphyseal height
-
A limp with groin, thigh, or knee pain (referred). Children who present with knee pain must be carefully examined for hip pathology.
-
As the disease progresses, a flexion and adduction contracture may develop, resulting in decreased range of motion.
-
Lateral overgrowth of the femoral head cartilage may cause loss of abduction. Attempts at abduction lead to hinging and possible subluxation of the femoral head.
-
Eventually, the hip may move only in the flexion-extension plane, resulting in a painful gait and muscle atrophy.
-
Effusion, fragmentation, and flattening of a sclerotic capital epiphysis
-
Metaphyseal irregularity, including cystic changes and rarefaction of the lateral and medial metaphysis
-
Widening of the inferomedial joint space with an intact subchondral plate
-
A subchondral fracture line
-
A small epiphysis
 |
|
FIGURE 3.90 ● Color coronal section showing subchondral necrosis of the proximal femoral epiphyses in LCP.
|
 |
|
FIGURE 3.91 ● Earliest changes of LCP are irregularity of the hypointense subchondral plate of the capital epiphysis and associated joint effusions. (A) Coronal T1-weighted image. (B) Coronal FS PD FSE image.
|
-
Group I: There is involvement of the anterior aspect of the epiphysis without a metaphyseal reaction, sequestrum, or subchondral fracture line. Less than 25% of the epiphysis is involved.
-
Group II: There is more extensive or severe involvement of the anterior aspect of the epiphysis, with preservation of the medial and lateral segments. A sequestrum is present, as is an anterolateral metaphyseal reaction. There is a subchondral fracture line that does not extend to the apex of the femoral epiphysis. Less than half the epiphysis is involved.
-
Group III: The entire epiphysis is dense and there is a diffuse metaphyseal reaction with femoral neck widening. A subchondral fracture line is visualized posteriorly. Most of the epiphysis is involved.
-
Group IV: There is total involvement of the epiphysis, with flattening, mushrooming, and eventual collapse of the femoral head. An extensive metaphyseal reaction and associated posterior remodeling can be seen.
-
Group A: Less than 50% of the span of epiphysis is involved.
-
Group B: There is fracture of more than 50% of the span of the epiphysis.
-
Group A: The lateral pillar is not involved.
-
Group B: Less than 50% of the lateral pillar is affected.
-
Group C: More than 50% of the lateral pillar is affected.
-
Initial stage: Increased head-socket distance, subchondral plate thinning, and a dense epiphysis
-
Fragmentation stage: Subchondral fracture, an inhomogeneous dense epiphysis, and a porous appearance, with metaphyseal cysts
-
Reparative stage: Normal bone in areas of resorption and removal of sclerotic bone. The epiphysis has a more homogenous appearance.
-
Growth stage: Re-ossification; the normal femoral shape is approached.
-
Definitive stage: The final shape is determined, with joint congruency or incongruency.
-
Initial stage: There is necrosis of epiphyseal bone and marrow, vascular invasion of dead bone, and hypertrophy of epiphyseal cartilage.
-
Fragmentation stage: The dead bone is resorbed, the unossified physeal cartilage in the metaphysis may produce cysts, and there is cartilage hypertrophy.
-
Reparative stage: Dead bone is replaced.
T2-weighted images also are useful for displaying acetabular and femoral head cartilage. Metaphyseal irregularities and subchondral hyperintensity are identified on FS PD FSE coronal images (Fig. 3.94).
 |
|
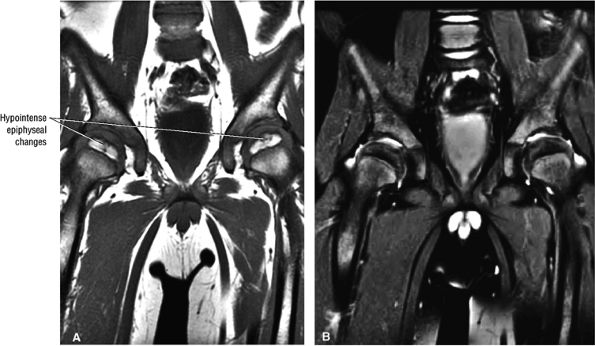
FIGURE 3.92 ● T1-weighted coronal images in LCP. (A) Normal femoral head capital epiphyses. (B) The earliest MR signs of LCP include peripheral irregularity of marrow-fat-containing epiphyseal ossification center (white arrows). Low-signal-intensity foci or linear segments are seen within the right and left ossification centers (black arrows). No subarticular collapse is present, and conventional radiographs are normal (TR, 500 msec; TE, 20 msec).
|
 |
|
FIGURE 3.93 ● Coronal T1-weighted images show the spectrum of LCP from (A, B) early to (C, D) late advanced involvement. (A) Small, laterally displaced ossific nucleus with loss of yellow marrow signal intensity (long black arrow) is present early in the disease. Normal contralateral epiphyseal cartilage (curved arrow) and high-signal-intensity marrow (short black arrow) are seen. (B) Complete loss of right femoral epiphyseal marrow signal intensity (arrow) occurs as the disease progresses. (C) Bilateral low-signal-intensity osteonecrotic foci in the femoral epiphysis (arrows) become apparent later in the disease. Articular cartilage is thinner in the older child. (D) Advanced remodeling with coxa plana and coxa magna of the femoral heads (arrows) is indicative of late advanced involvement. (TR, 600 msec; TE, 20 msec.)
|
 |
|
FIGURE 3.94 ● LCP with hypointense ischemic capital epiphysis associated with medial metaphyseal irregularity. Coronal FS PD FSE image.
|
-
Hypointense intra-articular effusion
-
Hypointense irregularity along the periphery of the ossific nucleus. Before diffuse loss of signal intensity of the ossific nucleus is observed, low-signal-intensity irregularity occurs along the periphery of the fat-containing ossific nucleus, and linear areas of low signal intensity may traverse the femoral ossification center. These changes correlate with positive bone scintigraphy in stage I disease.
-
Replacement of the initial low-signal-intensity focus with high-signal-intensity marrow fat is associated with revascularization of a necrotic epiphysis after treatment with varus osteotomy.
-
Coxa plana and coxa magna as a result of late remodeling
-
In the early stages of disease, physeal cartilage may or may not be hyperintense on T2-weighted images.
-
Loss of containment of the femoral head in the acetabulum is indicated by intermediate-signal hypertrophied synovium in the iliopsoas recess, seen as a frond-like structure adjacent to the inferomedial joint space. Rush et al. reported these findings in 7 of 20 cases.86 Thickening of the intermediate-signal epiphyseal cartilage also contributes to loss of containment.87
-
Hyperintense joint effusion
 |
|
FIGURE 3.95 ● An 11-year-old girl with chronic changes of LCP on the right. There is enlargement of the right capital epiphysis with decreased superolateral coverage, and loss of epiphyseal height on coronal T1-weighted (A) and T2* (B) images. The T2* coronal image (B) shows flattening of the femoral head and acetabulum. A sagittal T2* image (C) identifies the hyperintense anterior epiphyseal involvement (arrows). The overlying articular cartilage appears more congruent than the necrotic focus within the capital epiphysis.
|
 |
|
FIGURE 3.96 ● An 11-year-old with LCP. A coronal T1-weighted image (A) and a sagittal FS PD FSE image (B) show total epiphyseal necrosis, fragmentation, and flattening. Joint effusion is hyperintense on the FS PD FSE image (B). Presentation after 8 years of age is associated with a poor prognosis.
|
 |
|
FIGURE 3.97 ● Transient osteoporosis of the hip with partial marrow-sparing of the greater trochanter and medial femoral head. No subchondral fracture is identified. (A) Coronal color section. (B) Coronal T1-weighted image. (C) Coronal FS PD FSE image.
|
-
Most cases actually represent subchondral femoral head stress fractures, which can be appreciated on small-FOV images.
-
There is marrow sparing in the medial femoral head and greater trochanter.
-
Acute onset of groin pain, which is exacerbated by weight-bearing
-
Decreased range of motion
-
Limp
-
History negative for infection or trauma
-
Resolution of symptoms after 6 to 10 months and restoration of mobility
-
Elevation of pressure within bone marrow
-
Normal appearance of articular cartilage, cortex, and subchondral bone
-
A small joint effusion
-
Synovial inflammation
-
Possible necrosis of fat cells
-
Fibrovascular regenerative tissue
-
Increased osteoid
-
Edema, although it is difficult to document increased free water histologically
-
Hydroxyapatite shift and reduced mineral content
-
Diffuse or large areas of hypointensity within the femoral head and neck, sometimes extending to the intertrochanteric region and/or the acetabulum
-
A narrow line of sclerosis associated with a subchondral stress fracture
-
A homogeneous and well-marginated edema pattern
-
There may be a hypointense joint effusion.
-
There may be marrow sparing in the medial and lateral-most margins of the femoral head and greater trochanter secondary to higher concentrations of fatty marrow.
-
Resolution is associated with web-like or reticular areas of hypointensity.
-
Hyperintensity in the femoral head and neck, which is most conspicuous on FS PD or STIR images, sometimes accompanied by acetabular hyperintensity
-
A hypointense fracture line parallel to the subchondral plate (high-resolution imaging is necessary for visualization)
-
Marrow edema, which can be seen as early as 48 hours after the onset of clinical symptoms
-
Marrow sparing may be seen in the anterior, posterior, medial, or lateral aspect of the femoral head.
-
The anatomic distribution of marrow hyperintensity may vary on sequential studies.
-
The edema interface is well defined without a demarcating hypointense line or band (no double-line sign).
-
The cortex and subchondral plate are normal, as are adjacent soft tissues.
-
There is a small to moderate hyperintense joint effusion.
 |
|
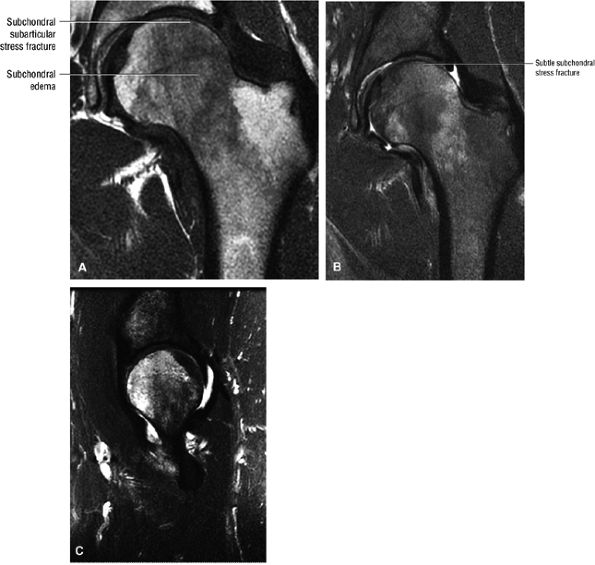
FIGURE 3.98 ● A 40-year-old male patient with subtle subchondral stress fracture easily mistaken for transient osteoporosis. (A) Coronal T1-weighted image. (B) Coronal FS PD FSE image. (C) Sagittal FS PD FSE image.
|
-
Characterized by posterior inferior displacement of the proximal femoral epiphysis
-
MR demonstrates a widened growth plate and epiphyseal slippage.
-
Arthroscopy is used to evaluate articular cartilage and labral injury and to decompress hematoma caused by physeal fracture.
-
Posterolateral labral injuries (compared to posterosuperior labral tears in young patients with occult hip pain)
-
Erosion of the anterosuperior acetabular cartilage
-
A transverse cleft in the anterior femoral head
-
Metaphyseal cartilage damage
mild to moderate slips, the most common procedure is in situ pinning. Many types of hardware are used, including a variety of multiple pin techniques and single screws. With severe slips, some advocate a gentle closed reduction, open reduction, or cuneiform osteotomy.105 The complication rate is high with internal fixation.106 Chondrolysis may occur and has been attributed to pin penetration. Unrecognized pin penetration is a major problem. AVN, another serious complication of treatment in SCFE, may follow closed reduction, open reduction, osteotomy, or vascular damage from internal fixation. It is important to remember that this is an iatrogenic complication. Because of the high complication rate with internal fixation, bone graft epiphysiodesis has gained popularity in some centers.107 In the long term, the resultant biomechanical abnormality predisposes the patient to degenerative arthritis.108
 |
|
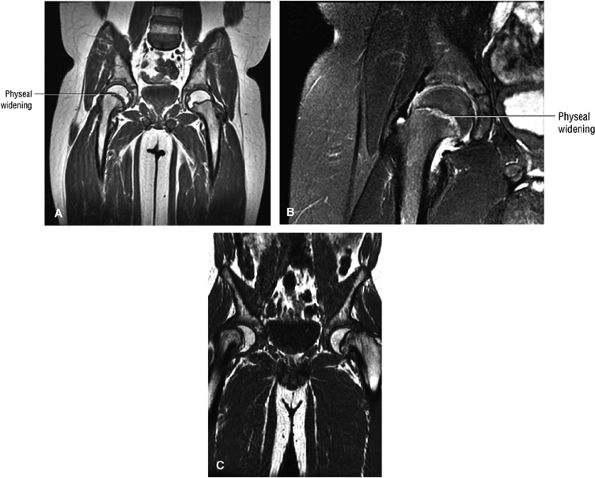
FIGURE 3.99 ● SCFE. (A, B) The femoral epiphysis is displaced posteriorly, medially, and inferiorly relative to the neck. There is widening of the physis with associated joint effusion. There is a relative decrease in the height of the epiphysis (similar to changes seen on conventional radiographs) and loss of intersection of the epiphysis by the lateral cortical (long axis) line of the femoral neck. The subsequent remodeling of the femoral neck creates a Herndon bump directly lateral to the physeal scar, similar to the location of the dysplastic femoral bump in FAI. (A) Coronal T1-weighted image. (B) Coronal FS PD FSE image. (C) A separate case showing a more severe Salter-Harris type I fracture contributing to varus hip deformity. Coronal T1-weighted image.
|
-
Classification of DDH is based on the configuration of the acetabulum and labrum.
-
Identification of the capital epiphysis location requires both coronal and axial images.
-
In mild DDH, anterior coronal MR images display an increased slope of the acetabulum.
-
DDH in the young adult may be associated with acetabular labral pathology and acetabular rim syndrome.
-
An hourglass joint capsule with compression between the limbus and the ligamentum teres
-
A thick and tight transverse ligament
-
Medial flattening of the femoral head
-
Deficiency of the superior and posterior acetabular rim
-
Hyperplasia of the ligamentum teres
-
Hypertrophy of the pulvinar
casts or with equivocal conventional radiographs.110,111 The sector angle should be used to evaluate acetabular coverage (from the capital epiphysis to acetabular rim relative to the horizontal axis).
-
Hypointense joint effusions
-
Superolateral dislocation (on coronal plane images)
-
AP relationship and dysplasia of acetabulum (on axial images)
-
Mild acetabular dysplasia (on coronal images)
-
Hyperintense fat signal of the pulvinar
-
An hourglass configuration of the acetabulum or an inverted, hypertrophied limbus must be excluded. With inversion, the intermediate-signal-intensity limbus is often seen in the lateral aspect of the joint, with increased fat (i.e., high signal intensity on T1-weighted images) noted medially.
-
On coronal and sagittal images an interposed iliopsoas tendon can be seen crossing the joint space. This prevents reduction of the femoral head in the acetabulum and may create an hourglass configuration of the joint capsule.
-
Supralateral subluxation or dislocation is best identified on coronal MR images, and AP relationships and dysplasia of the acetabular wall are best demonstrated on axial plane images.
-
MR allows direct visualization of the fat-suppressed pulvinar fibrofatty tissue.
-
There is hypertrophy of the hypointense ligamentum teres.
-
The labral limbus is deformed and has a horizontal slope instead of the normal downward lateral slope.
-
On coronal images the limbus of the acetabular roof is inverted with inferomedial displacement and a superoinferior long axis orientation.
-
The coronal plane is the most useful for evaluating acetabular labral coverage beyond the lateral margin of the bony acetabulum relative to the femoral capital epiphysis (see Fig. 3.100). This is important in determining the coverage of the femoral head and the possible need for increased coverage through surgical osteotomy. If adequate coverage is provided by the bony acetabulum and acetabular labrum together, more conservative management of DDH may be appropriate.
-
Type 1: The alpha angle is greater than 60° in the mature hip. This is considered a normal hip.
-
Type 2a: The alpha angle is 50° to 59° in the immature hip (infants less than 3 months of age).
-
Type 2b: In infants more than 3 months of age with an alpha angle of 50° to 59°, the hip is considered abnormal.
-
Type 2c: The alpha angle is 43° to 49° and the hip is considered critical and subject to subluxation.
-
Type 3: The alpha angle is less than 43°, the acetabular head is eccentric, and the hip is subject to dislocation.
-
Type 4: The alpha angle is less than 43°, and there is severe dysplasia and an inverted labrum.
is caused by compression between the limbus and the ligamentum teres. Constriction by the iliopsoas tendon may block attempts at reduction. Most cases of DDH present with a type 1 hip and positional instability. Failed hip reduction may be secondary to thickening of the ligamentum teres, an unfolded or blunted limbus, and severe deformity of the acetabulum or femoral head.
 |
|
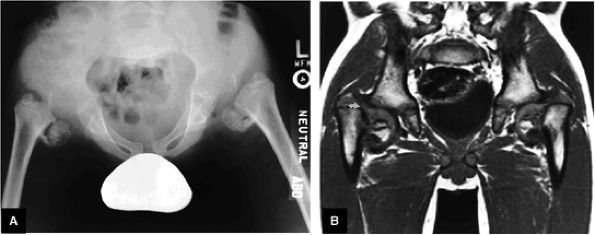
FIGURE 3.100 ● DDH. (A) Pseudo-coverage of the capital epiphysis by an everted labrum. Coronal radiograph (B) shows complete lateral uncovering of the femoral capital epiphysis associated with a shallow acetabulum. A corresponding T2* coronal MR image (C), however, demonstrates improved coverage by a mildly deformed but primarily everted labrum (arrows).
|
-
The acetabular labrum
-
The articular cartilage of the acetabular roof
-
The ligamentum teres
patient. Unfortunately, the hypertrophic labrum is exposed to greater joint reaction forces and is at an increased risk for symptomatic tearing. The acetabular labrum may also become inverted, entrapped, and subsequently torn. Direct contact between the hypertrophied labrum and the femoral head chondral surface may produce a chondral crease demarcating a femoral head bump formed proximal to the physeal scar. This finding is associated with a lateral acetabular rim or the DDH equivalent of FAI. Anterior coronal MR images evaluated at the level of the anteriormost portion of the femoral head are sensitive to asymmetry in the slope of the acetabulum. The anterior acetabular roof should maintain a relatively horizontal slope and not open up or deviate from the horizontal plane.
 |
|
FIGURE 3.101 ● (A) DDH associated with longitudinal tearing of a hypertrophied labrum. The shallow slope of the acetabulum is demonstrated. The transverse angle of the osseous acetabular rim affects the degree of lateral coverage and is increased in adult DDH. (B) The normal angle of 40° is shown in contrast to (A).
|
 |
|
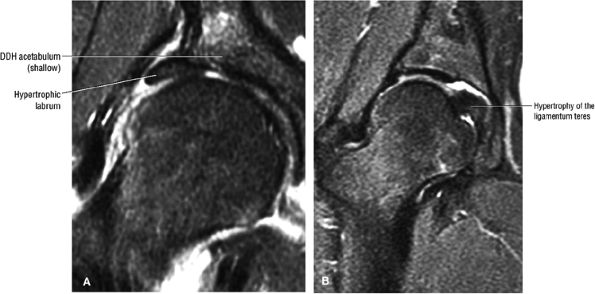
FIGURE 3.102 ● (A) Labral hypertrophy in DDH. (B) Mild labral hypertrophy and marked hypertrophy of the ligamentum teres in DDH. Coronal FS PD FSE images.
|
 |
|
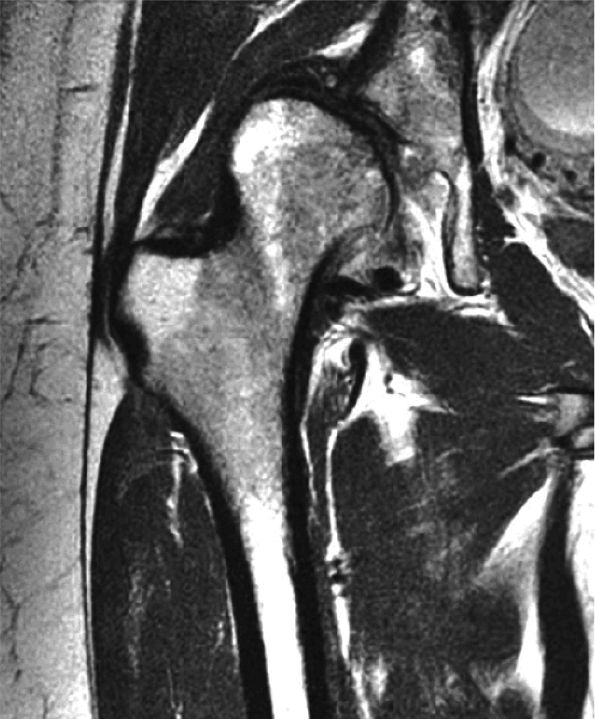
FIGURE 3.103 ● Chronic untreated DDH with superiorly displaced aspherical femoral head and deficient acetabular roof. Coronal T1-weighted image.
|
-
Parallel fibers (fusiform muscles)
-
Oblique fibers (pennate and bipennate muscles)
 |
|
FIGURE 3.104 ● (A) Coxa vara with multiple epiphyseal dysplasia. (B) T1-weighted image documents the cartilaginous continuity (curved arrow) between the capital epiphysis and femur.
|
 |
|
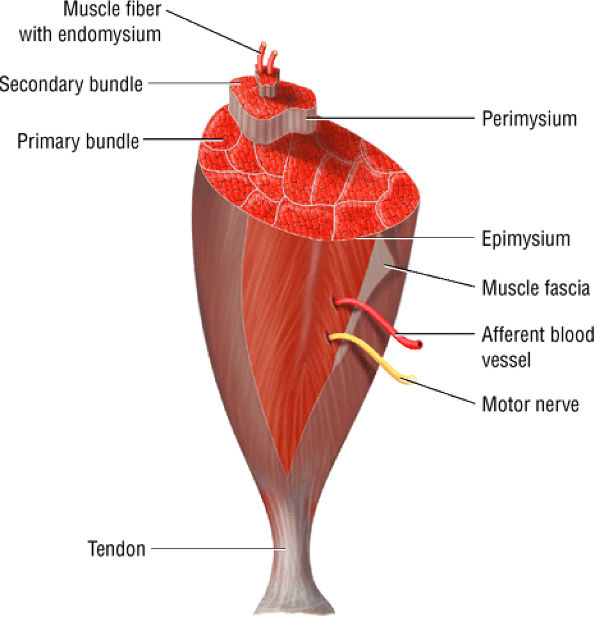
FIGURE 3.105 ● The structure of skeletal muscle. The endomysium surrounds the individual muscle fibers. The perimysium surrounds groups of fascicles made up of fibers. The epimysium surrounds the entire muscle.
|
habits of the athlete and any recent modifications to that regimen. On physical examination, pain can often be elicited with deep palpation in the area of the musculotendinous junction or the muscle itself. In addition, pain with resistive muscle contraction can localize the traumatized muscle group.
-
The MTU is the weakest biomechanical link and therefore is most often the location of muscle fiber failure.
-
Infection or deep venous thrombosis may be mistaken for a muscle strain.
-
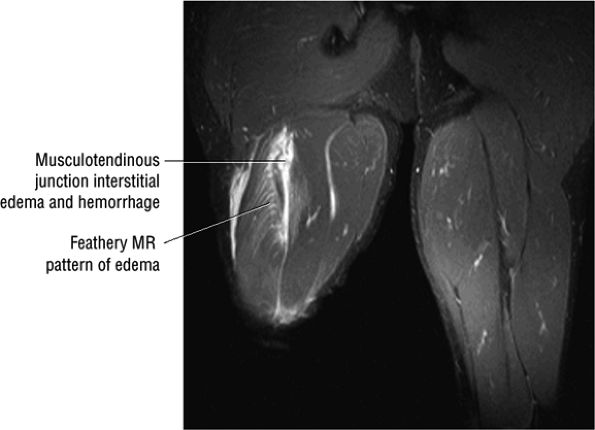
Grade I muscle injuries are associated with a feathery edema pattern of muscle fibers.
-
Muscle pain
-
Weakness, possibly associated with separation of muscle from tendon or fascia (absent in mild or first-degree strains with no myofascial disruption)
-
Edema and swelling
-
Loss of function in third-degree strains with complete myofascial separation
-
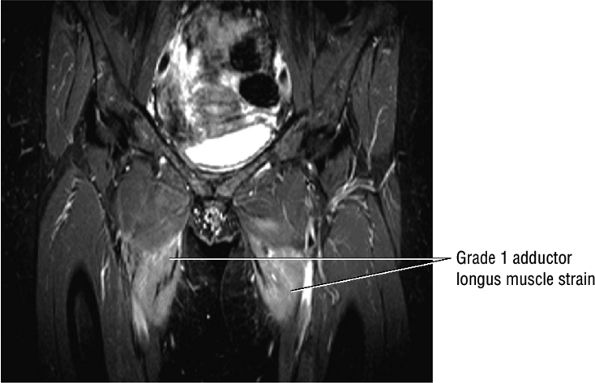
Grade 1: Minimal disruption of the musculotendinous junction (Fig. 3.106). Clinically, a grade 1 strain may simply result in a muscle spasm or cramp.
-
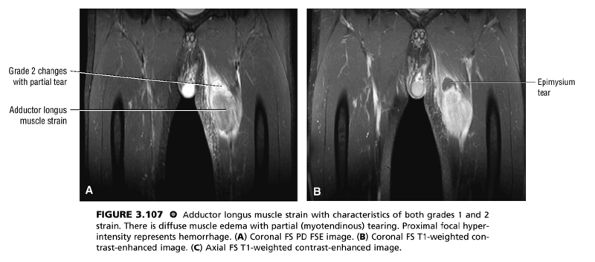
Grade 2: A partial tear with some intact musculotendinous fibers (Fig. 3.107). Clinically, there is discomfort during sports activity or training, but it usually resolves with rest.
-
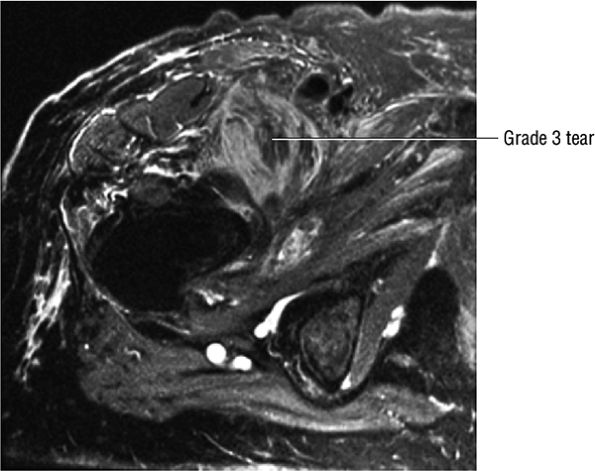
Grade 3: Complete rupture of the MTU (Fig. 3.108)
-
Grade 3B: Avulsion fracture at the tendon origin or insertion
categorized as a mild strain, pathologic findings must be restricted to mild inflammatory cell infiltration, edema, and swelling. In moderate, or second-degree, strains, weakness is associated with a variable degree of separation of muscle from tendon or fascia. In severe, or third-degree, strains, myofascial separation is complete and there is an associated lack of muscle function.
 |
|
FIGURE 3.106 ● Bilateral adductor longus grade 1 muscle strain with diffuse hyperintense muscle edema. Coronal FS PD FSE image.
|
 |
|
FIGURE 3.107 ● Adductor longus muscle strain with characteristics of both grades 1 and 2 strain. There is diffuse muscle edema with partial (myotendinous) tearing. Proximal focal hyperintensity represents hemorrhage. (A) Coronal FS PD FSE image. (B) Coronal FS T1-weighted contrast-enhanced image. (C) Axial FS T1-weighted contrast-enhanced image.
|
 |
|
FIGURE 3.108 ● Grade 3 tear of the iliopsoas in its distal MTU. Axial FS PD FSE image.
|
latter are often treated with wrapping procedures for compression and support of the injured area.128
-
Blurring of muscle fiber striations
-
Hypointense to hyperintense hemorrhagic fluid collections
-
Hypointense subcutaneous tissue edema
-
Grade 1: Hyperintense edema with or without hemorrhage and preservation of muscle morphology (Fig. 3.109). On FS PD, T2 FSE, and STIR images there is an edema pattern, displayed as interstitial hyperintensity with a feathery distribution (Fig. 3.110). Hyperintense subcutaneous tissue edema and intermuscular fluid can also be seen.
-
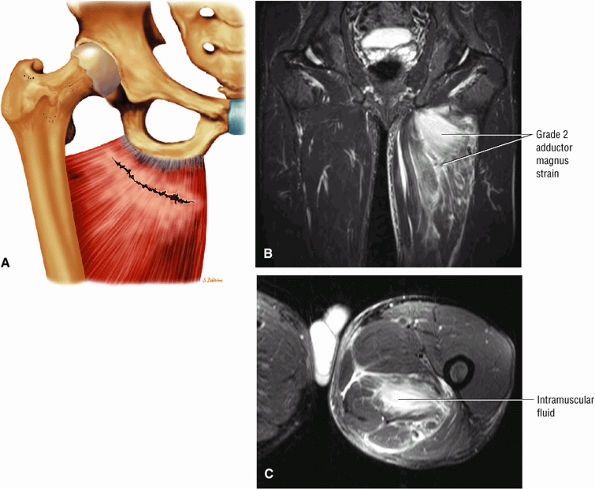
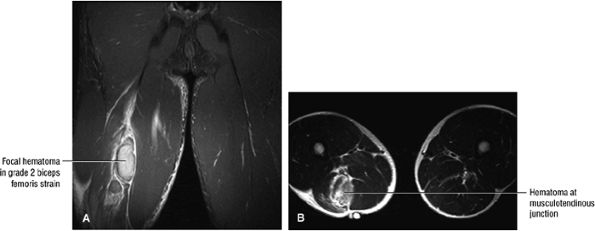
Grade 2: Hyperintense hemorrhage with tearing and disruption of up to 50% of the muscle fibers. Interstitial hyperintensity with focal hyperintensity represents hemorrhage in the muscle belly with or without intramuscular fluid (Figs. 3.111 and 3.112). A hyperintense focal defect and partial retraction of muscle fibers may also be visualized. Associated myotendinous and tendinous injuries as well as hyperintensity and interruption and widening of the MTU are also found.
-
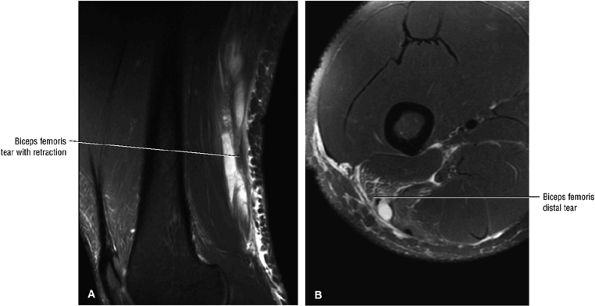
Grade 3: Complete tearing with or without muscle retraction (Fig. 3.113). A fluid-filled gap can be seen, which is hyperintense on FS PD FSE and STIR images. Associated adjacent hyperintense interstitial muscle changes may also be depicted.
 |
|
FIGURE 3.109 ● Grade 1 muscle strain of obturator externus, adductor brevis adductor longus, and pectineus muscles. Axial FS PD FSE image.
|
 |
|
FIGURE 3.110 ● Feathery edema pattern and mild intramuscular fluid (a grade 2 characteristic) in a grade 1 to 2 biceps femoris muscle strain. Coronal FS PD FSE image.
|
fascial or tendinous tears, includes the RICE protocol (rest, ice, compression, elevation); nonsteroidal anti-inflammatory drugs; protective exercises and passive stretching to prevent stiffness, atrophy, and weakness; and isometric and/or isotonic exercises. Treatment of grade 2 strains centers on identifying the offending activity. The injury usually responds to cutting back or altering the training schedule. Cycling or swimming can be temporarily substituted for running to maintain aerobic conditioning. Physiotherapy is beneficial in decreasing muscle spasm and ultimately in regaining flexibility and strength. In general, the recovery period lasts from 2 weeks for grade 1 injuries to over 2 months for grade 2 strains. Grade 3 strains are more difficult to treat and usually require 6 to 8 weeks of rest. Return to full activity is allowed when pain has resolved and muscle strength has returned; this can be effectively judged by using Cybex testing.
 |
|
FIGURE 3.111 ● (A) Coronal color illustration anterior view of a partial tear of the proximal adductor magnus. Coronal (B) and axial (C) FS PD FSE images showing grade 2 adductor magnus strain with proximally localized intramuscular fluid.
|
 |
|
FIGURE 3.112 ● Grade 2 biceps femoris muscle strain with a hematoma at the musculotendinous junction associated with a second-degree injury. Transient sciatica may occur in grade 2 to 3 injuries secondary to compressive sciatic neuropathy. (A) Coronal FS PD FSE image. (B) Axial T2 FSE image.
|
 |
|
FIGURE 3.113 ● Sagittal (A) and axial (B) FS PD FSE images demonstrating distal biceps femoris MTU tear with retraction.
|
-
Contusions are caused by compressive or concussive forms of direct trauma.
-
Contusions involve the deep muscle belly fibers.
-
Muscle edema and hematoma contribute to an increase in muscle girth without architectural disruption.
-
Myositis ossificans is associated with both myonecrosis and hematoma.
of muscle contusion include superficial capillary rupture, interstitial hemorrhage, edema, and an inflammatory reaction.132,134
-
Mild contusion: Active or passive range of motion is limited by less than one third of normal. Patients have an average of 6 days of disability.
-
Moderate contusion: Active motion is limited to one third to two thirds of the normal range of motion, usually due to the presence of muscle spasms. Patients have an average of 56 days of disability.
-
Severe contusion: Active motion is limited by greater than two thirds of the normal range of motion. Patients have longer than 60 days of disability.
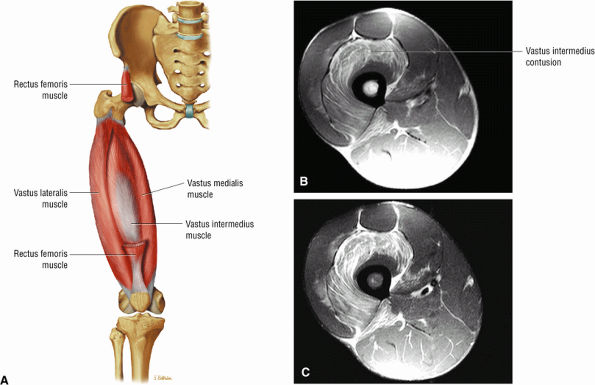 |
|
FIGURE 3.114 ● (A) In comparison to the rectus femoris, the vastus muscles do not cross the hip joint. Note the potential exposure of the vastus lateralis and intermedius to muscle contusion with trauma. Anterior view color illustration of the thigh with resected rectus femoris. Axial PD FSE (B) and FS PD FSE (C) images showing a muscle contusion in a football player involving the vastus intermedius.
|
has been associated with myositis ossificans. Post-contrast-enhanced images define the central core and demonstrate the development of a zonal phenomenon. Adjacent muscle edema is often associated with myositis ossificans on FS PD FSE or STIR images and is a normal finding. The final zonal pattern demonstrates peripheral bone signal without surrounding edema. Rim enhancement alone can be seen in liposarcomas, and thus the zonal pattern or susceptibility of peripheral calcifications can be used to increase the specificity of diagnosis.
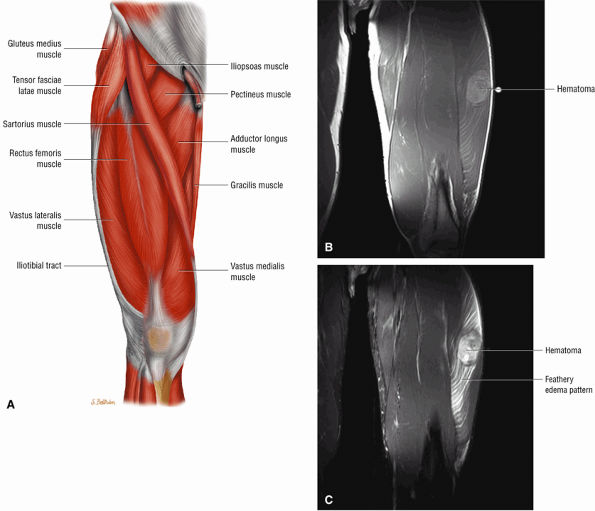 |
|
FIGURE 3.115 ● (A) The vastus lateralis muscle forms the lateral patellar retinaculum contribution and lateral aspect of the quadriceps tendon. A blow to the thigh, as may occur in football players, results in direct compression of the vastus intermedius or vastus lateralis muscle groups against the femur. Coronal PD FSE (B) and FS PD FSE (C) images depicting vastus lateralis contusion with intramuscular hematoma.
|
-
Interstitial hemorrhage occurs between the damaged connective tissues.
-
Hematomas may demonstrate susceptibility with gradient echo imaging.
In addition, the tissues are affected by the presence of oxyhemoglobin, deoxyhemoglobin, and red blood cells.129,132,136 This results in T1 shortening due to oxidative denaturation of hemoglobin and the production of methemoglobin. The concentration of methemoglobin increases over an 80- to 90-hour period following the injury, and the shortening of the T1 relaxation time of the blood-containing tissue follows the time course of methemoglobin production.129,132,136
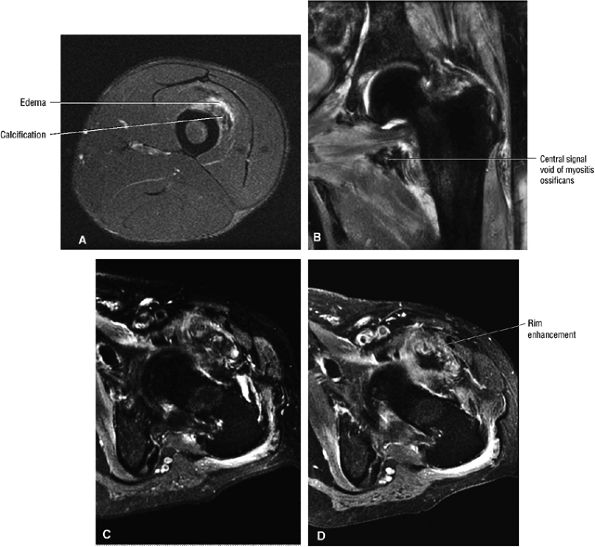 |
|
FIGURE 3.116 ● (A) Axial FS PD FSE image depicting myositis ossificans as a complication of a vastus intermedius muscle injury. Note the characteristic hypointense focus surrounded by hyperintense edema. The hypointense region corresponds to the peripheral rim of calcification seen on CT. (B –D) Myositis ossificans of the iliopsoas muscle demonstrating signal void in areas of more mature osteoid and peripheral calcification and a rim enhancement pattern with contrast. (B) Coronal FS PD FSE image. (C) Axial FS PD FSE image. (D) Axial FS T1-weighted contrast-enhanced image.
|
-
Morel-Lavallée lesions are posttraumatic fluid collections deep to the subcutaneous tissue and superficial to the fascia lata and iliotibial band in the trochanteric region and proximal thigh.
-
Types II and III Morel-Lavallée lesions demonstrate signal inhomogeneity on FS PD FSE images, reflecting nonacute hematomas.
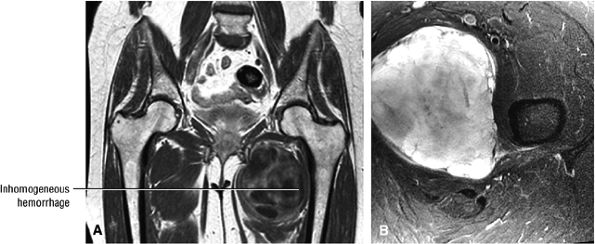 |
|
FIGURE 3.117 ● Focal hemorrhage between the adductor brevis and adductor magnus muscle groups. (A) Coronal PD-weighted image. (B) Axial FS PD FSE image.
|
-
Type I: a fluid-like serohematic effusion (homogeneous and hyperintense on FS PD FSE images)
-
Type II: a subacute hematoma (a thick hypointense capsule with internal hyperintensity. Inhomogeneity of signal is associated with entrapped fatty globules, fluid-fluid levels, and internal septations)
-
Type III: a chronic, organizing hematoma (heterogeneity on FS PD FSE images with hemosiderin, granulation tissue, and necrotic debris)
-
Type IV: perifascial dissection and a closed fatty tissue laceration (hypointense on T1-weighted images and hyperintense on FS PD FSE images)
-
Type V: a perifascial pseudonodular lesion (variable signal intensity with or without peripheral enhancement)
-
Type VI: infection with or without thick capsular septations and a sinus tract (a thick capsule with contrast enhancement and adjacent hyperintense edema on FS PD FSE images)
-
Symptoms peak 24 to 72 hours after nonacute injury.
-
Regeneration begins 3 days after exertion.
-
MR findings are similar to muscle strains.
-
Delayed-onset muscle soreness is often associated with excessive eccentric muscle activity.
the muscular contraction and the duration of exercise, with intensity appearing to be the more important factor.139,140,141,142,143
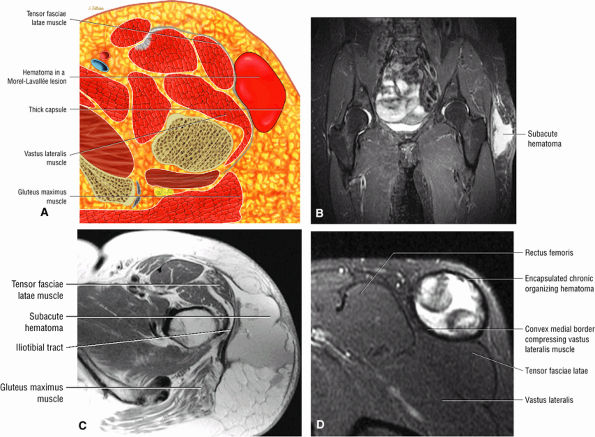 |
|
FIGURE 3.118 ● Type II Morel-Lavallée lesion with subacute hematoma dissecting into the plane between the fascia lata and the subcutaneous fat lateral to the greater trochanter. The lesion is superficial to the iliotibial band. In a type III lesion there is progression to a chronic organizing hematoma. (A) Color axial section illustrating the hemorrhage between subcutaneous tissue and the tensor fasciae latae. (B) Coronal FS PD FSE image. (C) Axial PD FSE image. (D) Axial FS PD FSE image.
|
in MR signal intensity of muscle after exertional injury and the amount of ultrastructural damage present. The highest correlations were found when T1-weighted and PD pulse sequences were used to evaluate signal intensity. These results differ from those of previous studies, which indicated that more prominent delayed signal intensity increases were found on T2-weighted images. The discrepancy in these findings can be explained by differences in the level of exertion, the severity of pain, and the extent of muscle involvement. More sustained exercise causes more severe muscle damage and edema (free water), resulting in greater increased signal intensity on T2-weighted images.146 Correlation between the graded amount of delayed-onset muscle soreness and the degree of ultrastructural injury is poor.146 However, there is good correlation between signal intensity changes and the degree of ultrastructural injury, suggesting that assessment of signal intensity associated with muscle injury may be used to determine the severity of damage.146
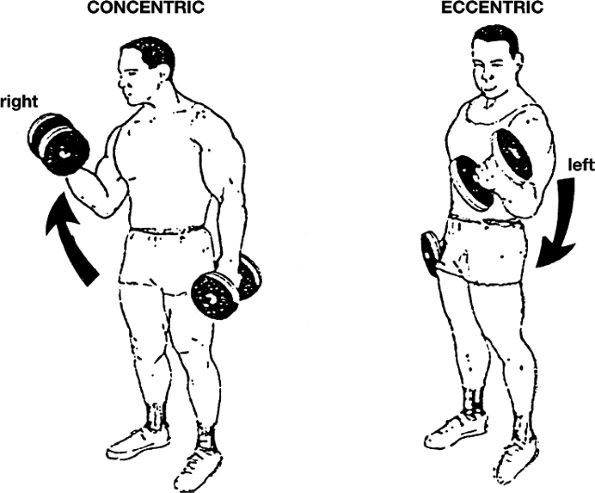 |
|
FIGURE 3.119 ● The two types of muscle action, concentric and eccentric. There is concentric action (shortening) in the right extremity as the weight is raised during performance of a biceps curl. There is eccentric action (lengthening) in the left extremity as the weight is lowered during the biceps curl. Eccentric actions are typically involved in the development of delayed-onset muscle soreness.
|
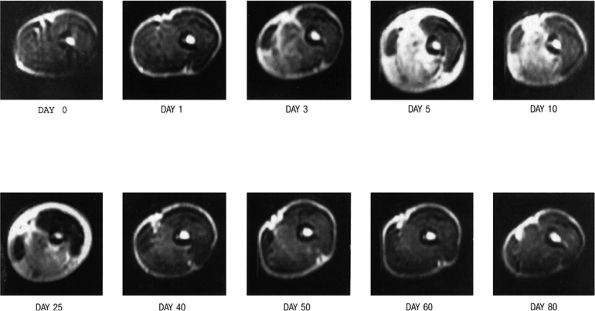 |
|
FIGURE 3.120 ● T2-weighted axial images obtained from the middle upper arm of the subject before (day 0) and serially after performance of eccentric muscle actions. The slight peripheral shading of the image obtained on day 0 was caused by contact of the subject—s arm with the bore of the magnet during imaging. Anatomy is best depicted on the day 1 image, which shows a subtle increase in signal intensity in the biceps and brachialis muscles. The day 3 image shows a more diffuse pattern and a greater increase in signal intensity in the brachialis and almost the entire biceps muscle. The lateral aspect of the biceps, however, appears to have been unaffected throughout the time of the MR evaluation. The peak increased signal intensity is seen on day 5, along with the greatest distortion in the anatomy of the affected muscles. On days 10 and 25, the increased signal intensity is diminished compared with day 5, and it is further reduced on days 40, 50, and 60. Note also the marked increase in the circumference of the affected muscles, which is most apparent on images obtained on days 3, 5, 10, and 25. The image obtained on day 80 shows a return to baseline with regard to signal intensity as well as the size of the affected muscles. This subject had severe symptoms of pain, soreness, and joint stiffness associated with eccentric muscular actions. (TR/TE, 2000/80 msec)
|
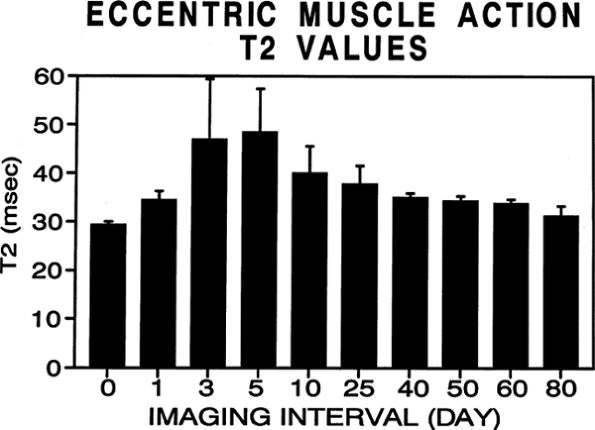 |
|
FIGURE 3.121 ● A graph of the muscle T2 relaxation times before (day 0) and after (days 1, 3, 5, 10, 25, 40, 50, 60, and 80) exercise involving eccentric actions. There was a statistically significant (P < 0.05) increase in T2 relaxation times for each subsequent postexercise imaging interval compared with T2 relaxation times before exercise (day 0). Values are given as means plus or minus the standard deviation. The “T” lines at the top of each bar represent the plus range of the standard deviation.
|
between cramp, with its high-frequency action potentials, and contracture is basic (Fig. 3.123).134,145 Muscle contracture occurs most often in metabolic disorders such as inherited defects of glycolytic enzymes (e.g., myophosphorylase deficiency or McArdle—s disease).134,145,150 After the contracture, patients typically develop elevated serum creatine kinase levels and, when severe, pigmenturia and acute renal failure. During the contracture, there typically is intense pain. In some diseases, such as phosphofructokinase deficiency, patients may have few or no symptoms and yet have marked rhabdomyolysis. In these patients, MR imaging may show extensive zones of myonecrosis and fatty infiltration.134,145,150 Although not specific, the coexistence of muscle edema, atrophy, and fatty infiltration is a significant finding and strongly suggestive of a myopathic or neurogenic disorder.134,145
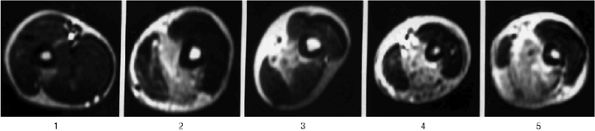 |
|
FIGURE 3.122 ● Delayed-onset muscle soreness. T2-weighted axial images obtained from the middle upper arms of five different subjects on day 5 after performing biceps curl exercises involving eccentric actions. Note the variability in the pattern of increased signal intensity affecting the biceps and brachialis muscles. (TR/TE, 2000/80 msec)
|
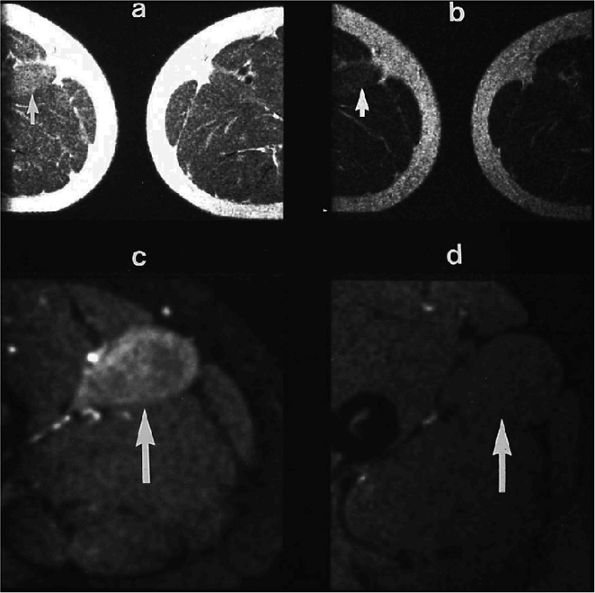 |
|
FIGURE 3.123 ● Thigh muscle contracture in McArdle—s disease (A, B) Spin-echo images of the thighs show questionably increased signal intensity in the right adductor longus (arrows) (A: TR/TE, 1500/30 msec: B: TR/TE 1500/60 msec). (C) The abnormality was unequivocal using the STIR sequence (arrow). (D) STIR image 3 months later documents complete healing, without sequelae.
|
-
Injuries to the deep intramuscular tendon of the indirect head are usually seen in track and field, football, soccer, and basketball injuries.
-
Distal musculotendinous junction tears occur distally at the knee, whereas proximal injuries involve the deep indirect head.
-
Fibrous encasement of the deep tendon is hypointense on FS PD FSE images and is a complication of deep indirect head injuries.
-
Groin or anterior thigh pain, tender to palpation
-
Localized swelling
-
Loss of knee extension
-
An anterior thigh soft tissue mass (in midsubstance strains)
-
Intramuscular fibrosis and recurrent hemorrhage (in chronic midsubstance strains)
-
Thigh asymmetry (in partial or complete tears)
-
Palpable defect with a retracted mass (in complete rupture)
-
Grade 1: Grade 1 or first-degree strains are characterized by a small area of muscle involvement without loss of function (Figs. 3.126 and 3.127). There may be interstitial edema and hemorrhage at the musculotendinous junction with disruption of the endomysium (the connective tissue surrounding individual muscle fibers) and the perimysium (the connective tissue enveloping bundles of muscle fibers).
-
Grade 2: In grade 2 or second-degree strains there is a partial tear of the MTU, and a mass, hematoma, or intramuscular fluid (Fig. 3.128) may be found. There is no retraction. The presence of extramuscular fluid is
P.165P.166P.167P.168
associated with tear of the epimysium (the connective tissue sheath surrounding the muscle). -
Grade 3: In grade 3 or third-degree injuries there is a complete tear at the MTU, with or without a mass or palpable defect. There may or may not be retraction of the mass or detached muscle segment (Fig. 3.129).
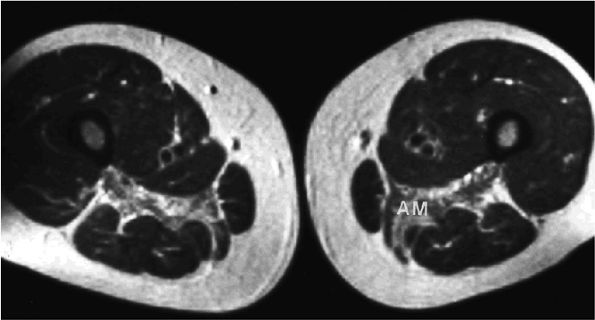 |
|
FIGURE 3.124 ● Fatty infiltration and atrophy as sequelae of exertional muscle injury. A 48-year-old man with phosphofructokinase deficiency (an inherited defect in glycogenolysis) and recurrent subclinical rhabdomyolysis had MR imaging of the thighs performed as a screening test for muscle abnormalities. A T1-weighted spin-echo image demonstrates fatty deposition and focal diminution of the adductor magnus (AM) bilaterally. The case suggests that severe muscle necrosis may lead to atrophy and fatty replacement. (TR/TE, 500/30 msec) (Reprinted with permission from
Fleckenstein JL. Magnetic resonance imaging of muscle injury and atrophy in glycolytic myopathies. Muscle Nerve 1989;12: 849.
) |
|
FIGURE 3.125 ● (A) Proximal mid- and distal muscle cross-sections of the thigh. Distal rectus femoris injuries involve the distal musculotendinous junction and are associated with retraction of the rectus contribution to the quadriceps tendon.(B) Sagittal FS PD FSE image showing a distal musculotendinous grade 3 rupture of the rectus femoris proximal to the knee joint. (C) Axial FS PD FSE image depicting both the indirect head, within the muscle belly of the distal rectus, and more posteriorly the thickened/retracted rectus contribution to the quadriceps tendon. Although this is a distal injury, there is still muscle edema surrounding the indirect head.
|
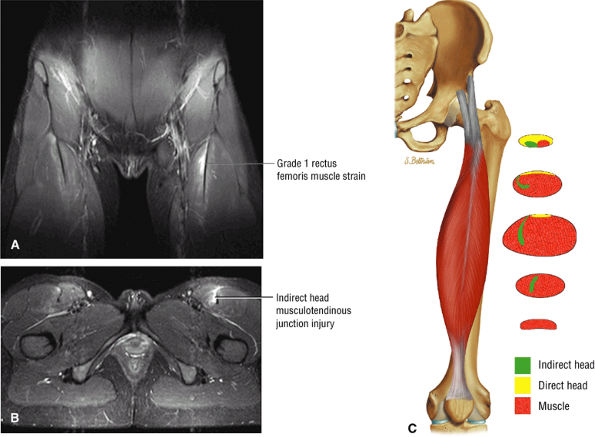 |
|
FIGURE 3.126 ● Coronal (A) and axial (B) FS PD FSE images depicting an acute grade 1 strain of the deep proximal indirect head of the rectus femoris in a football player. There is a mild fluid collection adjacent to the deep musculotendinous junction. The direct head remains anterior as it courses distally in the thigh. (C) The proximal-to-distal course of the rectus femoris indirect head as it rotates from a horizontal to a relatively vertical orientation deep within the muscle belly. The direct head courses in an anterior location and merges with the anterior fascia of the mid-thigh.
|
-
Low- to intermediate-signal-intensity hemorrhage (signal may be hyperintense in subacute hemorrhage)
-
Peripheral hypointense hemosiderin
-
Loss of normal muscle/fat striations
-
Variable synovial and peripheral enhancement of a hemorrhagic focus or muscle disruption
-
A “bull—s-eye lesion” consisting of the peripherally enhancing muscular component of a midsubstance strain
-
Hyperintense edema in the affected muscle
-
A midsubstance mass of inhomogeneous signal intensity
-
A more organized central component of hematoma that demonstrates hypointense to intermediate signal
-
Hyperintense edema and atrophy in subacute injury
-
Adjacent hyperintense fluid signal
-
A cylindrical shape of the tendon of the indirect head
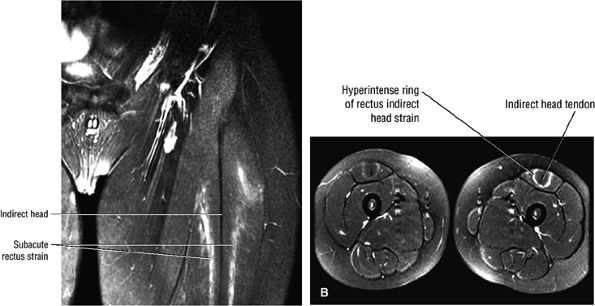 |
|
FIGURE 3.127 ● Subacute bilateral grade 1 strains of the deep musculotendinous junction of the rectus femoris are visualized as a hyperintense ring around the hypointense indirect head on coronal (A) and axial (B) FS PD FSE images.
|
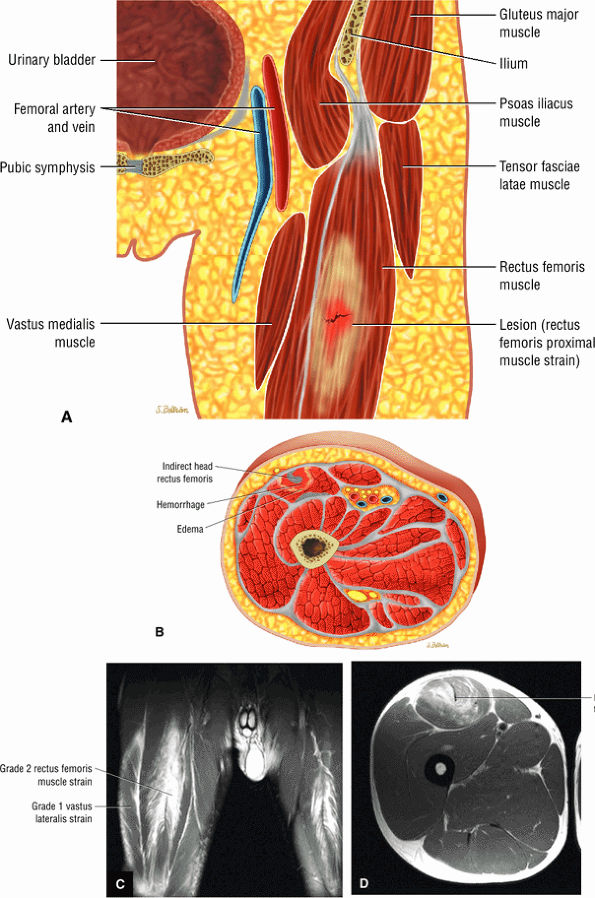 |
|
FIGURE 3.128 ● (A) Coronal color illustration of a grade 2 rectus femoris strain. (B) Axial cross-section color illustration of an acute muscle strain involving the deep tendon of the indirect head. Coronal (C) and axial (D) FS PD FSE images of an acute grade 2 rectus femoris strain with hemorrhage and fluid around the deep musculotendinous junction of the indirect head. The rectus involvement is bilateral and the vastus lateralis is affected on the right.
|
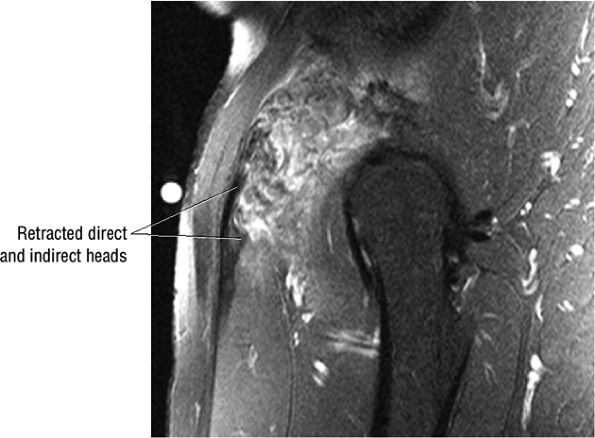 |
|
FIGURE 3.129 ● Soccer-related disruption of the proximal rectus femoris involving both the direct and reflected heads.
|
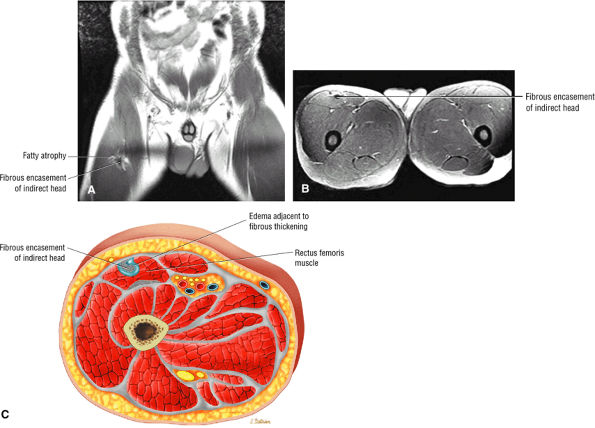 |
|
FIGURE 3.130 ● Fibrous encasement of the deep indirect tendon head. (A) Coronal PD FSE image. (B) Axial FS PD FSE image. (C) Axial color cross-section illustration.
|
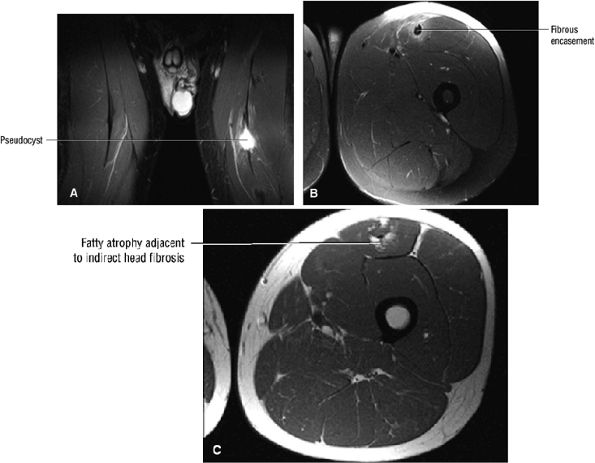 |
|
FIGURE 3.131 ● Pseudocyst formation adjacent to fibrous encasement of the deep indirect head of the rectus femoris. (A) Coronal FS PD FSE image. (B) Axial FS PD FSE image. Pseudocyst formation adjacent to fibrous encasement of the deep indirect head of the rectus femoris. (C) Axial PD DSE image.
|
-
The hamstring group consists of the biceps femoris and the semimembranosus and semitendinosus.
-
Grade I strains are visualized with a feathery pattern of edema.
-
Grade II strains are associated with hyperintense hematoma and intramuscular and extramuscular fluid collections.
-
Grade III strains are associated with a hemorrhage-filled gap and a retracted MTU.
complete tears, avulsion fractures, thickening of the proximal tendon and degenerative changes at the origin, collagenous degeneration, increased intratendon ground substance, and proliferation of fibroblasts and myofibroblasts. There is an absence of inflammatory signs.
-
Gluteal pain and point tenderness
-
Pain and tightness with a forward kicking motion or dynamic hamstring stretch
-
Painful static stretch of the hamstring group
-
Feeling of an impending “pull” of the muscle
-
Ecchymosis or a palpable knot is uncommon in proximal tendinosis.
-
Grade I: Small disruptions of the musculotendinous junction (Fig. 3.132)
-
Grade II: Partial tears (Fig. 3.133)
-
Grade IIIA: Complete rupture (Fig. 3.134)
-
Grade IIIB: An avulsion fracture at the origin or insertion of the tendon
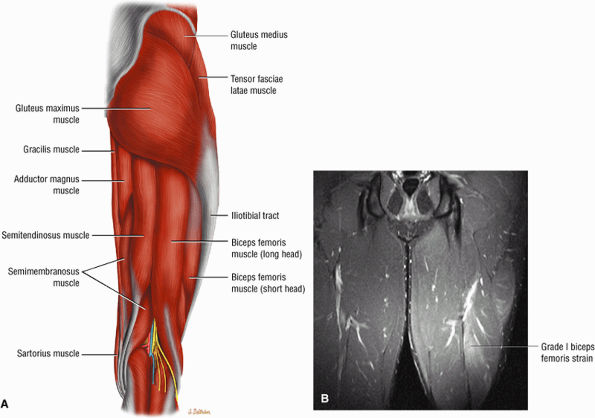 |
|
FIGURE 3.132 ● (A) Superficial and deep muscle groups of the posterior thigh. Since the hamstring tendons overlap the muscle bellies, hamstring injuries can occur in any location. (B) Grade I biceps femoris muscle strain with subtle muscle hyperintensity. Coronal FS PD FSE image.
|
edema or hemorrhage may display a feather-like area of high signal intensity on T2, FS T2-weighted FSE, or STIR images. Subacute injuries may demonstrate increased signal intensity on T1-weighted images. Exertional muscle injuries show a more diffuse pattern of hyperintensity on T2 or STIR sequences. A subacute ischial avulsion may be mistaken for osteomyelitis or neoplasia with an aggressive pattern on corresponding radiographs. MR imaging may show associated edema on fat-suppressed or STIR images. Chronic injuries frequently demonstrate atrophy and fatty replacement of muscles.
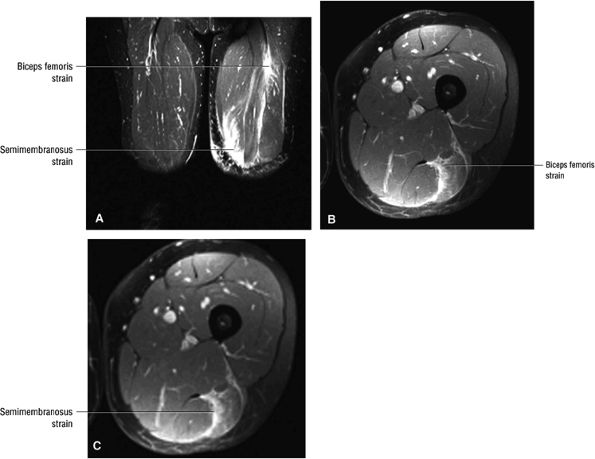 |
|
FIGURE 3.133 ● Proximal biceps femoris and distal semimembranosus grade II strains. Multiple hamstring muscle strains are not infrequent. Dual involvement of the biceps femoris and semitendinosus is the most frequent combination. (A) Coronal FS PD FSE image. (B, C) Axial FS PD FSE images.
|
-
Intermediate signal intensity in thickened hypointense tendon
-
Partial detachment of the hamstring tendon from the ischial tuberosity
-
Small osseous avulsion plus hypointense edema ischial tuberosity
-
Complete avulsion with distal retraction of the common hamstring tendon
-
Intermediate to hyperintense signal within a thickened proximal hamstring tendon
-
Soft tissue hyperintensity parallel to the medial and lateral margins of the common hamstring tendon
-
Localized hyperintense fluid adjacent to tendon degeneration and in the area of a partial tear
-
Adjacent hyperintense subchondral edema of the ischial tuberosity
-
Grade I: Feathery MR edema
-
Grade II: Partial tear, with hyperintense hematoma at the musculotendinous junction and intramuscular and extramuscular laminar fluid collections
-
Grade III: Hyperintense fluid gap in a torn and retracted MTU
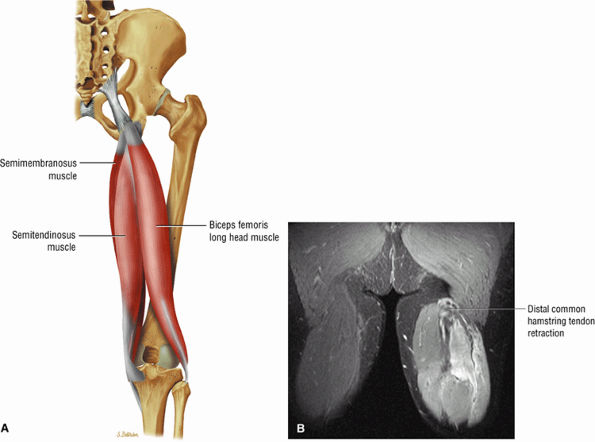 |
|
FIGURE 3.134 ● (A) The musculotendinous junctions of the biceps femoris muscle overlap and effectively extend over the entire longitudinal axis of the muscle as potential sites of injury. Unlike the rest of the hamstring group, including the biceps long head, the short head of the biceps does not cross the hip joint and receives its innervation from the peroneal branch of the sciatic nerve and not the tibial branch. (B) Grade III rupture of the hamstring tendons. Coronal FS PD FSE image.
|
-
ASIS avulsion involves the origin of the sartorius.
-
AIIS avulsion involves the origin of the straight head of the rectus femoris.
-
Acetabular rim avulsion involves the origin of reflected head.
-
Ischial tuberosity avulsion involves the origin of the hamstring muscles.
-
Lesser trochanter avulsion involves the insertion of the iliopsoas.
-
The iliac crest is the attachment of the tensor fascia lata, the gluteus medius, the transverse abdominis, and the internal and external obliques.
-
The symphysis pubis and pubic ramus are the site of origin of the adductor longus, adductor brevis, and gracilis.
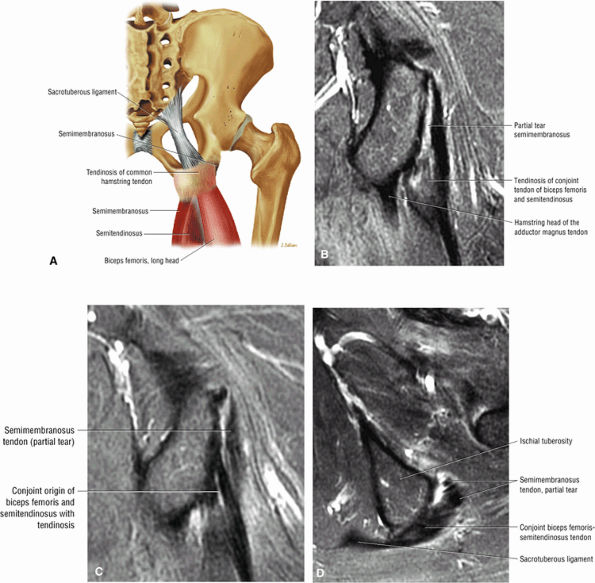 |
|
FIGURE 3.135 ● (A) Color coronal illustration showing the conjoined biceps femoris semitendinosus tendon. This tendon is identified on coronal images through the posterior-most aspect of the ischial tuberosity. Directly anterior to the conjoined tendon is the origin of the semimembranosus tendon. Common hamstring tendon degeneration is illustrated. (B) Coronal FS PD FSE image of the common hamstring tendinosis with partial tearing of the origin of the semimembranosus tendon. (C) Coronal FS PD FSE image of the posterior and medial origins of the conjoined tendon of the biceps femoris and semitendinosus. Note tendinosis of the conjoined tendon. (D) Corresponding axial FS PD FSE image demonstrates preferential tearing of the semimembranosus origin.
|
-
Iliac crest
-
Anterior superior iliac spine (ASIS)
-
Anterior inferior iliac spine (AIIS)
-
Lesser and greater trochanters
-
Ischial tuberosity
-
Acetabular rim
-
Adductor insertion at the symphysis pubis
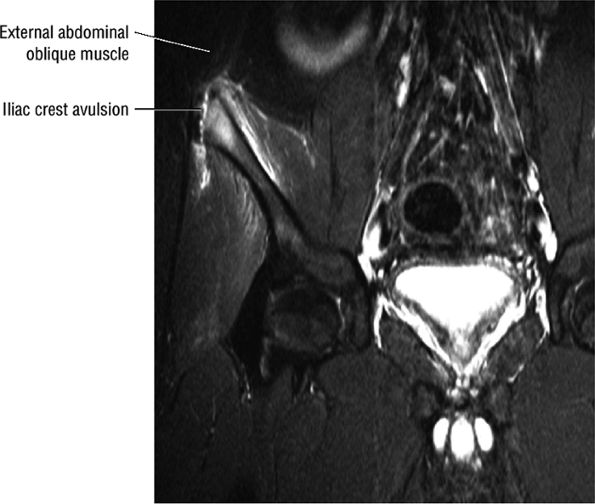 |
|
FIGURE 3.136 ● Avulsion of the iliac crest apophysis related to angulation of the hip in one direction combined with a sudden contraction of the muscles inserting at the iliac crest in the opposite direction. This fracture is at the attachment of the abdominal oblique muscles. Coronal FS PD FSE image.
|
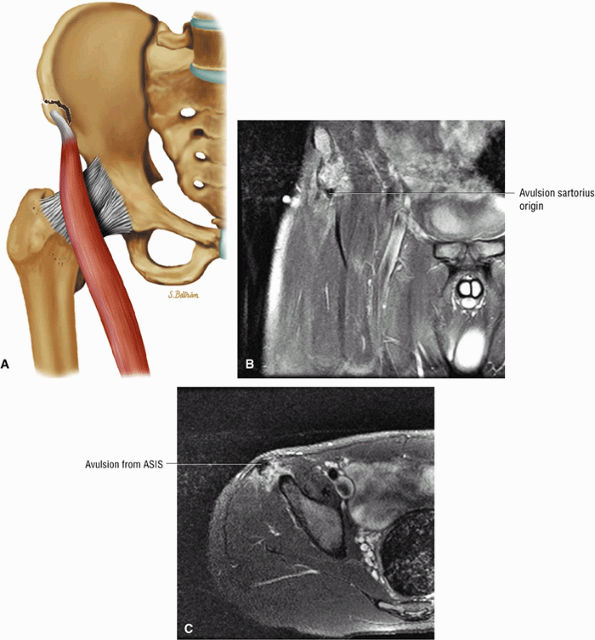 |
|
FIGURE 3.137 ● Sartorius avulsion. (A) Sartorius avulsion occurs with the hip in extension and the knee flexed, as occurs in sports involving kicking and running. Coronal (B) and axial (C) FS PD FSE images depicting avulsion fracture of the anterior superior iliac spine at the origin of the sartorius. These injuries occur with either a sudden violent muscular contraction or excessive muscle stretch across an open apophysis. Avulsion fractures are most common in adolescent athletes between 14 and 17 years of age.
|
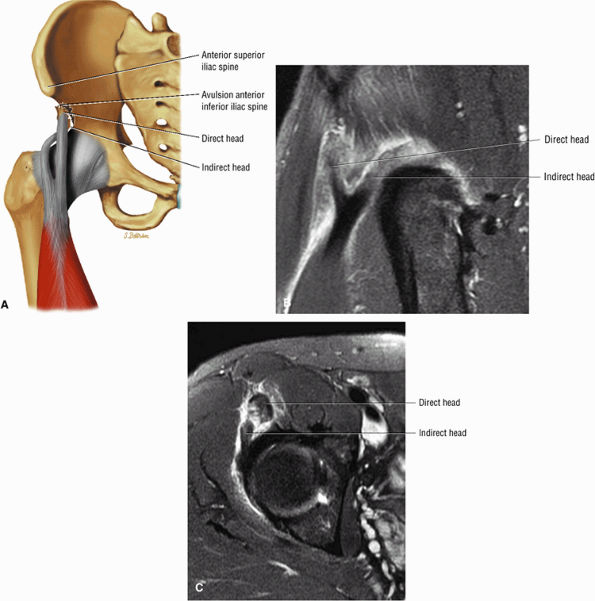 |
|
FIGURE 3.138 ● (A) Coronal color illustration of avulsion of the direct and reflected head origins of the rectus femoris. Sagittal (B) and axial (C) images of complete avulsion of the rectus femoris attachment to both the anterior inferior iliac spine (AIIS) and superior acetabular ridge. Avulsion of the direct head is more common than avulsion of the indirect head because the direct head is taut in the beginning of hip flexion. In increased flexion the indirect head is taut and the direct head becomes lax.
|
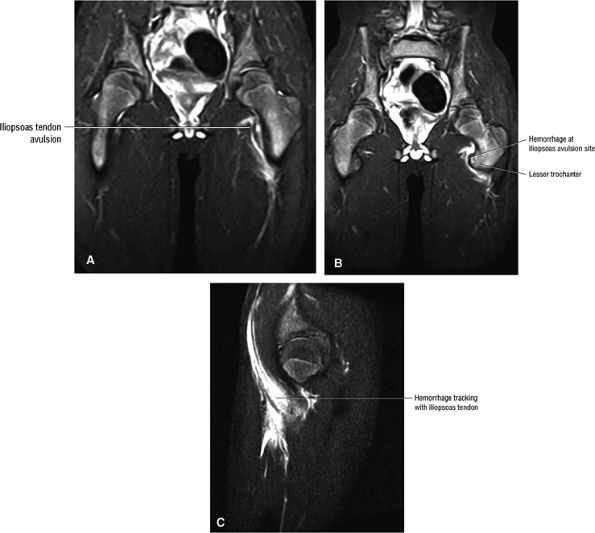 |
|
FIGURE 3.139 ● Iliopsoas tendon avulsion injury in a 14-year-old football player. Sudden traction of the iliopsoas muscle on its tendinous insertion occurs during forceful adduction and flexion of the hip against a fixed or extended thigh. Laxity of the iliopsoas tendon is seen medial to the lesser trochanter and hemorrhage dissects anterior to the iliopsoas, as demonstrated on sagittal images. (A) Coronal FS PD FSE image. (B) Coronal FS PD FSE image. (C) Sagittal FS PD FSE image.
|
of injury involves a sudden, forceful eccentric contraction of the hamstring muscles with the knee in the position of extension and the hip in flexion. Overpull of the hamstrings in this position elicits pain on physical examination, as does a rectal examination. Athletes who run hurdles, long jumpers, gymnasts, cheerleaders who perform the splits, and martial arts participants are at risk. Milch also describes seeing this injury in a dancer doing splits.165 Older patients may also avulse the ischial tuberosity in association with degenerative tendon disease (Fig. 3.141). Treatment is a short period of bed rest followed by protected weight-bearing. Although the fracture invariably heals, exuberant callus formation can occur, causing chronic pain.166 This callus formation may be confused with malignancy, leading to biopsy. Excision may be required for pain relief.
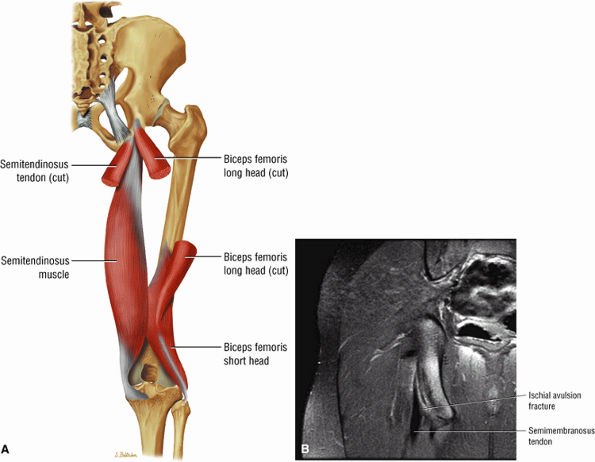 |
|
FIGURE 3.140 ● (A) Posterior thigh musculature. The hamstring muscle group includes the semitendinosus, semimembranosus, and biceps femoris. The gluteus maximus and hamstring muscles represent the primary hip joint extensors. (B) Ischial apophysis avulsion in a 14-year-old. Coronal FS PD FSE image.
|
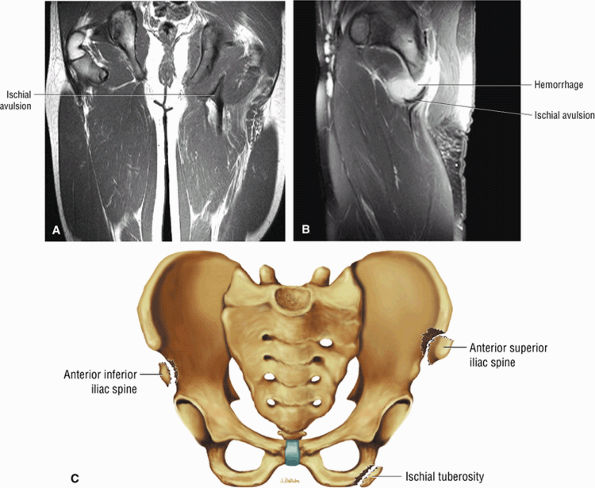 |
|
FIGURE 3.141 ● Ischial avulsion of the hamstring tendons in a 15-year-old. The proximal tendon of the semimembranosus is lateral and anterior to the conjoined tendon of the biceps femoris and semitendinosus. (A) Coronal PD FSE image. (B) Sagittal FS PD FSE image. (C) Coronal color illustration of avulsion injury sites with correlation of ischial tuberosity avulsion side.
|
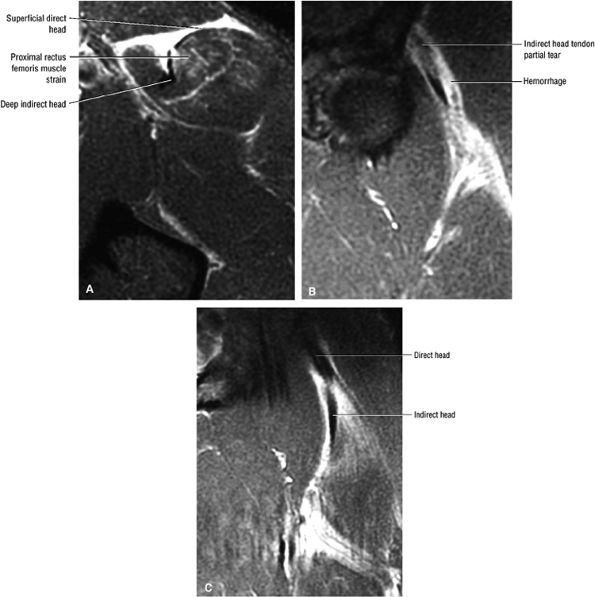 |
|
FIGURE 3.142 ● Partial tear of the reflected head of the rectus femoris in association with a proximal MTU injury. (A) Axial FS PD FSE image. (B) Coronal FS PD FSE image. (C) Coronal FS PD FSE image.
|
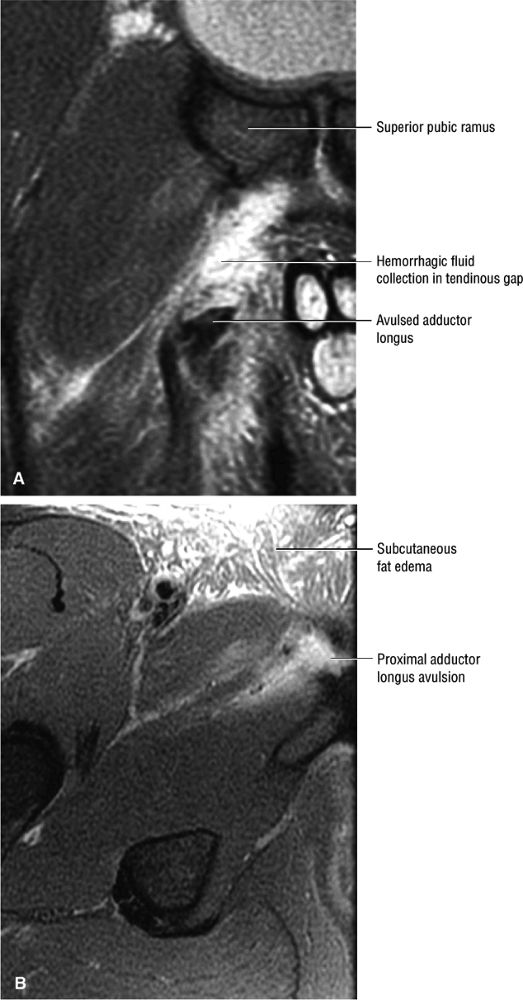 |
|
FIGURE 3.143 ● Avulsed and retracted adductor longus tendon. (A) Coronal FS PD FSE image. (B) Axial FS PD FSE image.
|
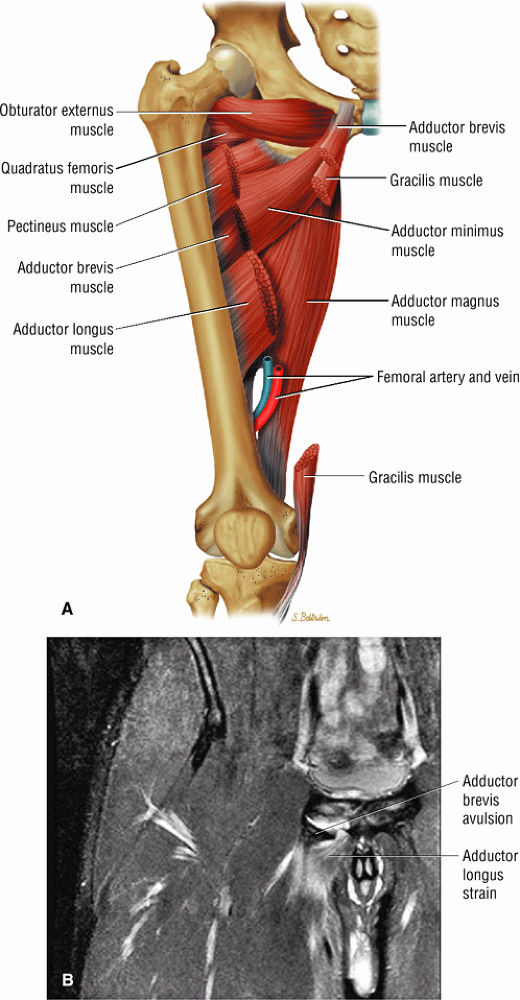 |
|
FIGURE 3.144 ● (A) Adductor muscles. The obturator externus also contributes to adduction. (B) Avulsion of the adductor brevis in an 18-year-old. There is an associated MTU strain of the proximal adductor longus. Coronal FS PD image.
|
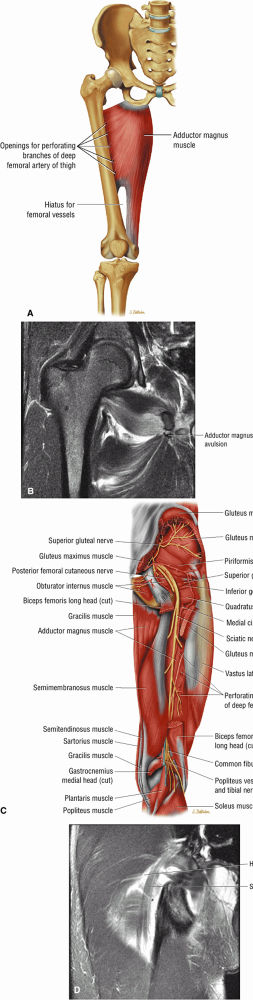 |
|
FIGURE 3.145 ● (A) The primary function of the ischiocondyle part of the adductor magnus is as a hip extensor, and it assists the gluteus maximus and hamstring muscles in hip extension. The anterior part of the adductor magnus functions as a hip adductor. (B) Coronal FS PD FSE image depicts avulsion of the adductor magnus origin at the inferior pubic ramus. The adductor magnus originates at the inferior pubic ramus, the ischial ramus, and the inferolateral ischial tuberosity. Note the associated sprain of the obturator externus. (C) Deep muscles of the posterior thigh. (D) Edema and hemorrhage in proximity to the sciatic nerve may be associated with transient sciatica in grade II to III hamstring or deep posterior thigh trauma. Coronal FS PD image.
|
-
The involved tendon is often lax with redundant morphology.
-
In ASIS avulsion there is mild displacement with or without hypointense edema of adjacent marrow and fluid adjacent to sartorius origin.
-
In AIIS avulsion there is distal fragment displacement and laxity of the straight head of the rectus femoris.
-
In ischial apophysis avulsion there is a displaced fragment with hypointense edema at the donor site.
-
Hyperintense marrow edema at the donor site
-
Hyperintense fluid, soft tissue edema, and hemorrhage at the site of avulsion
-
Hyperintense signal on FS PD FSE or STIR in associated muscle strain
-
Hyperintense edema of the iliopsoas adjacent to the lesser trochanter
-
The anterior facet of the greater trochanter is the attachment site of the gluteus minimus.
-
The lateral facet of the greater trochanter is the attachment site of the gluteus medius muscle and the superoposterior facet is the attachment of the gluteus medius tendon.
-
The trochanteric bursa is the subgluteus maximus bursa.
-
The subgluteus medius bursa is deep to the gluteus medius tendon and the subgluteus minimus bursa is deep to the gluteus minimus tendon.
-
Adductor tendon pathology includes tendinosis, partial tears, and full-thickness tears.
-
The anterior facet-gluteus minimus attachment (Fig. 3.147): the gluteus minimus is visualized anteriorly on sagittal images through the greater trochanter.
-
The lateral facet-gluteus medius muscle attachment (see Fig. 3.146)
-
The superoposterior facet-gluteus medius tendon attachment (Fig. 3.148): the gluteus medius tendon attachment is posterior to the minimus attachment anteriorly and the muscular fibers of the medius attachment as viewed on sagittal images through the greater trochanter.
-
The posterior facet has no tendon attachments and is covered by the trochanteric bursa (see below).
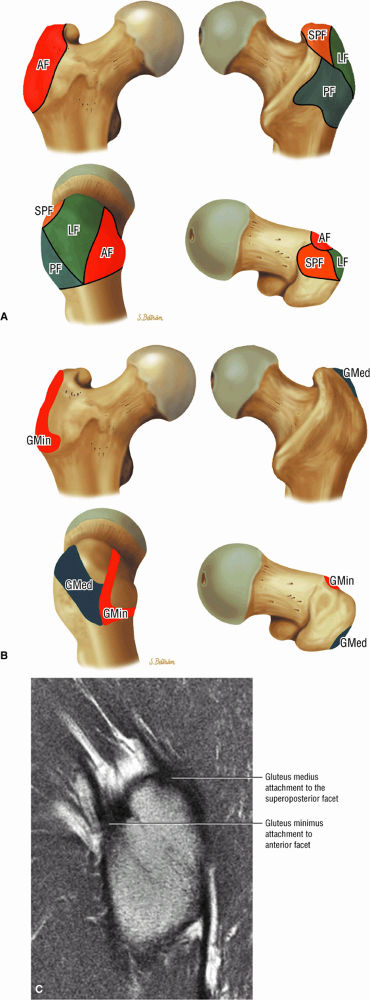 |
|
FIGURE 3.146 ● (A) Greater trochanter facet anatomy. AF, anterior facet; LF, lateral facet; SPF, superoposterior facet; PF, posterior facet. (B) Osseous attachment sites of the gluteus medius and gluteus minimus tendons to the greater trochanter facets. GMin, gluteus minimus tendon attachment to the anterior facet; GMed, gluteus medius lateral tendon attachment to the lateral facet and main tendon attachment to the superoposterior facet. (C) Sagittal T1-weighted image showing gluteus minimus and medius attachments to the greater trochanter. The minimus tendon attaches to the anterior facet and the medius tendon attaches to the superoposterior facet.
|
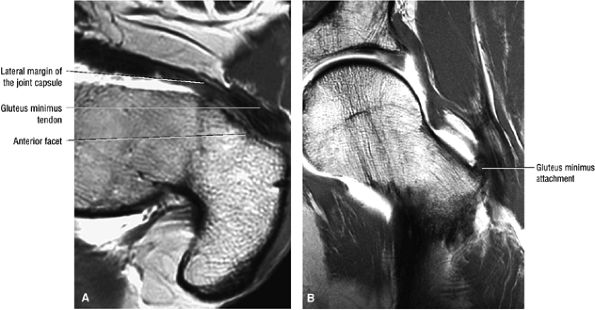 |
|
FIGURE 3.147 ● T1-weighted MR arthrograms showing the attachment of the gluteus minimus tendon to the anterior facet in the axial (A) and coronal (B) planes.
|
-
The trochanteric bursa (Fig. 3.150) is also referred to as the subgluteus maximus bursa. The largest of the three bursal structures, it covers the posterior facet and partially covers the lateral facet. It is found deep to the gluteus maximus and iliotibial tract and can be visualized anterior to the gluteus maximus on sagittal or axial MR images. It parallels the linear contour (see Fig. 3.150) of the posterior facet. Sometimes two trochanteric bursae are present, a superficial bursa deep to the fascia lata and a deep bursa located medial to the superficial bursa.
-
The subgluteus medius bursa (Fig. 3.151) is located deep to the lateral aspect of the gluteus medius muscles and tendons. It covers the superior aspect of the lateral facet but is difficult to visualize unless distended with fluid. The superior border of this bursa is at the tip of the greater trochanter.
-
The subgluteus minimus bursa (Fig. 3.152) is deep to the gluteus minimus tendon and medial and superior to its insertion. It can be seen extending anterior and medial to the minimus tendon on sagittal images through the greater trochanter.
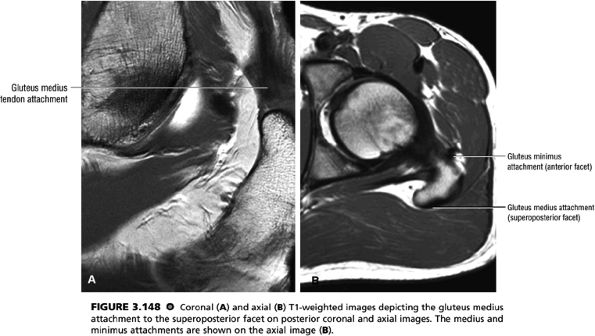 |
|
FIGURE 3.148 ● Coronal (A) and axial (B) T1-weighted images depicting the gluteus medius attachment to the superoposterior facet on posterior coronal and axial images. The medius and minimus attachments are shown on the axial image (B).
|
from the lower back. In both cases, it is important to differentiate between bursitis and lumbar disease. Rheumatoid arthritis is also associated with trochanteric bursitis. Treatment consists of activity modification, physical therapy, and nonsteroidal anti-inflammatory drugs. Occasionally, local steroid injection and, less commonly, surgical intervention play a role.
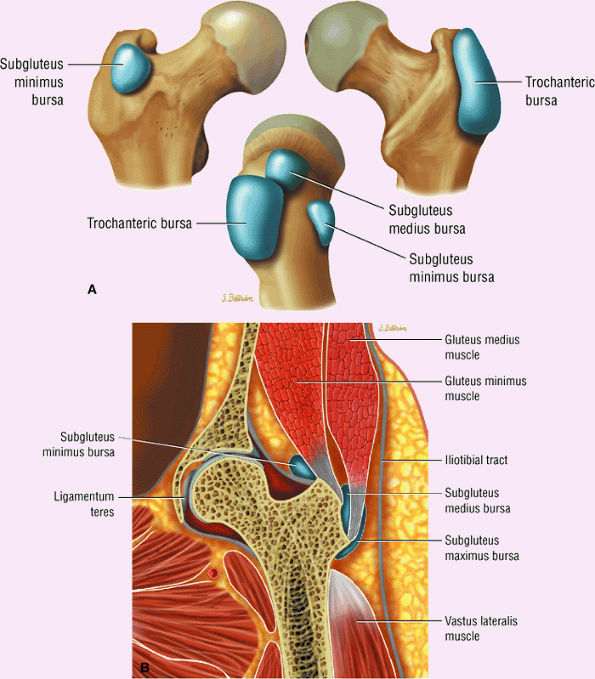 |
|
FIGURE 3.149 ● Location of the three greater trochanter bursae (the trochanteric or subgluteus maximus bursa, the subgluteus medius bursa, and the subgluteus minimus bursa). (A) 3D color illustration. (B) Coronal color section.
|
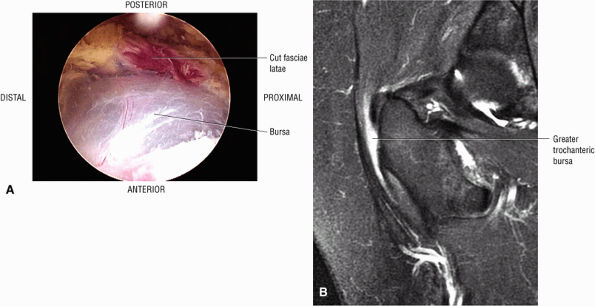 |
|
FIGURE 3.150 ● (A) Arthroscopic view of the trochanteric or subgluteus bursa. The trochanteric bursa has a contour parallel to the posterior facet. (B) Coronal FS PD FSE image showing the linear contour of greater trochanteric bursa in a patient with associated tendinosis of the gluteus minimus tendon.
|
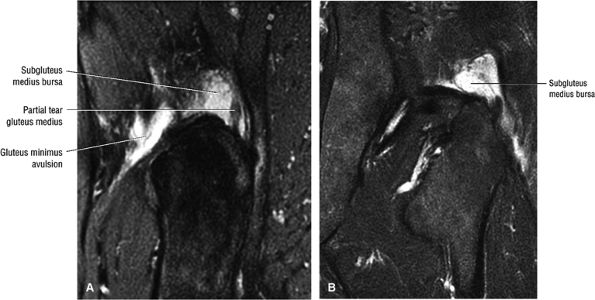 |
|
FIGURE 3.151 ● Subgluteus medius bursa involvement in a patient with avulsion of the minimus and partial tear of the medius tendons. (A) Sagittal FS PD FSE image. (B) Coronal FS PD FSE image.
|
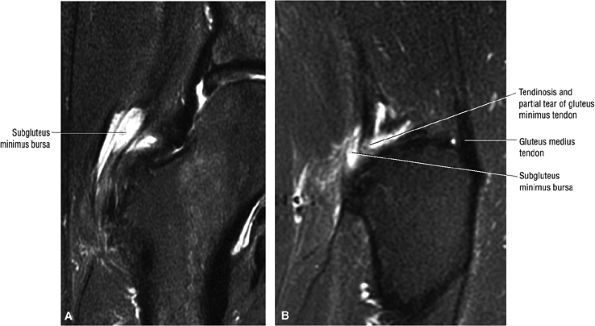 |
|
FIGURE 3.152 ● Subgluteus minimus bursal inflammation associated with tendinosis and partial tear of the gluteus minimus tendon. (A) Coronal FS PD FSE image. (B) Sagittal FS PD FSE image.
|
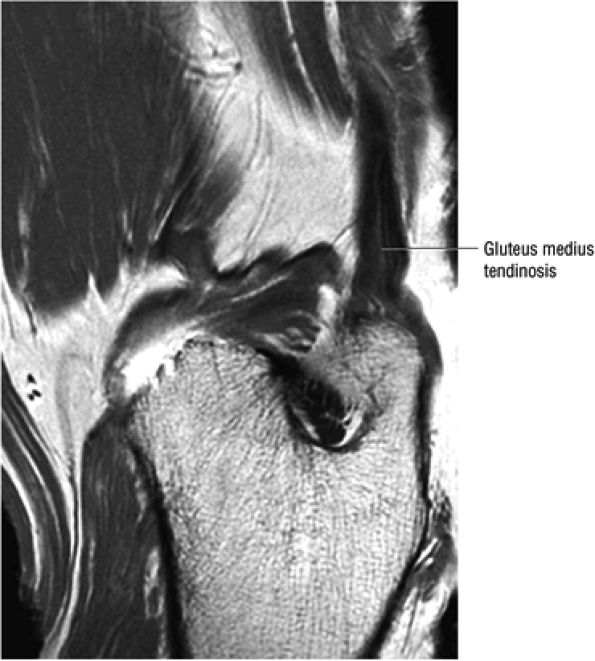 |
|
FIGURE 3.153 ● Gluteus medius tendinosis with intermediate-signal-intensity degeneration within the normally hypointense tendon. Sagittal PD-weighted image.
|
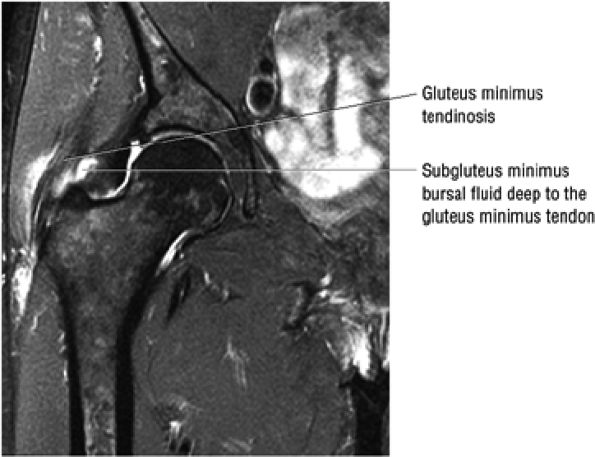 |
|
FIGURE 3.154 ● Tendinosis of gluteus minimus associated with subgluteus minimus bursitis. Coronal FS PD FSE image.
|
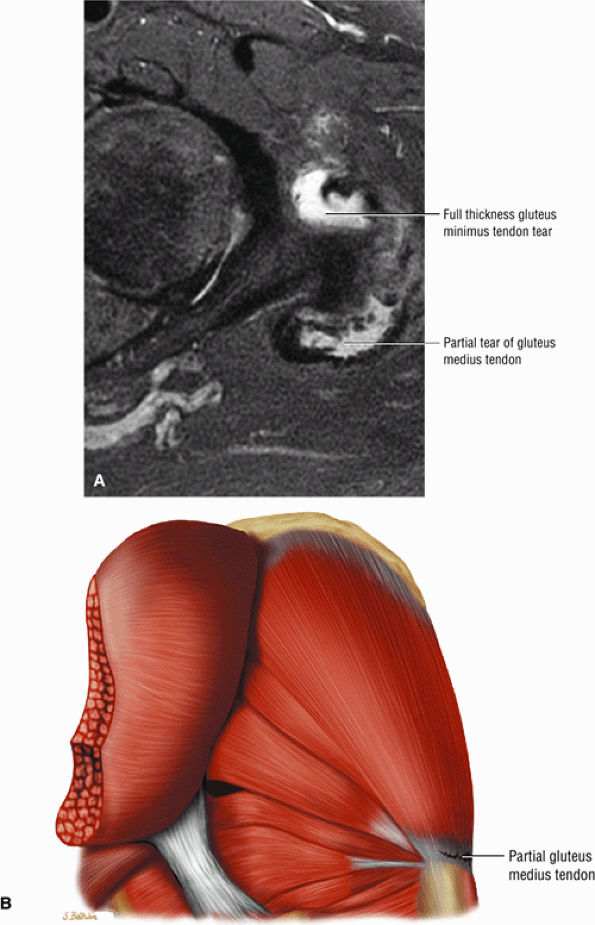 |
|
FIGURE 3.155 ● (A) Axial FS PD FSE image showing a partial tear of the posterior gluteus medius in comparison to a full-thickness fluid-filled tendinous defect in the anterior gluteus minimus. (B) Posterolateral coronal color illustration of a partial gluteus medius tendon tear.
|
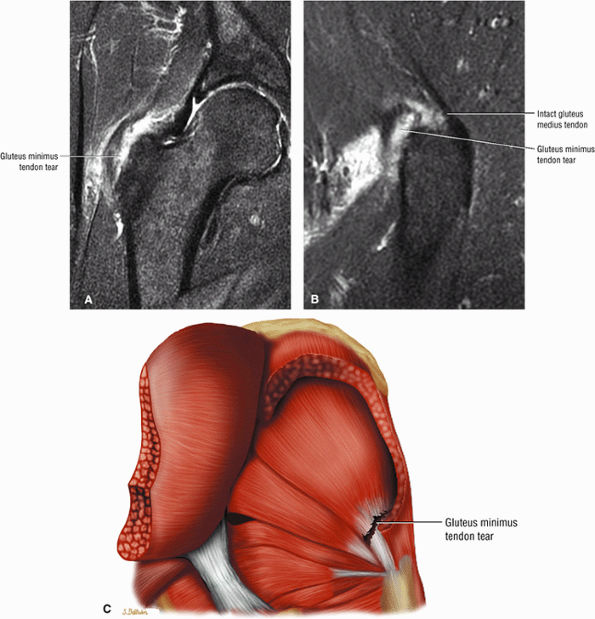 |
|
FIGURE 3.156 ● Complete full-thickness tear of the gluteus minimus tendon. The gluteus medius is intact. (A) Coronal FS PD FSE image. (B) Sagittal FS PD FSE image. (C) Posterior coronal illustration.
|
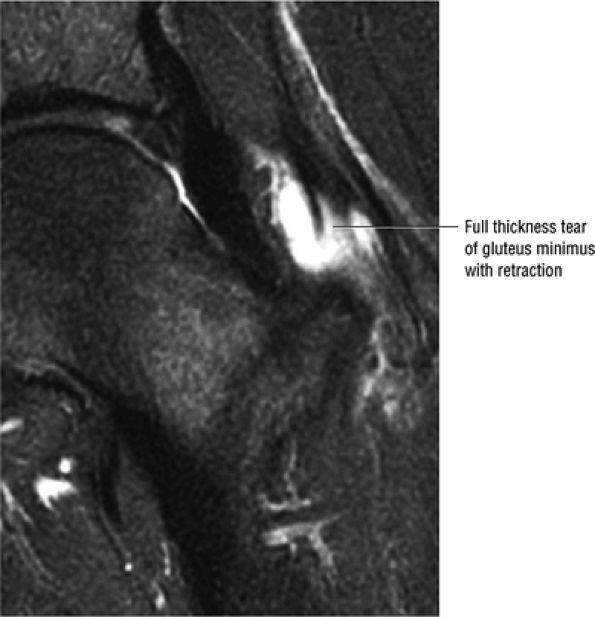 |
|
FIGURE 3.157 ● Full-thickness tear with proximal retraction of the gluteus minimus. Coronal FS PD FSE image.
|
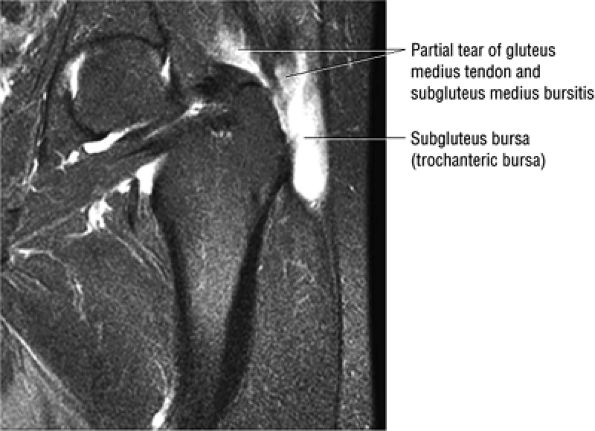 |
|
FIGURE 3.158 ● Prominent gluteus medius bursitis associated with partial tearing of the gluteus medius tendon and hyperintensity of the subgluteus bursa. Coronal FS PD FSE image.
|
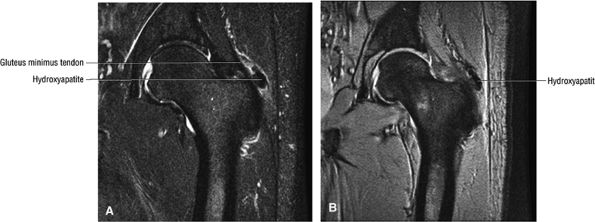 |
|
FIGURE 3.159 ● Hydroxyapatite deposition adjacent to the minimus tendon. Calcific tendinosis (tendinitis) may involve the gluteus maximus, minimus, or medius attachments. (A) Coronal FS PD FSE image. (B) Coronal T2* gradient echo image.
|
-
In gluteus minimus and medius tendinosis the tendons may appear either thickened or attenuated. There is increased signal on FS PD FSE images. Non-fat-suppressed T2-weighted images demonstrate intermediate-signal-intensity tendinosis and no tearing.
-
In partial tears there is hyperintensity with abnormal morphology of torn tendon fibers on both FS PD FSE and T2 FSE images. Interstitial tears (Fig. 3.161) show hyperintense signal without tendon contour abnormalities. Gluteal tendon injuries may be associated with grade 1 or 2 muscle strains (Fig. 3.162).
-
In full-thickness tears or with granulation tissue and synovitis, there is a fluid-filled gap with discontinuity
P.198P.199P.200
of the retracted or torn tendon. Fatty atrophy (Fig. 3.163) can sometimes be appreciated on T1- or PD-weighted images and should be noted. Fatty atrophy is defined as a 25% or greater decrease in muscle volume compared to the contralateral side. Hyperintensity superior to the greater trochanter and gluteus medius tendon elongation (retraction of the musculotendinous junction) may also be associated with full-thickness tears.
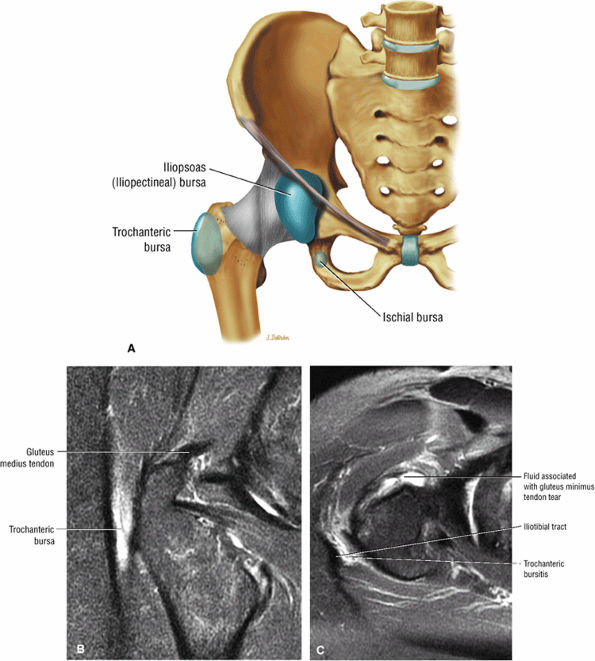 |
|
FIGURE 3.160 ● (A) Greater trochanteric bursa superficial to the posterior facet of the greater trochanter. (B and C) Greater trochanteric bursitis associated with a tear of the gluteus minimus tendon. The greater trochanteric bursa is identified between the gluteus maximus muscle and the iliotibial tract. (B) Coronal FS PD FSE image. (C) Axial FS PD FSE image.
|
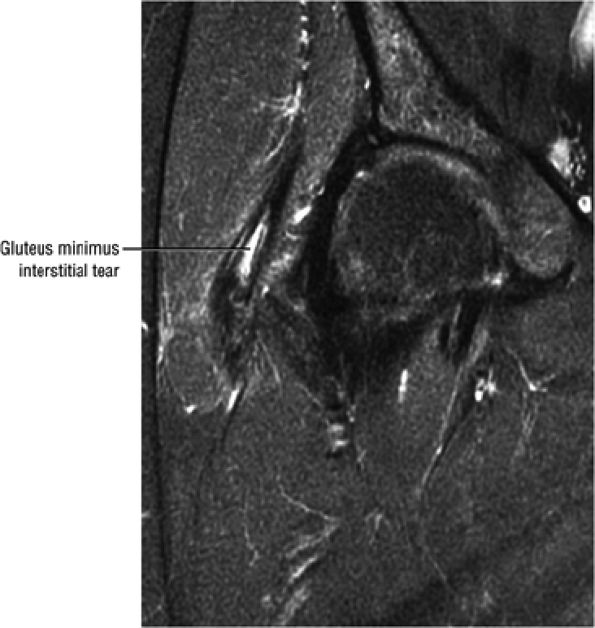 |
|
FIGURE 3.161 ● Intratendinous signal intensity in an interstitial tear of the gluteus minimus. Coronal FS PD FSE image.
|
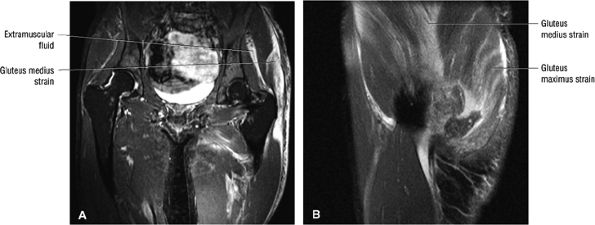 |
|
FIGURE 3.162 ● Gluteus medius and maximus grade 2 muscle strains with intramuscular and extramuscular hemorrhagic fluid collections. Associated adductor muscle group strains are also present. (A) Coronal FS PD FSE image. (B) Sagittal FS PD FSE image.
|
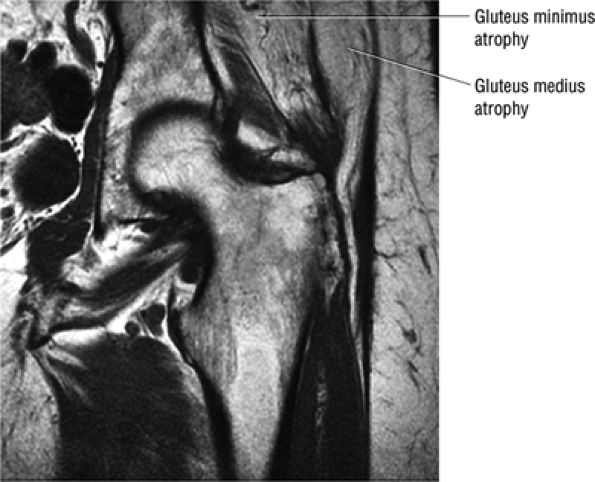 |
|
FIGURE 3.163 ● Gluteus medius atrophy associated with chronic tear. Coronal T1-weighted image.
|
-
Neuritis of the proximal sciatic nerve is associated with trauma to the gluteal region.
-
Pathology is related to hypertrophy of the piriformis, compression of the sciatic nerve, myositis ossificans, and mass lesion.
The origin of the piriformis is anterior to the S2 to S4 vertebrae, the sacrotuberous ligament, and the upper margin of the greater sciatic foramen. It then passes through the greater sciatic notch to insert on the superior aspect of the greater trochanter. Its primary functions are external rotation with the hip in extension and abduction with the hip in flexion. It is innervated by the nerve roots of L5, S1, and S2. When assessing the piriformis it is necessary to remember that there are several developmental variations in the anatomic relationship between the sciatic nerve and piriformis.
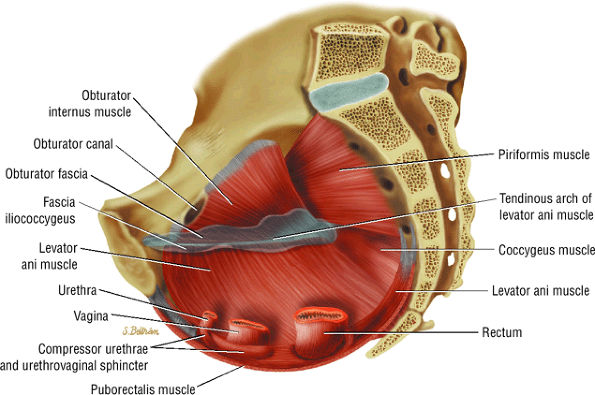 |
|
FIGURE 3.164 ● Obturator internus and piriformis as viewed from the pelvis.
|
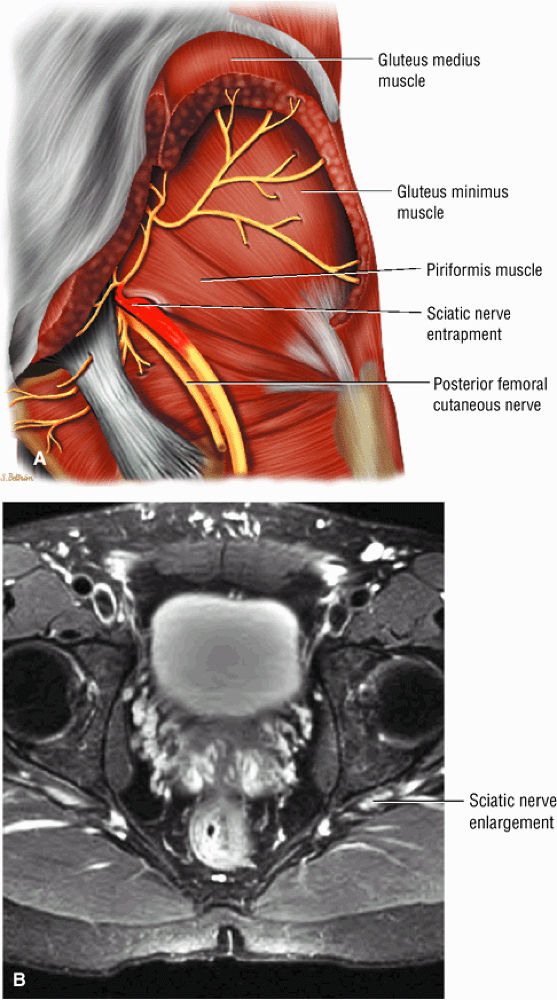 |
|
FIGURE 3.165 ● (A) Entrapment of the sciatic nerve as it courses through the sciatic notch. Trauma to the posterior thigh may result in irritation, inflammation, spasm, adhesion, and hypertrophy of the piriformis muscle and secondary dysfunction of the sciatic nerve. (B) Enlargement of left sciatic nerve with inflammation. Axial FS PD FSE image.
|
-
Hypertrophy of the piriformis (Fig. 3.166), due to increased strain on the hip abductors, repetitive exercise-induced trauma, chronic low-energy trauma (e.g., sitting on a hard surface for prolonged periods), and bipartite and accessory muscle fibers
-
Sciatic nerve compression
-
Myositis ossificans
-
Associated mass lesion causing compression/entrapment (tumor, abscess, or hematoma) (Fig. 3.167)
-
Piriformis split by sciatic nerve
-
Inflammation
-
Interstitial myofibrositis, with extravasation of blood; release of serotonin, prostaglandin E, bradykinin, and histamine; neuritis; and fibrosis
-
Pain elicited by passive hip flexion and internal rotation, known as Frielberg—s sign
-
Pain elicited by resisted abduction and external rotation, known as Pace—s sign
-
Lasègue sign (pain at the greater sciatic notch in knee extension and hip flexion)
-
Pain at the sacroiliac joint, gluteal muscle, or greater sciatic notch
-
Pain with the Valsalva maneuver
-
Dyspareunia or pain radiating to the genitals
-
Appearance of the piriformis as a sausage-shaped mass
-
Chronic gluteal atrophy
-
History of trauma
-
An increase in pain with lifting the extremity and a decrease in pain with traction
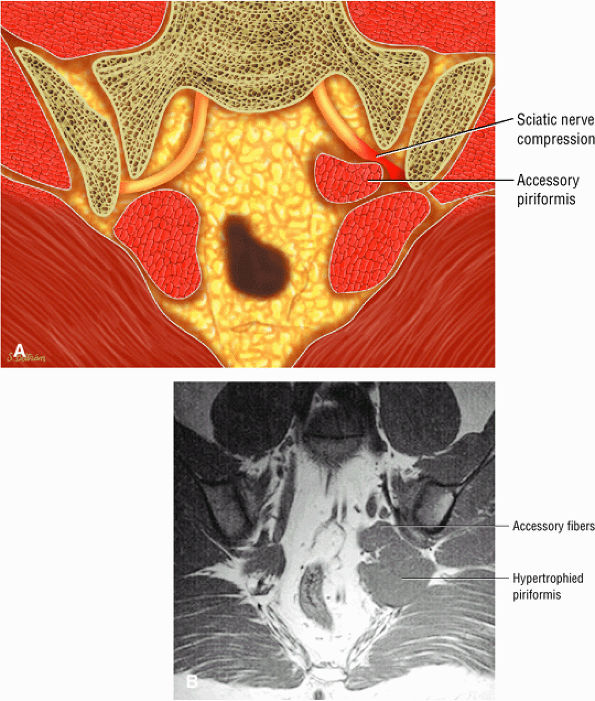 |
|
FIGURE 3.166 ● Piriformis syndrome with accessory fibers of a hypertrophied left piriformis muscle in a fighter pilot who carried his money in his left back pocket. Piriformis syndrome is also known as wallet sciatica. (A) Color illustration coronal section. (B) Coronal T1-weighted coronal oblique image.
|
hypertrophy and effacement of fat in the greater sciatic foramen with muscle signal intensity. There is loss of muscle striations and a mass effect resulting in displacement of the muscle from anterior to posterior. Diffuse muscle edema is hyperintense on T2-weighted images. FS PD FSE images display edema associated with tumor, abscess, or hematoma. The gluteus minimus and medius and tensor fascia lata are normal, and there may or may not be signal changes within the gluteus maximus. On fat-suppressed or STIR images, gluteal atrophy may be visualized.
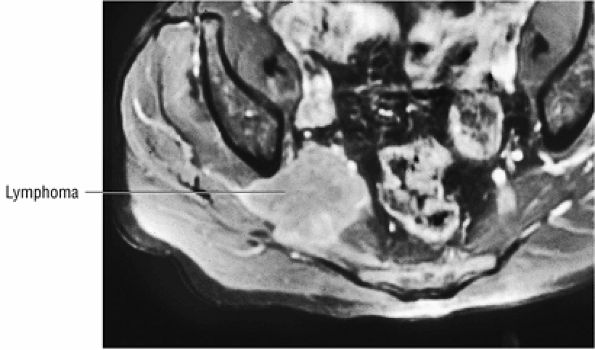 |
|
FIGURE 3.167 ● Lymphoma compressing the right piriformis muscle and displacing the sciatic nerve posteriorly. Axial FS PD FSE image.
|
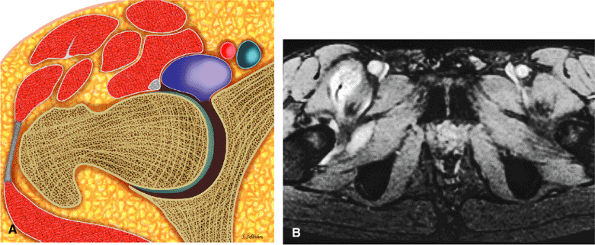 |
|
FIGURE 3.168 ● Distention and communication of the iliopsoas bursa with the hip joint. (A) Transverse section color illustration. (B) Axial FS PD FSE image.
|
-
The iliopsoas bursa is medial to the iliopsoas muscle.
-
Bursitis may be associated with overuse, rheumatoid arthritis, trauma, and the snapping hip syndrome.
-
MR appearance is hyperintense on FS PD FSE images; heterogeneity is associated with synovitis or infection.
-
There is communication with the hip joint through the tail-like extension.Iliopsoas bursitis, also known as iliopectineal bursitis,164 iliofemoral bursitis, sub-psoas bursitis, and the iliopsoas syndrome, is an inflammation of the iliopsoas bursa (Fig. 3.168). It may be accompanied by the snapping hip syndrome, a snapping sensation caused by the psoas tendon passing over the iliopectineal eminence on the pubis.169 The snapping hip syndrome is discussed in more detail below.
pathology such as AVN. In inflammatory and infectious disorders (Fig. 3.169), MR imaging demonstrates heterogeneity of the bursal fluid signal.
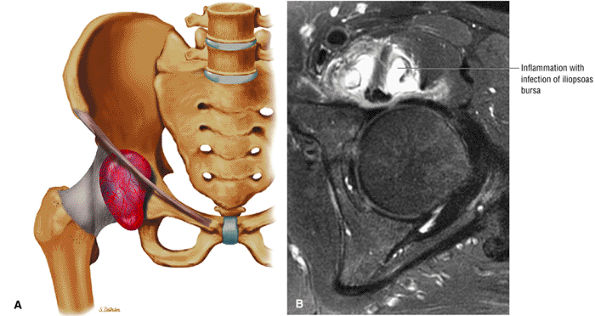 |
|
FIGURE 3.169 ● (A) Inflammation of the iliopsoas bursa anterior to the hip joint. Coronal color illustration, anterior view. (B) Infected iliopsoas bursa with irregular margins and hyperintense heterogeneity. Axial FS PD FSE image.
|
-
May be classified as intra-articular, external, or internal
-
Snapping occurs during hip flexion and extension.
-
External type occurs as the proximal iliotibial band slides over the greater trochanter.
-
Internal type occurs as the iliopsoas snaps over the iliopectineal eminence.
-
Fluid signal intensity or edema associated with the iliopsoas tendon can be identified on FS PD FSE images.
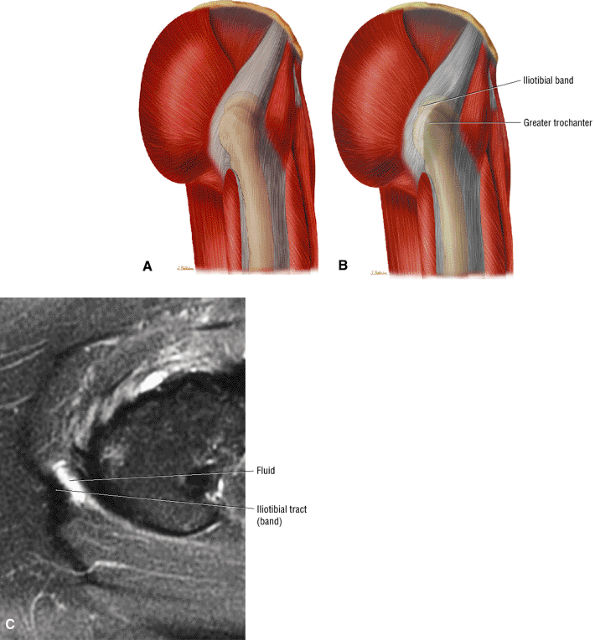 |
|
FIGURE 3.170 ● Snapping of the iliotibial band occurs as it displaces or subluxes posteriorly over the greater trochanter in internal rotation. (A) The iliotibial band in a neutral position. (B) Subluxation of the iliotibial band in internal rotation. (C) Axial FS PD FSE image showing edema and fluid deep to the iliotibial band at the level of the greater trochanter associated with a snapping tendon.
|
-
External: External snapping hip (Fig. 3.170), the most common type, is related to friction from the posterior aspect of the iliotibial band as it slides over the greater trochanter as the hip extends from a flexed position. Friction from the anterior edge of the gluteus maximus may also contribute.
-
Internal: Internal snapping hip (Fig. 3.171) is caused by snapping of the iliopsoas tendon over the iliopectineal eminence, femoral head, or anterior capsule.
-
Intra-articular: Intra-articular snapping is caused by an abnormality in the joint itself, such as a labral tear or loose bodies (labral or chondral fragments) (see discussions below on Loose Bodies and Labral Tears).
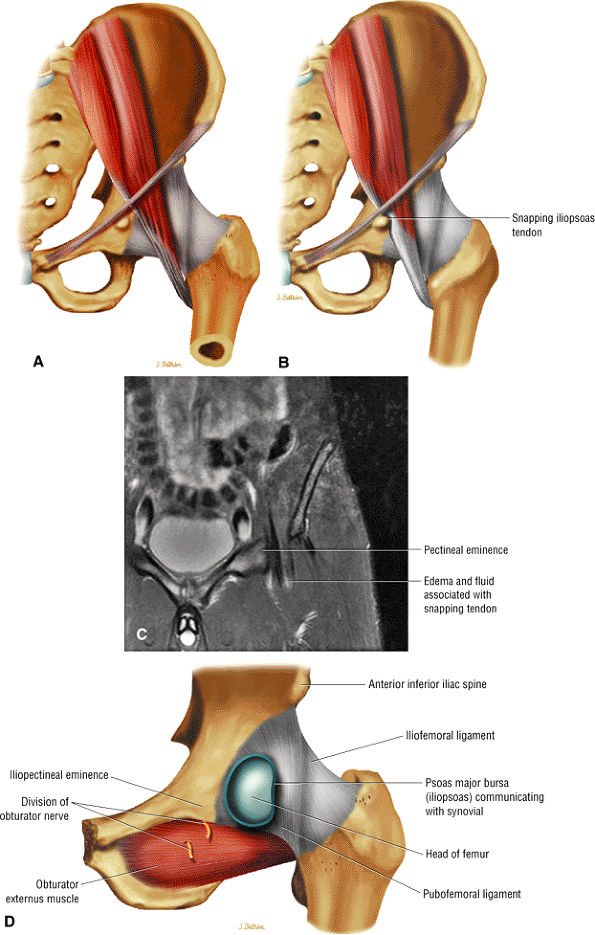 |
|
FIGURE 3.171 ● Snapping of the iliopsoas tendon over the pectineal eminence occurs with hip extension. This anterior view color illustration shows the iliopsoas tendon in (A) hip flexion and (B) hip extension with iliopsoas contact over the pectineal eminence. (C) Coronal FS PD FSE image of snapping hip with edema of the iliopsoas MTU. (D) Proximity of the iliopectineal eminence to the iliopsoas bursa.
|
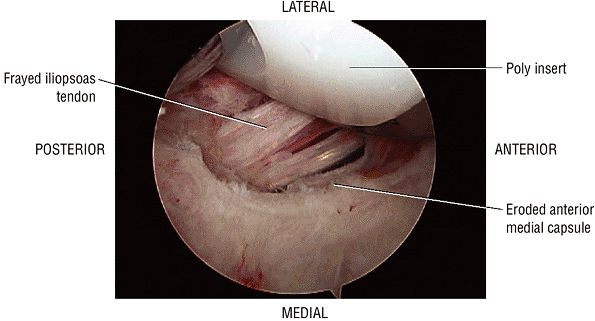 |
|
FIGURE 3.172 ● Snapping iliopsoas with eroded anterior medial capsule in the presence of a total hip prosthetic head.
|
-
In external snapping syndrome FS PD FSE images show a hypointense to hyperintense iliotibial band and anterior border gluteus maximus and a hyperintense greater trochanteric bursa.
-
In internal snapping syndrome FS PD FSE images display hyperintense iliopsoas bursa fluid (Fig. 3.173).
-
Intra-articular snapping syndrome is characterized by hypointense to intermediate-signal-intensity loose bodies adjacent to hyperintense joint fluid. MR arthrography is used to identify labral tears and other intra-articular lesions.
-
Caused by an abnormal abutment between the proximal femur and the acetabular rim
-
Cam, pincer, and mixed cam-pincer (most common) types
-
The pincer type is associated with over-coverage or retroversion of the acetabulum.
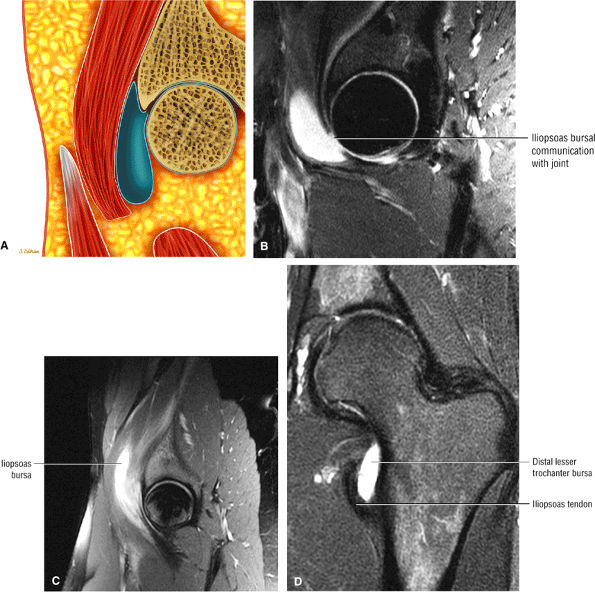 |
|
FIGURE 3.173 ● (A) Sagittal color illustration and (B) sagittal FS PD FSE image showing longitudinal extension of iliopsoas bursal fluid deep to the muscle and MTU as a cause of snapping hip syndrome. (C) Sagittal FS PD FSE image depicting dissection of the iliopsoas bursa and tendinosis of the iliopsoas tendon. (D) Coronal FS PD FSE image in a separate case of tendinosis in a runner. The distal iliopsoas tendon is associated with a distal lesser trochanteric bursa. This less commonly distended bursa should not be confused with the more proximal iliopsoas bursa.
|
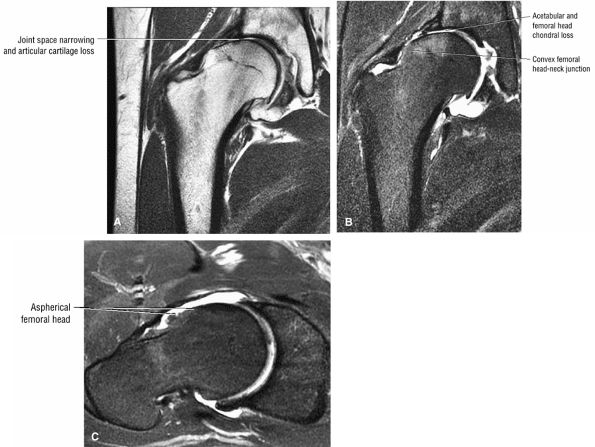 |
|
FIGURE 3.174 ● Advanced changes of FAI resulting in osteoarthritis. (A) Coronal T1-weighted image. (B) Coronal FS PD FSE image. (C) Axial FS PD FSE image.
|
FAI.176,177,180,181,185,186,187 Acetabular rim lesions on MR imaging have been shown to correlate with results of the impingement test.188 The recognition of FAI and its relation to early OA of the hip requires early diagnosis and treatment to prevent or delay degeneration of the hip.
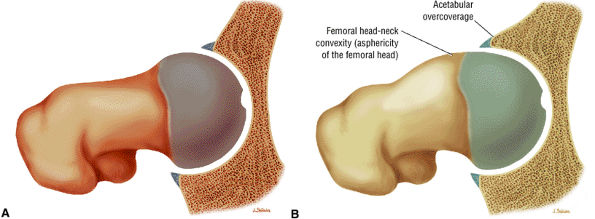 |
|
FIGURE 3.175 ● (A) Normal morphology of the femur and acetabulum with normal clearance of the hip. (B) Combination of reduced head-neck offset (cam mechanism) and excessive anterior overcoverage (pincer mechanism). Mixed cam-pincer impingement is the most common mechanism of FAI. (See text for further explanation of FAI impingement mechanisms.)
|
the labral rim, causing a cleft-type defect seen on MR examination. In addition to the labral tear, sometimes there is a subchondral bone avulsion that may be seen at the anterior superior edge on a plain x-ray.
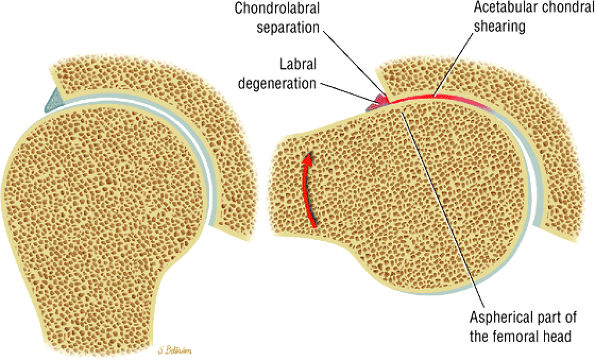 |
|
FIGURE 3.176 ● Cam impingement demonstrated from the sagittal perspective. During flexion the dysplastic convex or aspherical portion of the femoral head is jammed against the anterolateral acetabular roof. The acetabular articular cartilage is sheared off and there is chondrolabral separation. Internal rotation serves to further increase impingement.
|
the concavity of the femoral neck was defined as a point where the distance from the cortex to the center of the femoral head exceeds the radius of the cartilage-covered femoral head. Widening of the femoral neck anterior to this line reduces the concavity of the neck. The angle formed between the axis of the neck and a line connecting the center of the head and neck at its narrowest point (the alpha angle) was found to be larger in patients with FAI compared with a control group (Fig. 3.181). The alpha angle measured 74.0° ± 5.4° in patients with FAI and 42° ± 2.2° in the normal control group.180 All causes of impingement attributable to the shape of the femoral head-neck junction, such as a wide femoral neck, osteophyte formation, or posterior displacement of the femoral head, result in an increased alpha angle.180 In the study by Notzli et al.,180 all patients with a positive impingement test result demonstrated abnormalities on MR imaging, such as degeneration of the labrum or labral tears, and in 85% of the patients there was associated damage to the anterolateral acetabular cartilage.
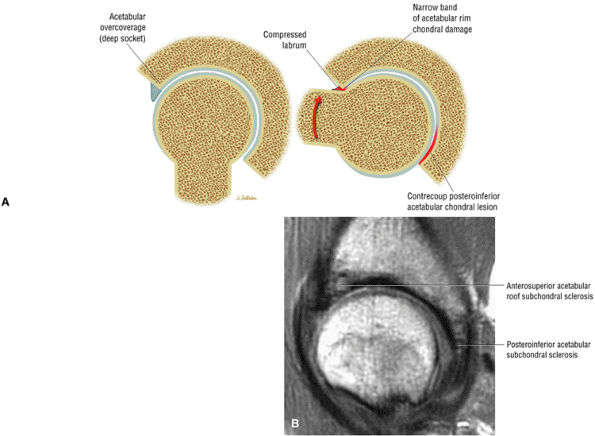 |
|
FIGURE 3.177 ● (A) Pincer impingement from the sagittal perspective. During flexion the labrum is damaged since it functions as the buffer between the femoral neck and the acetabulum, which has excessive anterior coverage. A contrecoup posteroinferior acetabular chondral lesion results as the femoral head subluxes posteriorly, creating increased pressure between the posteromedial femoral head and posteroinferior acetabulum. (B) Mixed cam-pincer impingement with anterosuperior and posteroinferior acetabular subchondral and chondral degeneration. Sagittal PD FSE image.
|
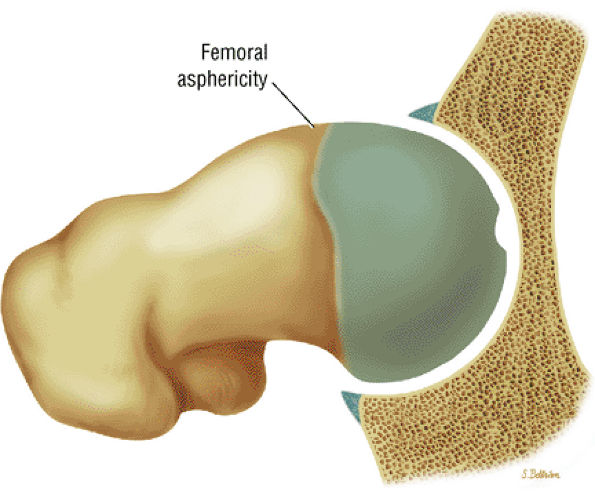 |
|
FIGURE 3.178 ● Reduced femoral head-neck offset with dysplastic convex femoral bump.
|
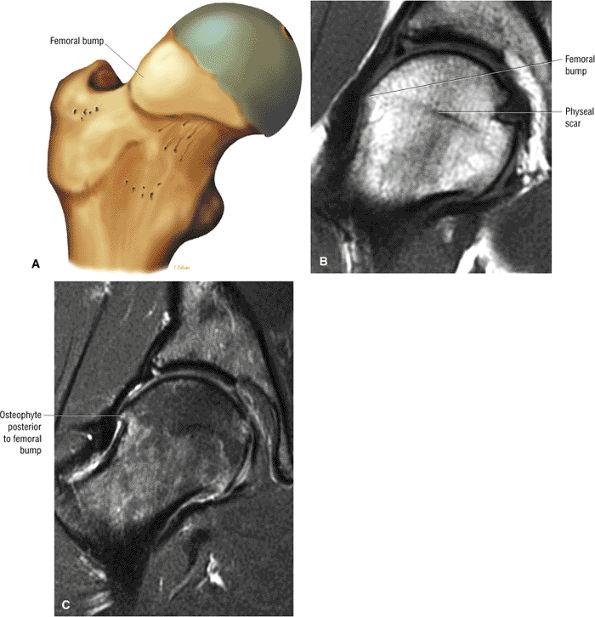 |
|
FIGURE 3.179 ● (A) Anterolateral dysplastic bump lateral to the physeal scar. This produces a nonspherical head that can damage the anterosuperior acetabular cartilage and result in separation between the labrum and adjacent cartilage. Coronal T1-weighted (B) and FS PD FSE (C) images of a femoral bump anterior to a femoral osteophyte in cam impingement. There is associated acetabular sclerosis and a labral tear.
|
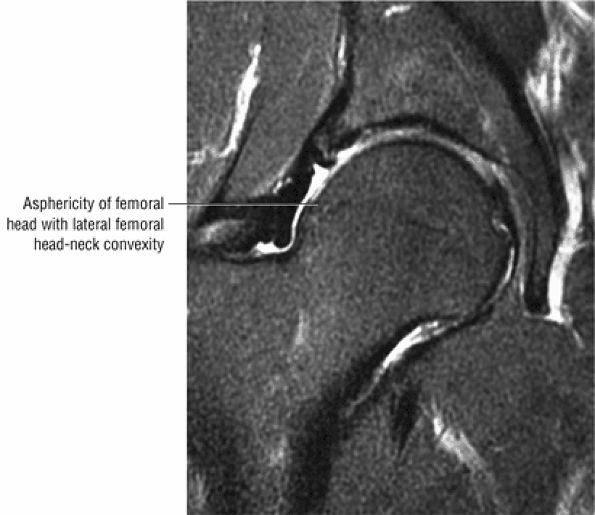 |
|
FIGURE 3.180 ● MR appearance of the pistol-grip deformity with loss of femoral head-neck concavity associated with a dysplastic anterolateral femoral bump. Coronal FS PD FSE image.
|
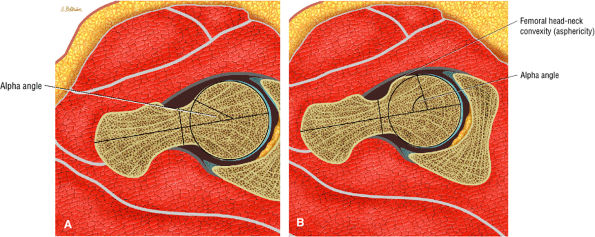 |
|
FIGURE 3.181 ● (A) Normal alpha angle used to evaluate the femoral head-neck junction in a spherical femoral head. (B) Increased alpha angle in a nonspherical femoral head with a dysplastic femoral bump.
|
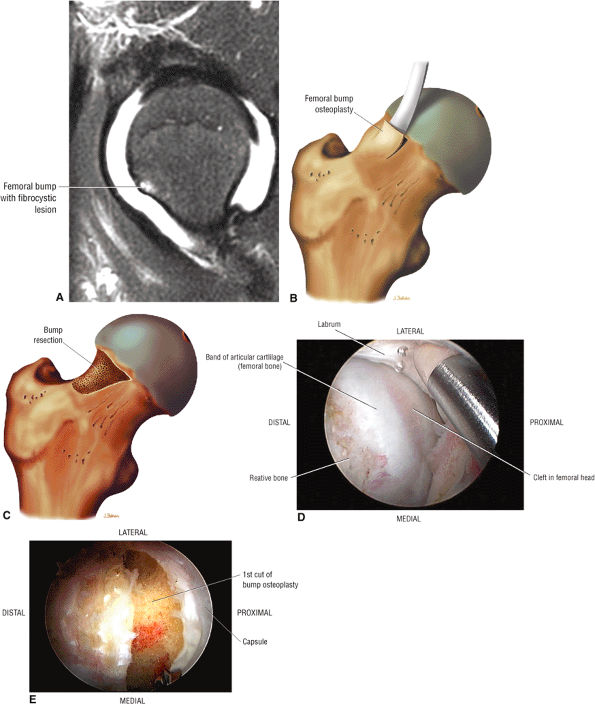 |
|
FIGURE 3.182 ● (A) FAI with a dysplastic femoral bump on an FS PD FSE arthrogram. (B, C) Color illustrations of femoral bump resection osteoplasty to restore the normal concave contour of the femoral neck. (D) Arthroscopic view of femoral head-neck bump. (E) Arthroscopic view after resection osteoplasty of the dysplastic femoral bump.
|
-
Hypointense edema and sclerosis of the lateral acetabular subchondral bone
-
Hypointense to intermediate-signal-intensity acetabular subchondral cysts
-
Abnormal (blunted) contour of the acetabular labrum
-
A femoral “dysplastic bump” lateral to physeal scar with or without loss of anterior femoral offset
-
Laterally located hyperintense subchondral marrow edema
-
Intermediate-signal labral degeneration
-
Labral tears with hyperintense linear or diffuse signal intensity
-
Absence of labral tissue
-
Inhomogeneous to hyperintense signal in acetabular subchondral cysts
-
A defect, attenuation, or fissure in the normally intermediate-signal-intensity articular cartilage
-
A femoral “dysplastic bump” with normal marrow fat signal or a hyperintense signal and small hyperintense femoral head/neck cysts
-
A hypointense thickened hip capsule (iliofemoral ligament)
-
A decreased femoral head-neck offset
-
A dysplastic femoral bump at or adjacent to the lateral physeal scar femoral head-neck junction (Fig. 3.185)
-
A bump-osteophyte complex (Fig. 3.186) where the dysplastic femoral bump is anterior to the lateral to posterolateral osteophyte as visualized on coronal MR images, and the osteophyte may demonstrate hyperintense edema on FS PD FSE sequences
-
Fibrocystic change (Fig. 3.187) (herniation pits), which commonly occurs either anterior to the dysplastic bump (bump-cyst concordance) or anterior to the dysplastic bump (bump-cyst discordance) and is the result of flexion-induced pressure and not normal invagination of synovium210
-
Femoral cysts with fluid, synovial/fibrous, or fat signal intensity (Fig. 3.188), which may be associated with reactive subchondral edema (Fig. 3.189)
-
A femoral head chondral crease (Fig. 3.190) in DDH with labral hypertrophy. The femoral head articular crease is medial to the dysplastic bump. The bump and crease are characteristically proximal to the physeal scar, in comparison to non-DDH cam impingement.
-
Chondral fissures or defects, joint space narrowing, and femoral head edema, seen in the advanced stages of FAI
-
Thickening of the iliofemoral ligament and synovitis adjacent to the capsule and proximal femur
-
Resection of a dysplastic femoral bump and fibrocystic lesion may extend proximal to the physis.(see Fig. 3.190)
-
Heterotopic bone formation along the course of the iliofemoral ligament (Fig. 3.191) as a postoperative complication
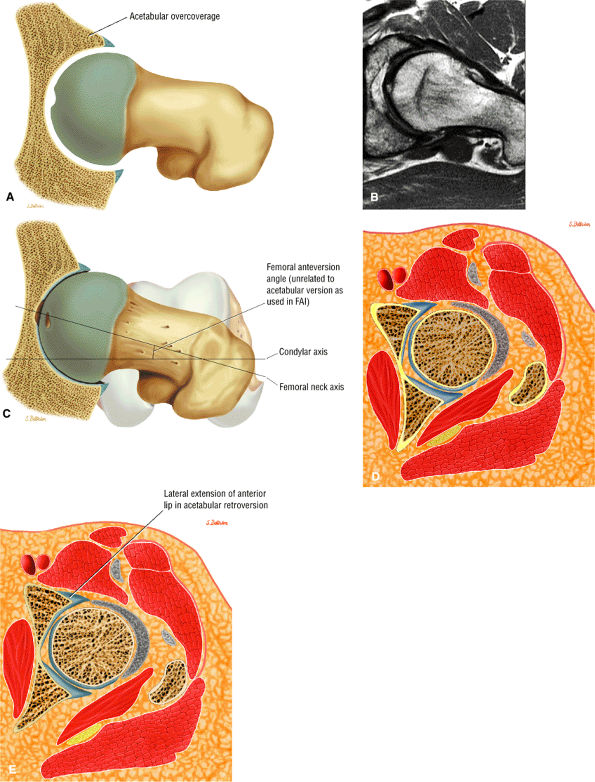 |
|
FIGURE 3.183 ● (A) Acetabular anterior overcoverage is associated with acetabular retroversion and is a main cause of pincer-type impingement. Coxa profunda is considered the prototype for a deep hip socket in pincer impingement. Acetabular protrusion or retroversion, labral ossification, and a negative acetabular index angle also contribute to pincer-type impingement. (B) Acetabular retroversion (mild) in pincer-type FAI. (C) Femoral anteversion of the femoral neck with the knee directed anteriorly. Femoral anteversion and retroversion (which are associated with toeing in or toeing out) are separate from and should not be confused with acetabular anteversion and retroversion. (D) Cross-section showing normal acetabular anteversion. (E) Retroversion of the normal acetabulum effectively results in anterior overcoverage as the anterior lip extends more laterally compared with normal.
|
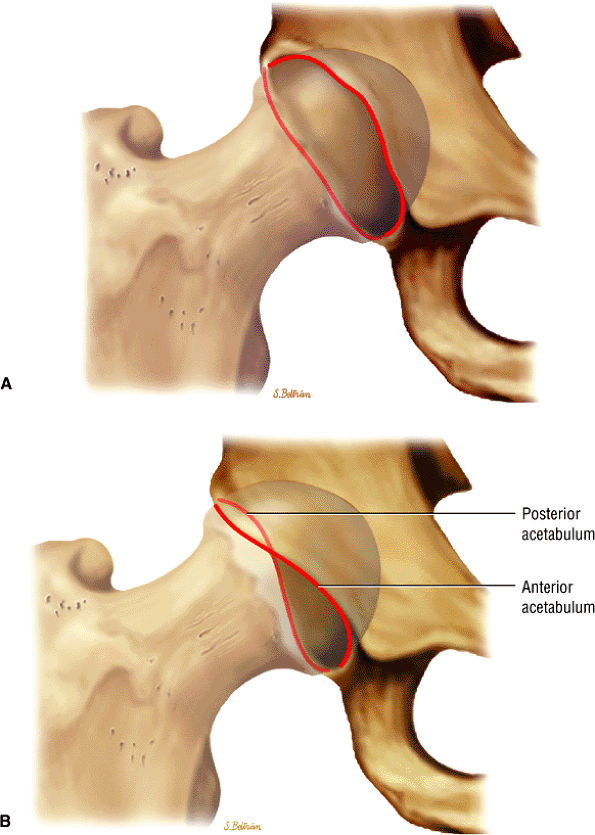 |
|
FIGURE 3.184 ● Crossover sign in acetabular retroversion. (A) The normal acetabulum. (B) The crossover sign in which the anterior rim crosses over the posterior acetabular rim (transparent red line).
|
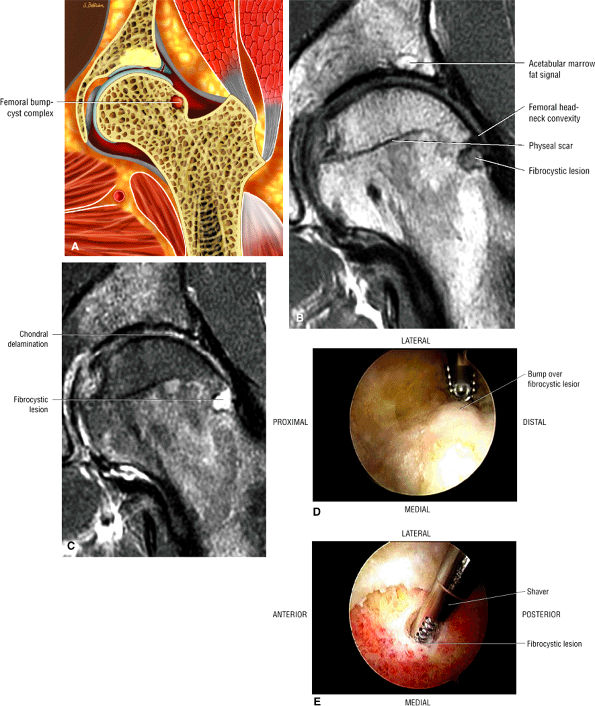 |
|
FIGURE 3.185 ● Cam impingement with dysplastic (aspherical) femoral head-neck junction and fibrocystic change located lateral to the physeal scar. (A) Coronal color illustration of femoral bump-cyst complex. (B) Coronal T1-weighted image with femoral head-neck convexity and fibrocystic change. Note marrow fat reparative signal intensity in acetabular rim. (C) Corresponding coronal FS PD FSE image demonstrating a full-thickness sheared defect in the acetabular cartilage and hyperintense fibrocystic changes in the lateral femoral head-neck junction. (D) Arthroscopic view of a femoral dysplastic bump overlying the subchondral fibrocystic change. (E) Arthroscopic shaver removing the contents of the femoral fibrocystic lesion after resection of the overlying bump.
|
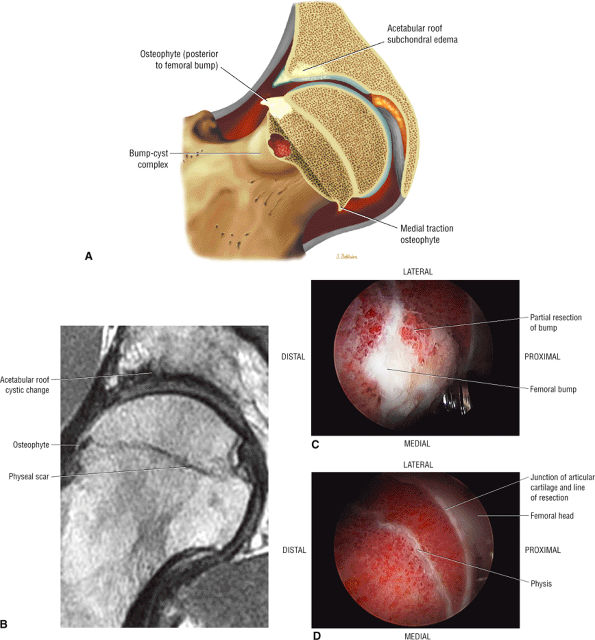 |
|
FIGURE 3.186 ● Femoral head-neck osteophyte located posterior to the femoral bump. The femoral bump and lateral osteophyte are referred to as the bump-osteophyte complex. (A) Coronal color illustration. (B) Coronal T1-weighted image. (C, D) Arthroscopic views of the femoral bump resected at the level of the physeal scar. Normal articular cartilage is preserved medial to the bump.
|
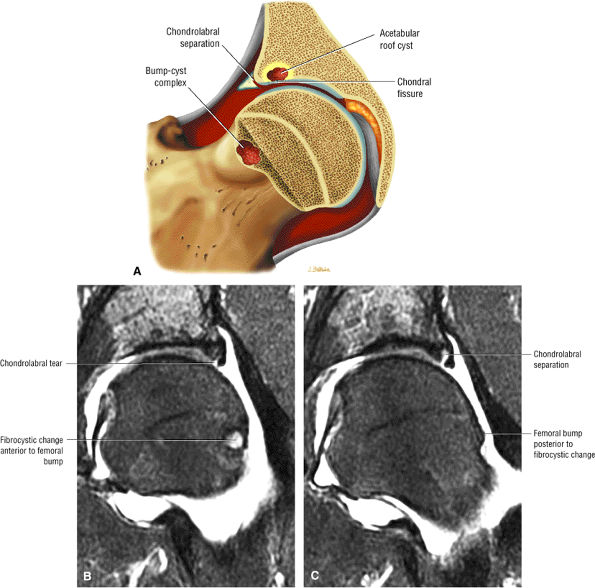 |
|
FIGURE 3.187 ● (A) Concordance of the femoral fibrocystic lesion and the femoral bump. (B, C) Coronal FS PD FSE images showing discordance with a femoral fibrocystic lesion anterior to femoral bump. Note the chondrolabral separation characteristic of cam impingement.
|
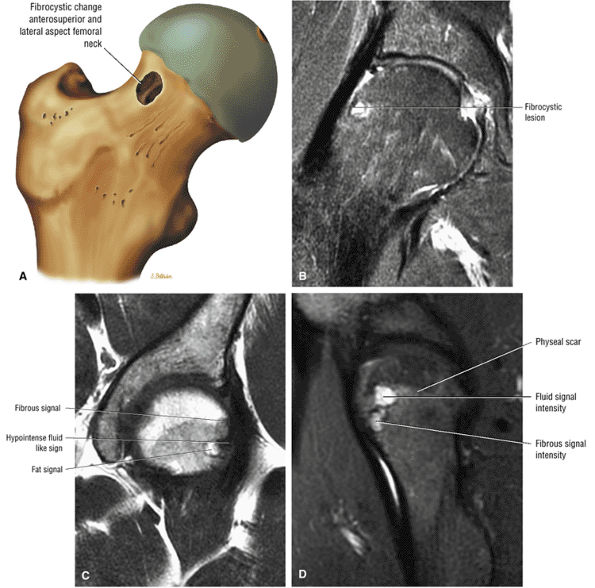 |
|
FIGURE 3.188 ● (A) Femoral cyst after bump osteoplasty. (B) Fibrous or synovial signal in a cyst lateral to the physeal scar, hyperintense on coronal FS PD FSE image. (C) Fat, fibrous, and fluid signal intensities are demonstrated on a coronal T1-weighted image. (D) Corresponding sagittal FS PD FSE image showing fibrous and fluid signal in a typical band-like distribution of anterolateral femoral cysts.
|
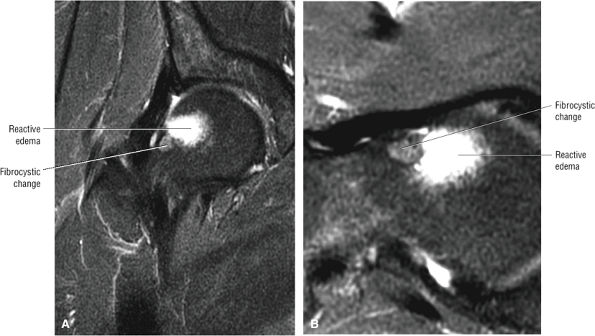 |
|
FIGURE 3.189 ● Hyperintense edema associated with a femoral fibrocystic lesion in a symptomatic golfer with FAI. Hyperintense edema in both the femur and acetabulum correlates with increased clinical symptoms of hip or groin pain. Acetabular chondral erosions have a high association with hip pain. (A) Coronal FS PD FSE image. (B) Axial FS PD FSE image.
|
-
Acetabular retroversion
-
Acetabular rim osteophytes contributing to pincer or mixed cam-pincer impingement (Fig. 3.192)
-
Os acetabuli, usually in combination with a femoral dysplastic bump (Fig. 3.193)
-
Subchondral sclerosis (Fig. 3.194), edema (Fig. 3.195), or cysts (Fig. 3.196) of the lateral acetabular rim
-
Acetabular subchondral changes, which occur anterolaterally and progress posteriorly. Posterior acetabular changes are associated with the pincer mechanism (see Fig. 3.196).
-
Acetabular cysts of fluid, fibrous/synovial, or fat signal intensity (Fig. 3.197)
-
Chondral fissures or defects in the superior or superolateral acetabulum. Chondral lesions show a progression (Fig. 3.198) from blister (see Fig. 3.198) to delamination (see Fig. 3.198) to peel-off (Fig. 3.199).
-
Postoperative acetabular lesions (Fig. 3.200) with fluid-filled defect
-
Regrowth of articular cartilage (occurring within 1 year)
-
Labral tears (Fig. 3.201) and paralabral cysts
-
Calcified/ossified labrum (Fig. 3.202) and os acetabuli associated with pincer impingement
-
Joint space narrowing with progression to OA (Fig. 3.203)
and sagittal images and is associated with chondral involvement. Chondral lesions are frequently associated with joint space narrowing and represent a later stage of FAI, usually less responsive to impingement surgery.187,211
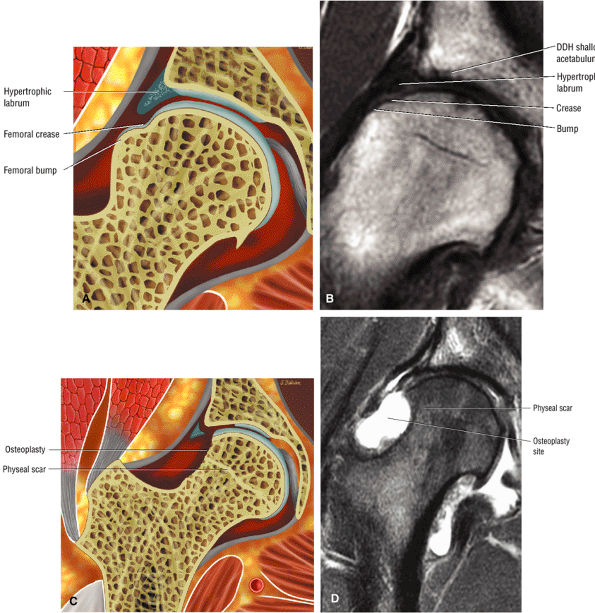 |
|
FIGURE 3.190 ● (A) Coronal color section depicting DDH with hypertrophic labrum and femoral head crease between the bump and medial femoral head. (B) Coronal T1-weighted image of DDH with femoral bump proximal to the physis. The femoral crease is medial to the femoral bump. (C) Coronal color section showing resection of the bump extending proximal to the physis. (D) Coronal FS PD FSE image depicting hyperintense fluid in a femoral bump osteoplasty proximal and distal to the physis.
|
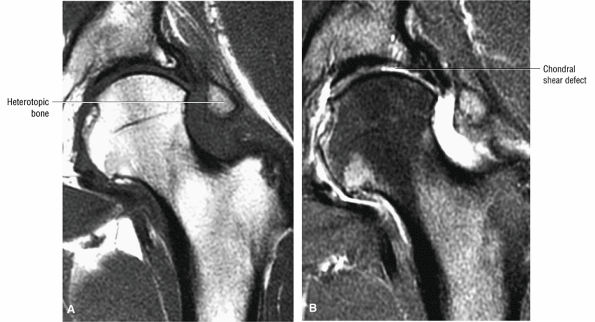 |
|
FIGURE 3.191 ● Coronal T1-weighted (A) and FS PD FSE (B) images showing heterotopic bone forming along the lateral capsule after osteoplasty for FAI. A full-thickness acetabular chondral defect is shown.
|
may stabilize symptoms with synovialization of subchondral cysts, full-thickness chondral lesions of the acetabulum accelerate progression of joint space narrowing. Conservative treatment includes short-term non-weight-bearing, anti-inflammatory medications, muscle strengthening to relieve hip joint stress, and emphasis on nonloading activities such as bicycle riding or elliptical exercisers to exercise the hip joint and stimulate articular cartilage healing. Surgical options include arthroscopic débridement of labral tears, femoroacetabular débridement and femoral reshaping (resection of the dysplastic “bump”), and periacetabular osteotomy. As mentioned, advanced cases may require total hip replacement.
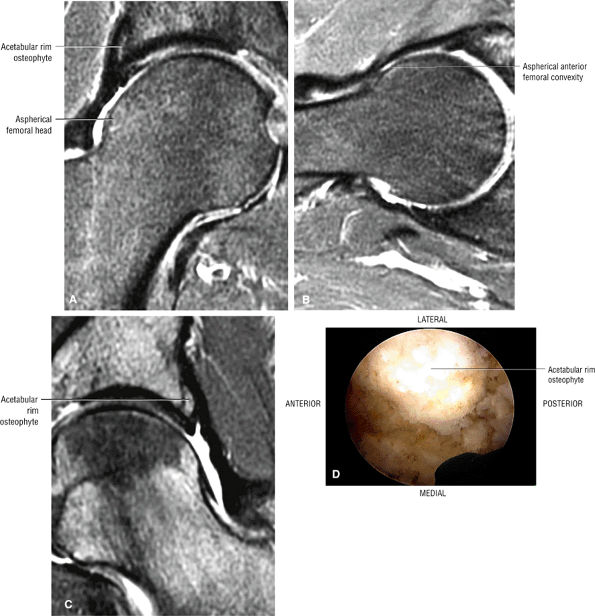 |
|
FIGURE 3.192 ● Coronal (A) and axial (B) FS PD FSE images showing mixed cam-pincer impingement with an acetabular rim osteophyte and a convex aspherical femoral head-neck bump. Coronal FS PD FSE image (C) and arthroscopic view (D) of a prominent acetabular rim osteophyte in a separate case.
|
joint disease, and findings indicate that surgical dislocation with correction of FAI yields good results in patients with early degenerative changes. The procedure was not beneficial to those with advanced degenerative changes or extensive articular cartilage damage.175
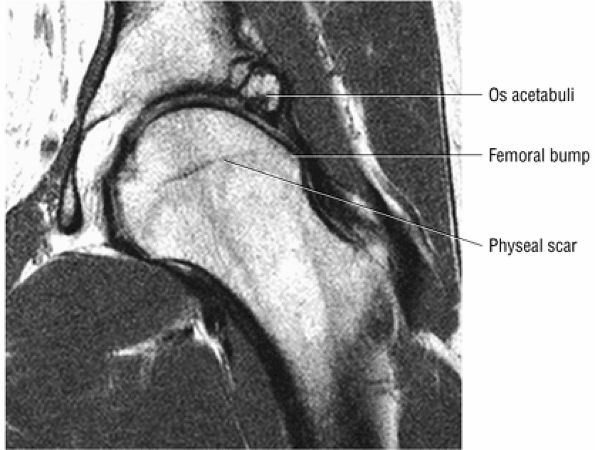 |
|
FIGURE 3.193 ● Os acetabuli contributing to the pincer component of mixed cam-pincer impingement. The femoral bump is demonstrated lateral to the physeal scar.
|
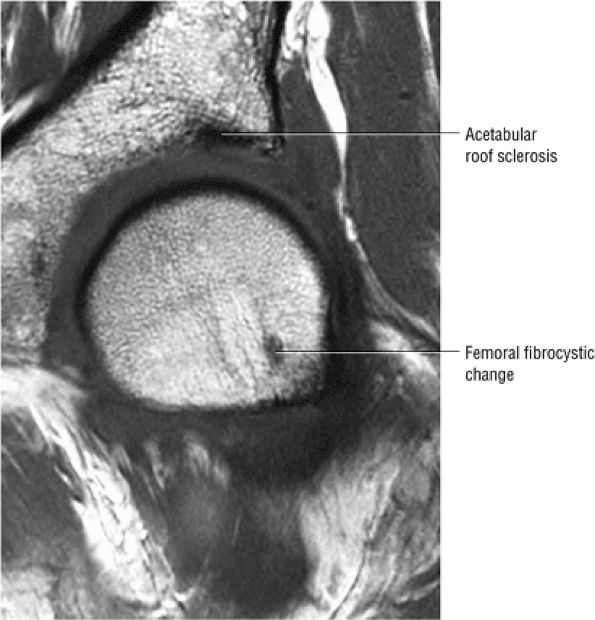 |
|
FIGURE 3.194 ● Hypointense acetabular rim sclerosis and anterolateral femoral fibrocystic lesion in FAI. Coronal T1-weighted image.
|
-
Labral tears are part of the FAI syndrome.
-
Identification of labral tear morphology including chondrolabral separation and cleavage tears.
-
Adjacent paralabral cysts communicate with ares of lateral degradation and tears.
tears are more common in individuals who participate in sports that increase the risk of FAI. Patients with prior hip dislocations and those with DDH are also at increased risk. Labral abnormalities (including labral degeneration) have been found in 28% of asymptomatic individuals, and labral tears have been found in 20% of symptomatic patients with DDH.
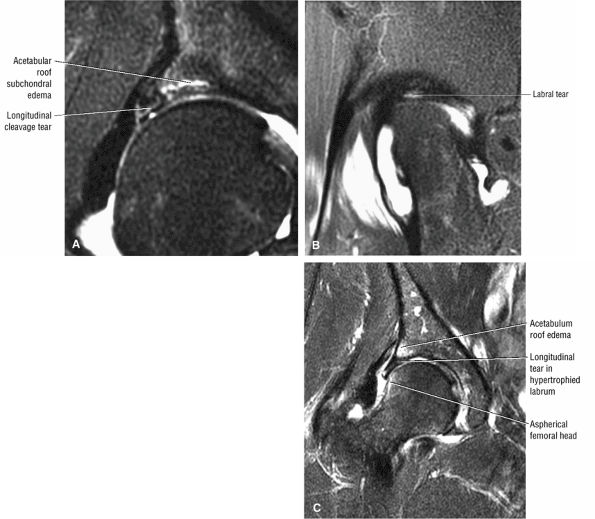 |
|
FIGURE 3.195 ● Coronal (A) and sagittal (B) FS PD FSE images showing subchondral acetabular roof edema associated with a longitudinal labral tear. (C) Coronal FS PD FSE image in a separate case showing acetabular roof edema associated with a hypertrophied labrum without associated findings of DDH. Enlargement (hypertrophy) of the labrum is more frequent, however, in DDH.
|
demarcation or groove of acetabular articular cartilage separates the labrum and transverse ligament. The capsule of the hip attaches to the osseous acetabulum laterally, creating the perilabral sulcus, a normal finding between the capsule and labrum on coronal images peripheral to the lateral rim of the acetabulum (Fig. 3.208).
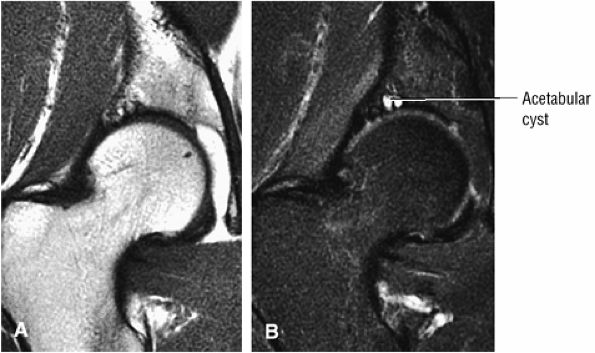 |
|
FIGURE 3.196 ● Coronal images showing acetabular cysts in FAI. Cysts are hypointense on T1-weighted images (A) and hyperintense on FS PD FSE images (B). Posterior acetabular roof progression of the cysts is demonstrated on these posterior coronal images.
|
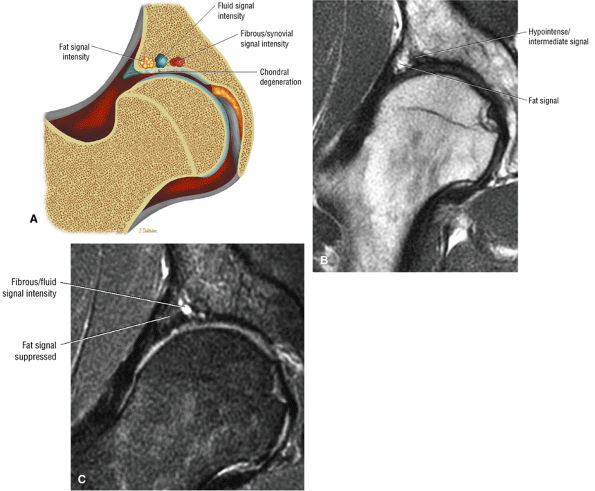 |
|
FIGURE 3.197 ● (A) Coronal section depicting types of acetabular roof cysts seen in FAI. Fat signal intensity represents a quiescent stage indicative of reparative maturation of the cyst. Fluid or fibrous/synovial signal intensity is associated with ongoing symptoms of hip pain. (B) Coronal T1-weighted image showing fat signal intensity lateral to hypointense/intermediate-signal-intensity acetabular roof changes. (C) Corresponding coronal FS PD FSE image with fat suppression in the lateral rim of the acetabulum and fluid/fibrous signal more medially.
|
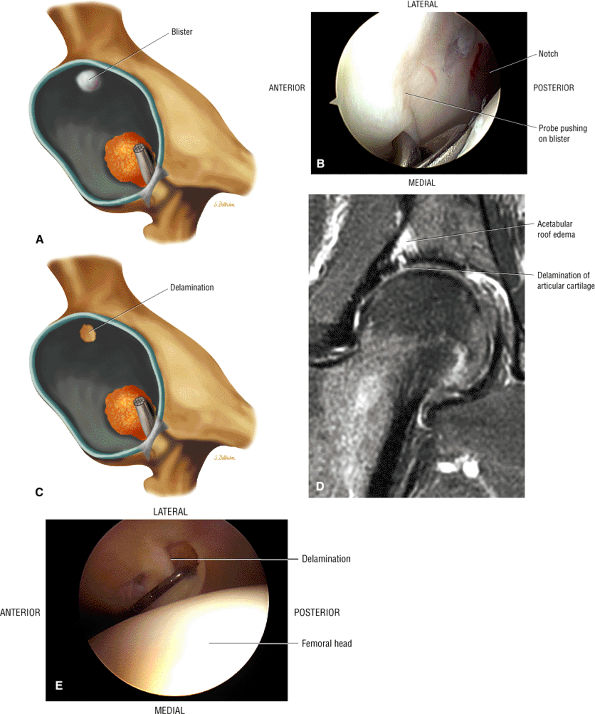 |
|
FIGURE 3.198 ● Progression from blister to delamination of acetabular articular cartilage. (A) Lateral illustration of acetabular roof blister lesion. (B) Arthroscopic view of a chondral blister. (C) Lateral illustration of superior acetabular delamination lesion. (D) Corresponding coronal FS PD FSE image showing chondral erosion with delamination of articular cartilage. (E) Arthroscopic probing of a delamination lesion.
|
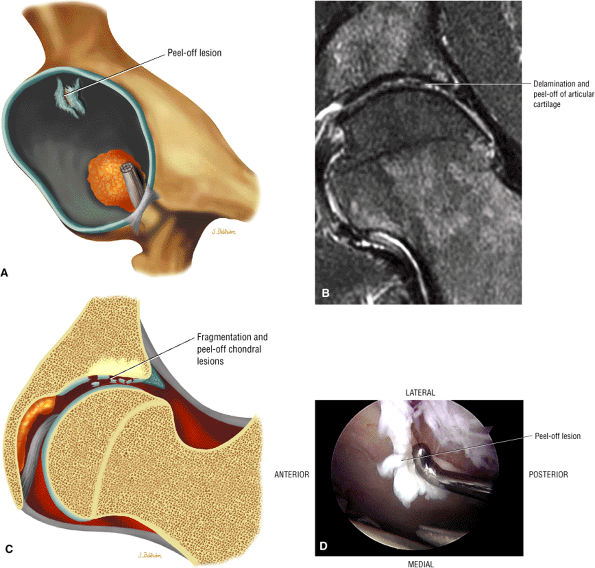 |
|
FIGURE 3.199 ● (A) Lateral view illustration of a peel-off chondral lesion. (B –D) Multiple fissures with resultant fragmentation of the acetabular chondral roof producing an unstable chondral surface and peel-off lesion of the articular surface. At arthroscopy, loose bodies may be observed as leg traction is applied and the peel-off lesion is probed. (B) Coronal FS PD FSE image. (C) Coronal color illustration showing fragmentation of acetabular roof articular cartilage (appreciated on arthroscopy). (D) Arthroscopic view of a peel-off lesion probed.
|
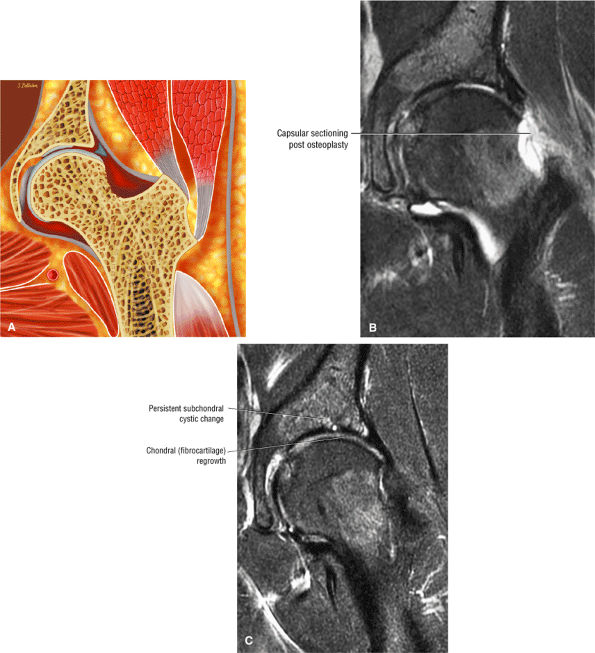 |
|
FIGURE 3.200 ● (A) Postresection osteoplasty of the acetabular bump. (B) Arthroscopic surgical division of the lateral hip capsule and bump-cyst resection 2 weeks after resection osteoplasty. Coronal FS PD FSE image. (C) Regrowth of acetabular chondral surface and reconstitution of iliofemoral ligament reimaged after 2 years. Coronal FS PD FSE image.
|
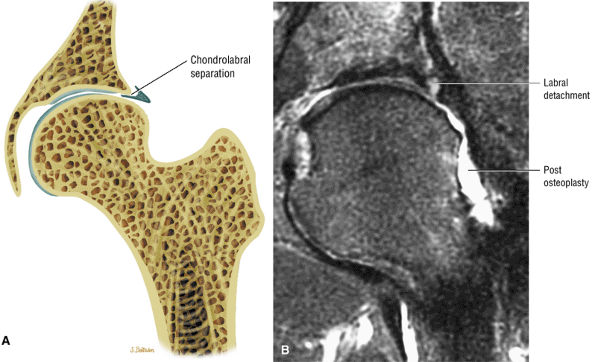 |
|
FIGURE 3.201 ● (A) Coronal color section of persistent chondrolabral tear with lateral labral avulsion. (B) Coronal FS PD FSE image with symptomatic labral detachment after osteoplasty for cam impingement.
|
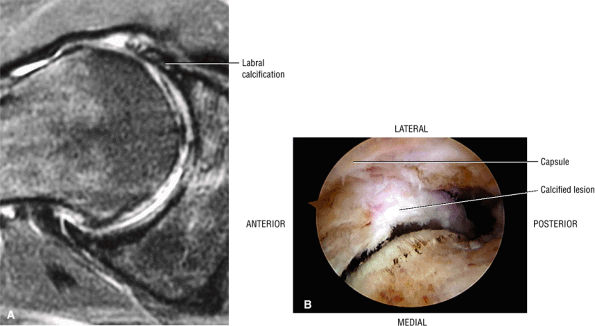 |
|
FIGURE 3.202 ● (A) Axial FS PD FSE image of calcified anterior and lateral labrum. (B) Arthroscopic view with calcified labrum along the acetabular rim.
|
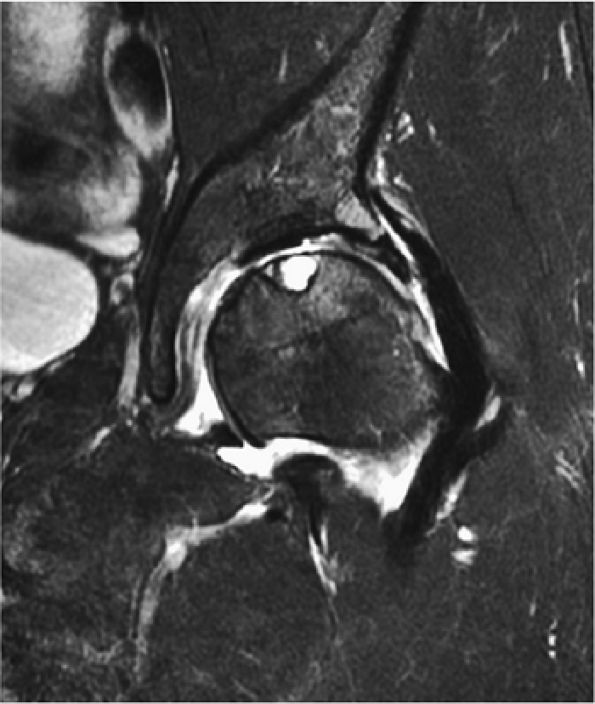 |
|
FIGURE 3.203 ● MR findings in advanced FAI including joint space narrowing and subchondral erosions involving both the femoral head and acetabulum. Coronal FS PD FSE image.
|
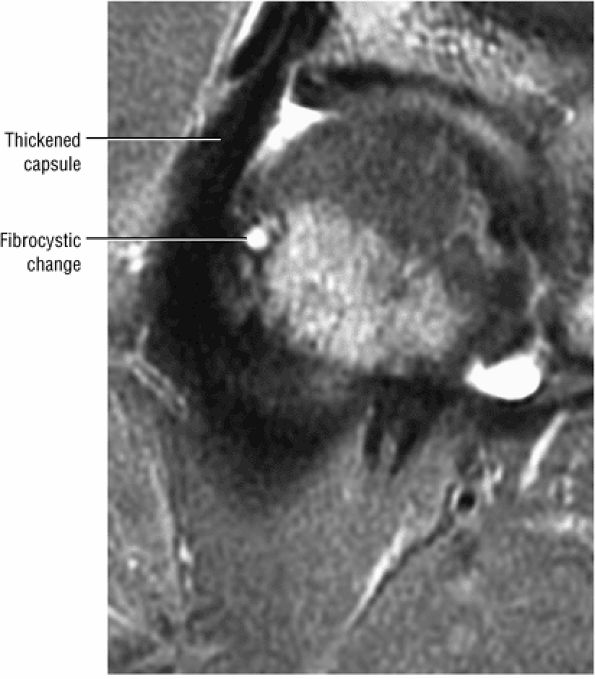 |
|
FIGURE 3.204 ● Thickened joint capsule in association with FAI. Synovitis and thickening of the iliofemoral ligaments are frequently seen in the spectrum of the inflammatory response to FAI changes. Coronal FS PD FSE image.
|
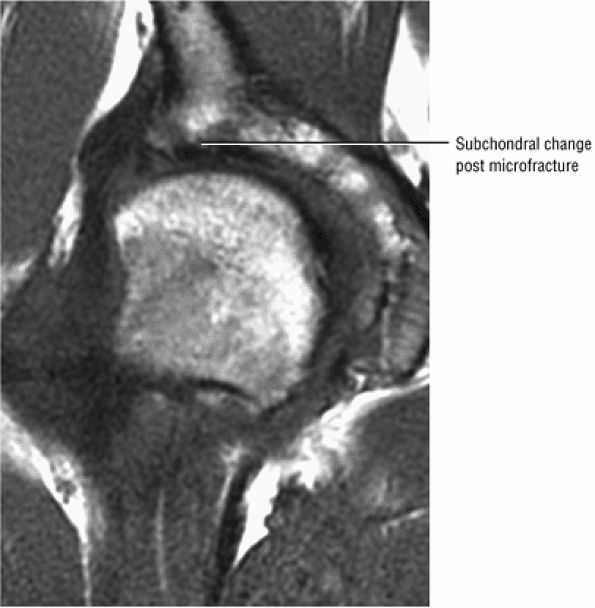 |
|
FIGURE 3.205 ● Post-microfracture of the acetabular roof used to stimulate fibrocartilage growth. Coronal T1-weighted image.
|
dysplasia, FAI (Fig. 3.211), LCP, SCFE, and degenerative hip disease (Fig. 3.212). Traumatic tears may occur along the inner free margin (a radial flap, the most common type) (Fig. 3.213), or they may be unstable and displaced (longitudinal tears) (Fig. 3.214).
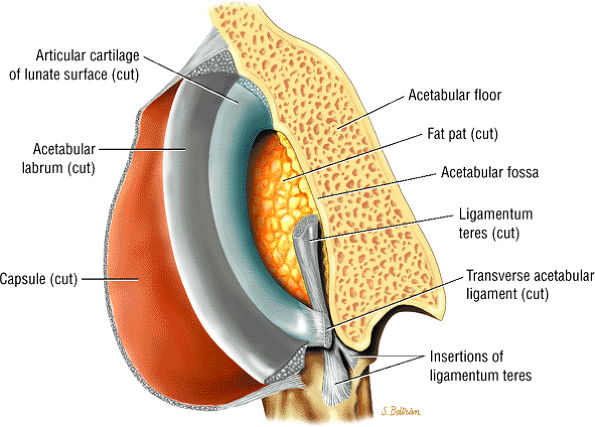 |
|
FIGURE 3.206 ● Anterior view with both coronal and sagittal perspective of the capsule, labrum, and articular cartilage. The acetabular fossa and fat pad are shown. The transverse acetabular ligament that spans the acetabular notch is cut.
|
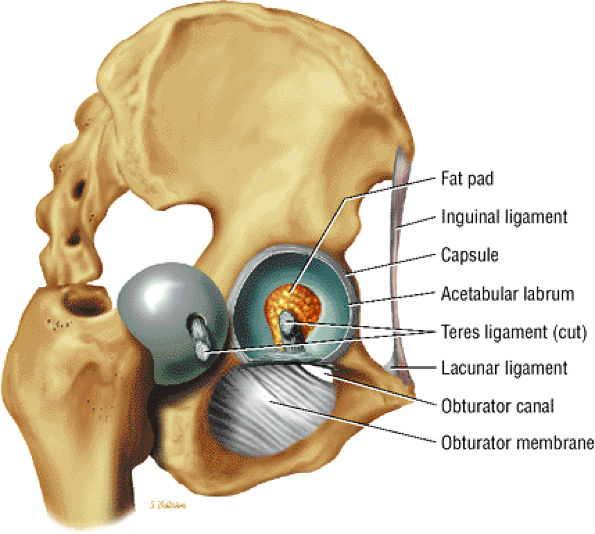 |
|
FIGURE 3.207 ● Acetabulum with crescent-shaped (lunate) surface covered with articular cartilage.
|
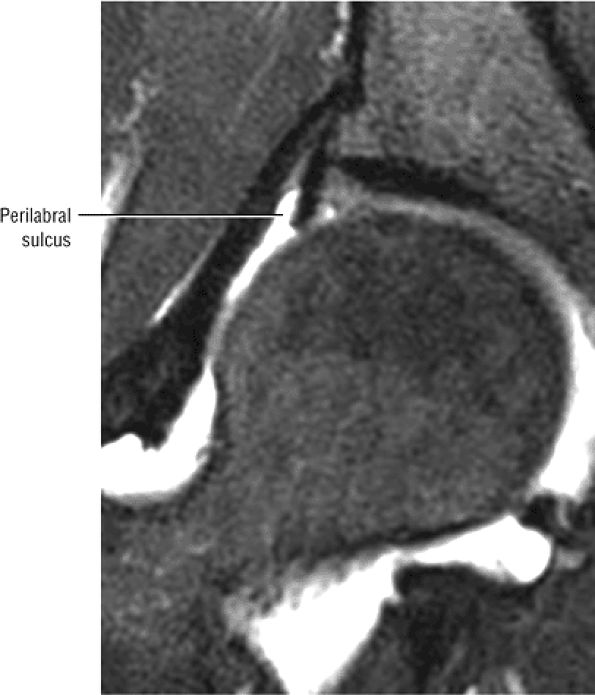 |
|
FIGURE 3.208 ● Perilabral sulcus between the capsule and lateral surface at the labrum. Coronal FS PD FSE image.
|
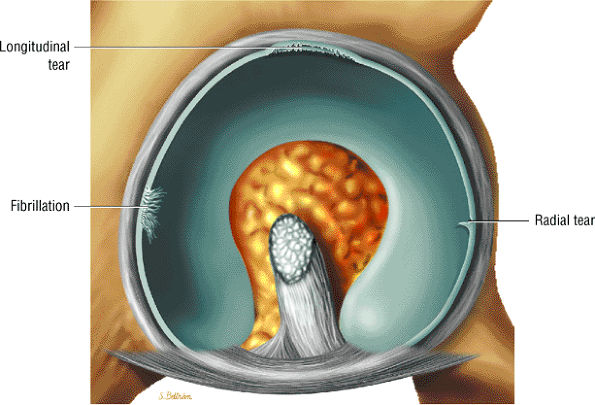 |
|
FIGURE 3.209 ● Spectrum of labral lesions with fibrillation and radial and longitudinal morphology.
|
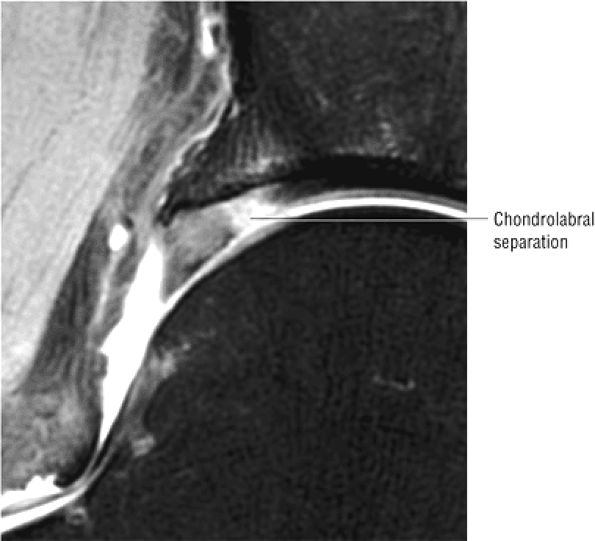 |
|
FIGURE 3.210 ● Hyperintense signal at area of chondrolabral separation. Coronal FS PD FSE image.
|
-
Stage IA: There is hyperintense signal with no communication to the articular surface, and the perilabral sulcus can be visualized.
-
Stage IB: Similar to stage IA, but there is no perilabral sulcus
-
Stage IIA: There is contrast extension into the articular surface, and the perilabral sulcus can be visualized.
-
Stage IIB: Similar to stage IIA, but there is no perilabral sulcus
-
Stage IIIA: There is labral detachment, but the normal triangular shape is maintained and the perilabral sulcus can be visualized.
-
Stage IIIB: There is labral detachment. The labrum appears thickened and is hyperintense, and the perilabral sulcus cannot be seen.
-
A primary labral tear
-
Primary capsular laxity with minor labral pathology
-
Capsular laxity with pronounced labral involvement
-
FAI with an associated labral tear
-
Articular cartilage degeneration with an associated labral tear
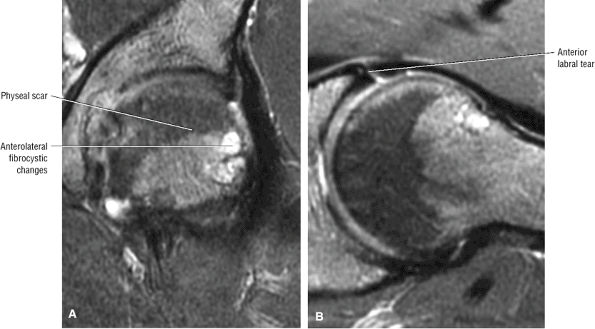 |
|
FIGURE 3.211 ● FAI with femoral fibrocystic change lateral to the physeal scar and a torn anterior labrum. (A) Coronal FS PD FSE image. (B) Axial FS PD image.
|
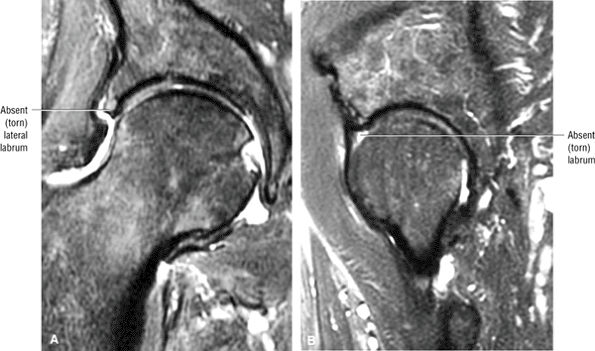 |
|
FIGURE 3.212 ● Degenerative hip in an 85-year-old with complete absence of the lateral and anterior labrum. (A) Coronal FS PD FSE image. (B) Sagittal FS PD FSE image.
|
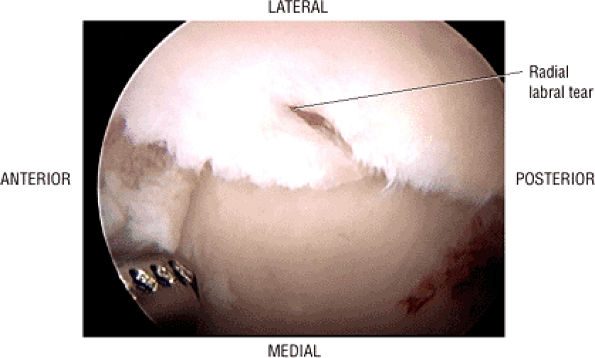 |
|
FIGURE 3.213 ● Arthroscopic view of an acetabular labral radial tear.
|
-
Intermediate linear or diffuse abnormal signal
-
Intralabral degeneration
-
Separation of the labrum at its base
-
A diastasis between the acetabular articular cartilage and the labral attachment
-
Linear hyperintensity within the hypointense labrum (seen on FS PD FSE or STIR images)
-
A hyperintense paralabral cyst with septations or lobulations (on FS PD, T2 FSE, or STIR images)
-
Surface irregularities associated with the base of the degenerated labrum
-
FAI (which is associated with labral tears, acetabular chondral erosions, and subchondral acetabular hyperintensity)
-
A hyperintense macerated to absent labrum in OA
-
Labral displacement or bucket-handle tears
-
Loss of triangular morphology
-
A hyperintense joint effusion
its entire anterior-to-posterior extent on a single sagittal image (Fig. 3.223). A bucket-handle tear (Fig. 3.224), which may be seen more commonly in a hypertrophied labrum in mild DDH, is characterized by fluid cleavage separating the longitudinal tear into two separate fragments. A degenerative labrum may be associated with abnormal morphology or absence of the fibrocartilage (see Fig. 3.212). Increased signal intensity can also be seen through the labral base on gradient-echo sequences, including spoiled gradient recalled acquisition in steady state (SPGR), and is attributed to cartilage degeneration, transitional zone fissures (between the labrum and subchondral bone), and partial labral detachment. Labral surface irregularities (hyperintensity) may be associated with labral base degeneration. The limitations of MR imaging in the diagnosis of intrasubstance degeneration may be related to the presence of fibrovascular bundles or an irregular labral insertion producing signal intensity changes without corresponding degeneration.
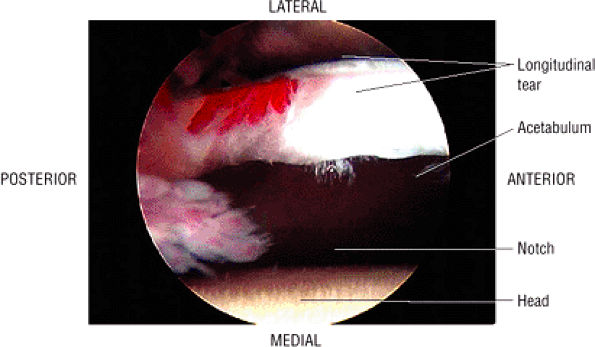 |
|
FIGURE 3.214 ● Arthroscopic view of a longitudinal labral tear.
|
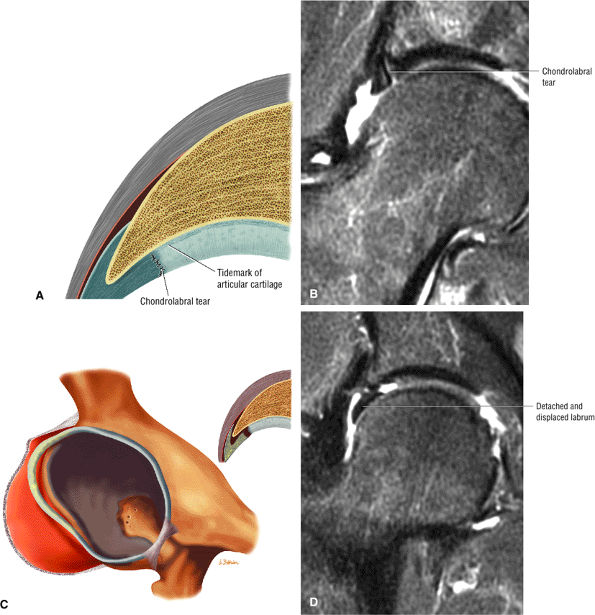 |
|
FIGURE 3.215 ● (A) Chondrolabral tear perpendicular to the long axis of the labrum. Coronal color section. (B) Fluid signal intensity at chondrolabral tear site. Coronal FS PD FSE image. (C) Progression of chondral labral tear to separation. Coronal color section. (D) Complete detachment of labrum from lateral acetabulum trapped between the acetabulum and femoral head. Coronal FS PD FSE image.
|
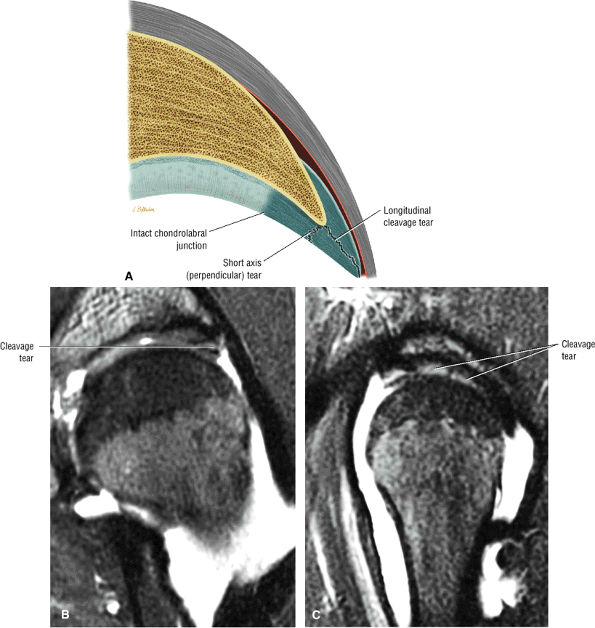 |
|
FIGURE 3.216 ● (A) A cleavage tear parallel to the long axis of the labrum and a labral tear perpendicular to the labrum and lateral to the chondrolabral junction. Coronal color section. (B) Cleavage tear of the anterolateral acetabular labrum. Coronal FS PD FSE image. (C) Corresponding labral peripheral cleavage tear on sagittal FS PD FSE image.
|
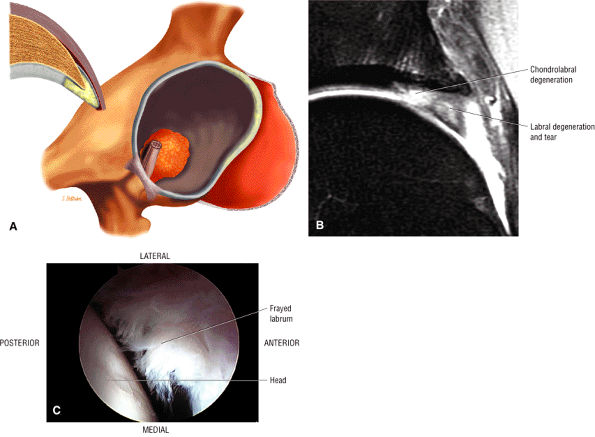 |
|
FIGURE 3.217 ● Degeneration of the acetabular labrum. (A) 3D color illustration with coronal inset. (B) Coronal FS PD FSE image with hyperintense labral degeneration associated with labral tearing and adjacent chondrolabral injury. (C) Arthroscopic view of a frayed anterior labral tear.
|
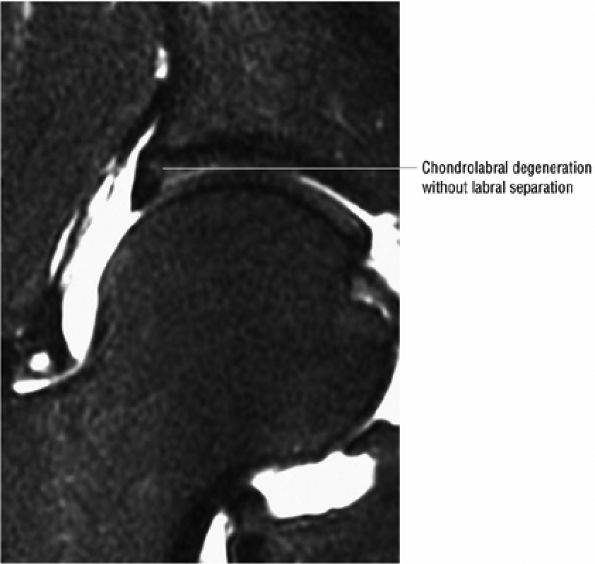 |
|
FIGURE 3.218 ● Mild hyperintense chondral degeneration adjacent to and at the base of the labrum without chondrolabral separation. Coronal FS PD FSE image.
|
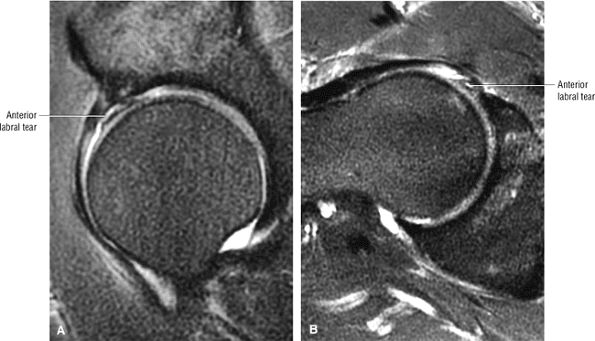 |
|
FIGURE 3.219 ● Correlation of a far anterior labral tear location on sagittal (A) and axial (B) FS PD FSE images.
|
-
Paralabral cysts may occur adjacent to any portion of the fibrocartilaginous labrum.
They may also occur secondary to the transformation of an intraosseous ganglion cyst to a soft tissue ganglion. Other etiologic factors include increased intra-articular pressure forcing synovial fluid through a labral tear and trauma. Subchondral acetabular cystic changes (Fig. 3.226) may be found, as well as chondral erosions. As with labral tears, they are commonly seen in individuals participating in sports requiring hip rotation and flexion, such as golf, hockey, soccer, gymnastics, and ballet. In middle-aged adults they are more frequently seen secondary to degenerative labral tears in FAI. They are seen more often in males, as a function of the sports-related risk of FAI.
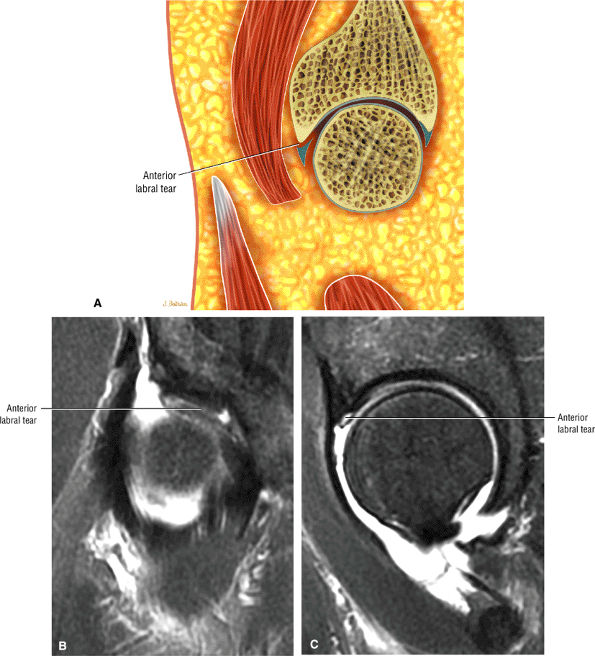 |
|
FIGURE 3.220 ● Correlation of an anterior labral tear on coronal and sagittal images. (A) Lateral color illustration. (B) Coronal FS PD FSE image. (C) Sagittal FS PD FSE image.
|
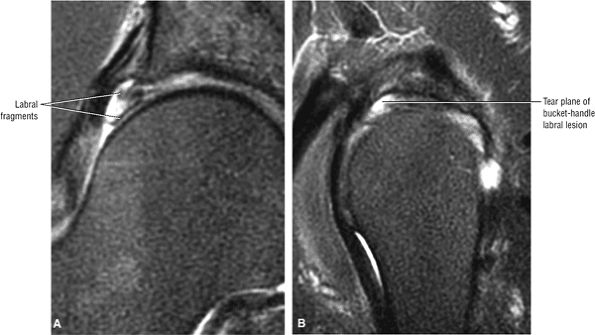 |
|
FIGURE 3.221 ● Correlation of a longitudinal (bucket-handle type) tear of the lateral acetabular labrum on coronal (A) and sagittal (B) FS PD FSE images.
|
-
Hypointense to intermediate signal intensity
-
Well-defined margins without reactive soft tissue edema
-
Increased signal intensity in cysts with mucin contents
-
Sometimes, associated hyperintense intraosseous ganglion cysts of the acetabular roof or lateral rim
-
Associated intermediate signal in labral tear or separation of the labrum at its base
-
A hyperintense juxta-articular mass
-
Longitudinal extension, usually superior to inferior (Fig. 3.228) and anterior to posterior along the labral margin (Fig. 3.229)
-
Hypointense septations (Fig. 3.230)
-
Intermediate-signal synovial thickening
-
A linear hyperintense tear or detachment of adjacent labrum
-
FAI
-
Hyperintense edema progressing to cyst formation in the acetabular roof
-
Acetabular roof chondral erosions
-
A dysplastic lateral femoral osseous bump lateral to the physeal scar
-
Hyperintense intraosseous ganglion and labral tear
-
Associated acetabular dysplasia with a shallow acetabulum on anterior coronal images
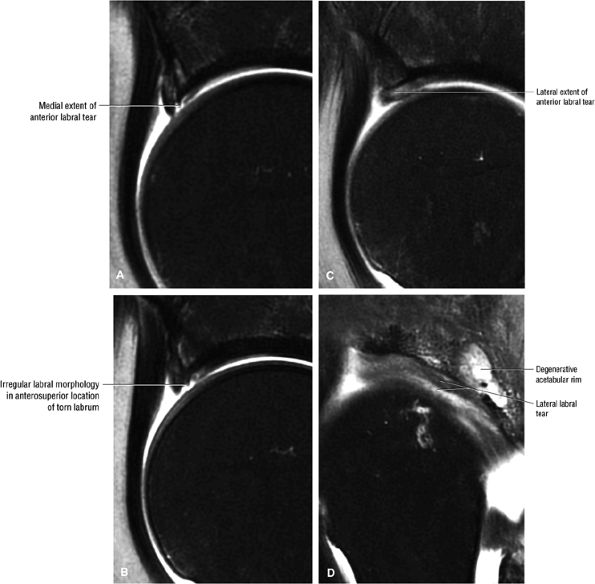 |
|
FIGURE 3.222 ● Technique of evaluating the anterior labrum in the medial (A), superior (B), and lateral (C) locations. Tears are evaluated in the sagittal plane and cross-referenced with coronal images of the femoral head. Associated extension of the tear is shown in the lateral labrum on a sagittal image (D). (A) Sagittal FS PD FSE image medial to the center plane of the femoral head prescribed from a coronal image. (B) Sagittal FS PD FSE image directly superior to the femoral head. (C) Sagittal FS PD FSE image lateral to the midline of the femoral head. (D) Peripheral sagittal FS PD FSE image demonstrating lateral continuation of the anterior acetabular labral tear.
|
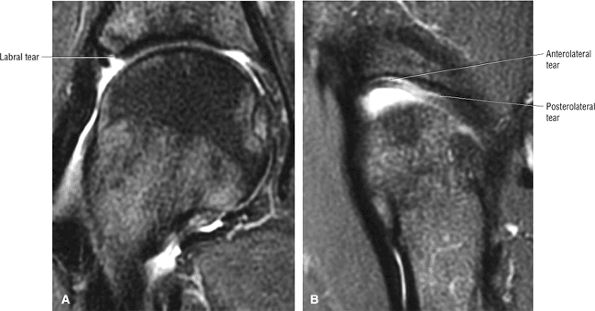 |
|
FIGURE 3.223 ● Anterior-to-posterior extent of an acetabular labral tear. (A) Coronal FS PD FSE image. (B) Sagittal FS PD FSE image.
|
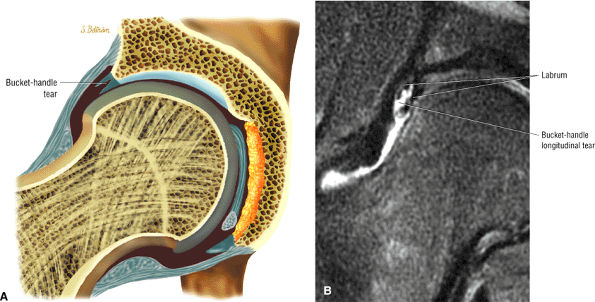 |
|
FIGURE 3.224 ● Bucket-handle acetabular labral tear. (A) Color coronal section showing a longitudinal tear of the lateral labrum. (B) Separation of displaced longitudinal labral surfaces in a bucket-handle longitudinal tear pattern.
|
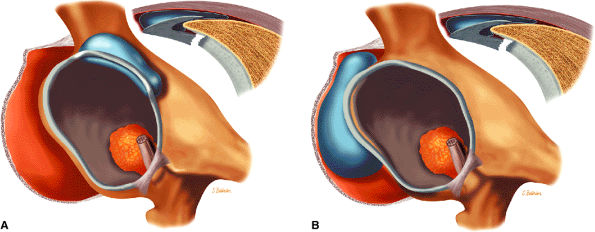 |
|
FIGURE 3.225 ● Anterosuperior-based (A) versus posterosuperior-based (B) paralabral cysts on color anterolateral views of the acetabular fossa and labrum.
|
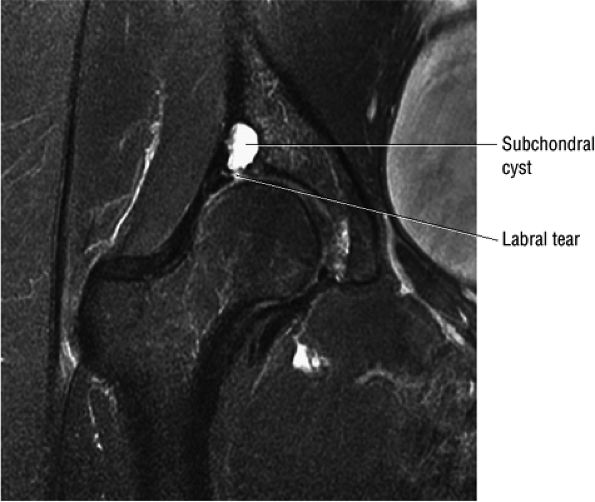 |
|
FIGURE 3.226 ● Subchondral acetabular cyst associated with an adjacent acetabular labral tear. Coronal FS PD FSE image.
|
-
Inflammatory OA presents with reactive subchondral edema involving both sides of the joint.
-
Younger patients may present with FAI as a precursor to OA.
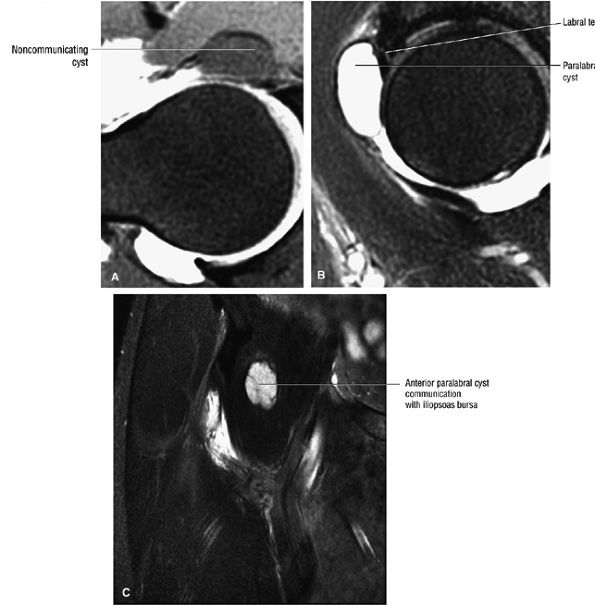 |
|
FIGURE 3.227 ● Noncommunicating paralabral cyst extending into the iliopsoas bursa between the iliofemoral and the pubofemoral ligaments. (A) Axial FS T1-weighted MR arthrogram with contrast extension into the anterior paralabral cyst. (B) Sagittal FS PD FSE image depicting the hyperintense paralabral cyst with an anterior labral tear origin. (C) Coronal FS PD FSE image showing anterior extension of the paralabral cyst into the iliopsoas bursa.
|
-
Grade 1: chondral inhomogeneity
-
Grade 2: inhomogeneity and discontinuity of the chondral surface, with hypointensity of the femoral head and neck on T1-weighted images
-
Grade 3: grade II disease plus irregular cortical morphology of the femoral head and acetabulum, cystic changes, and an indistinct zone between the femoral head and acetabulum
-
Grade 4: grade III disease plus femoral head deformity
-
Joint space narrowing with loss of superior joint space articular cartilage on both the acetabular and femoral sides
-
Hypointense subchondral sclerosis of the acetabulum and subsequently the femoral head associated with loss of joint space
-
Osteophytes with marginal or peripheral distribution in association with progressive FAI
-
Subchondral cysts larger than the cysts described in FAI
-
An attenuated or denuded chondral surface
-
Hypointense sclerosis of the acetabular roof and the opposing surface femoral head
-
A hypointense effusion and paralabral cysts
-
Marrow fat signal in osteophytes
-
Relative preservation of medial joint space relative to narrowed superior joint space
-
Single versus multiple load-bearing zone subchondral cysts that demonstrate hypointense to intermediate signal intensity
-
Linear hyperintensity in chondral fissures
-
Subchondral hyperintensity in the lateral acetabular roof and femoral head superior surface
-
Subchondral cysts, which may be multiple and variable in size
-
Hyperintense paralabral cysts adjacent to acetabular labral tears
-
Hyperintense femoral head and neck edema in active OA
-
Hyperintense fluid and inhomogeneity of synovium in the active inflammatory form of OA
edema, is seen in Postel coxarthropathy.221 This form of destructive OA is associated with rapid chondrolysis and hip joint destruction with minimal osteophytic response. As seen in FAI, there may be an accentuated convexity of the femoral head-neck contour laterally (Fig. 3.237), but chondral loss affects both the acetabulum and the femoral head.
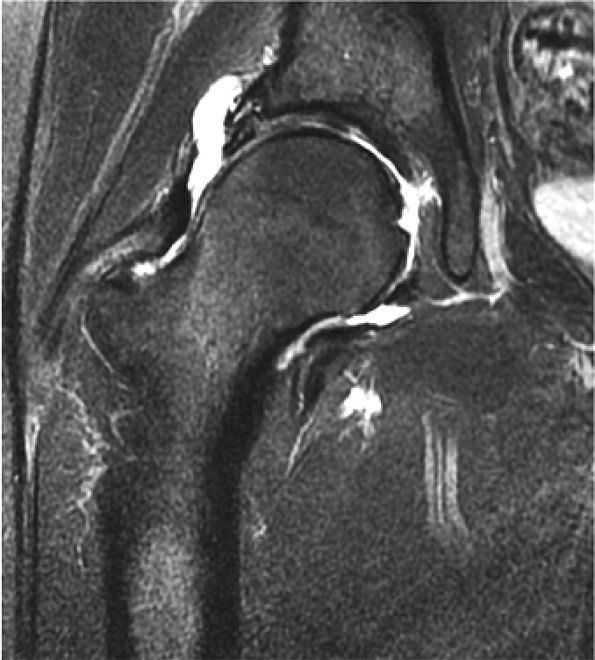 |
|
FIGURE 3.228 ● Superior and inferior extension of a lateral paralabral cyst. Coronal FS PD FSE image.
|
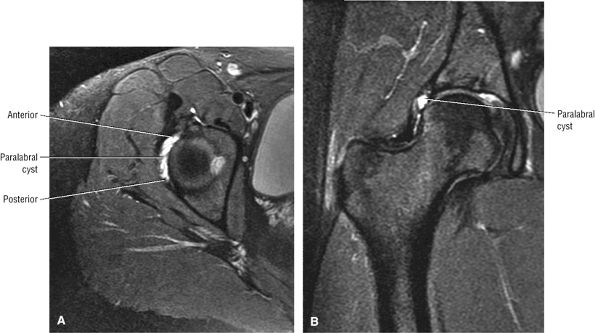 |
|
FIGURE 3.229 ● Anteroposterior extension of a lateral paralabral cyst on axial (A) and coronal (B) FS PD FSE images.
|
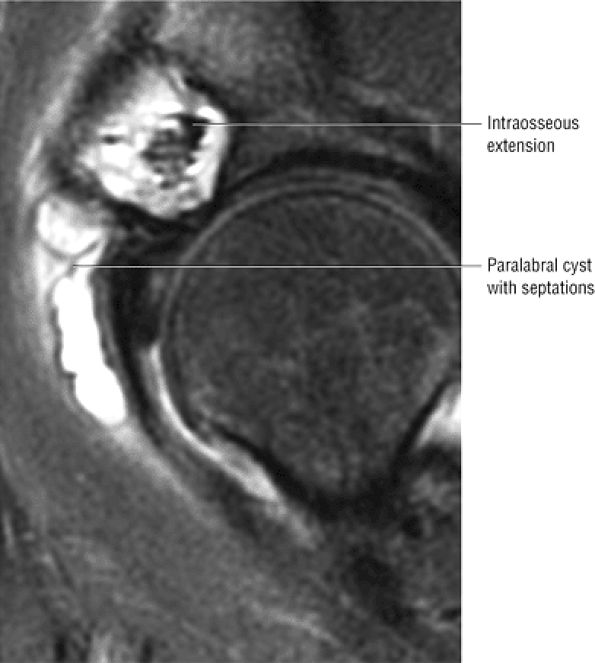 |
|
FIGURE 3.230 ● Hyperintense paralabral cyst with secondary osseous extension septations that are hypointense. Sagittal FS PD FSE image.
|
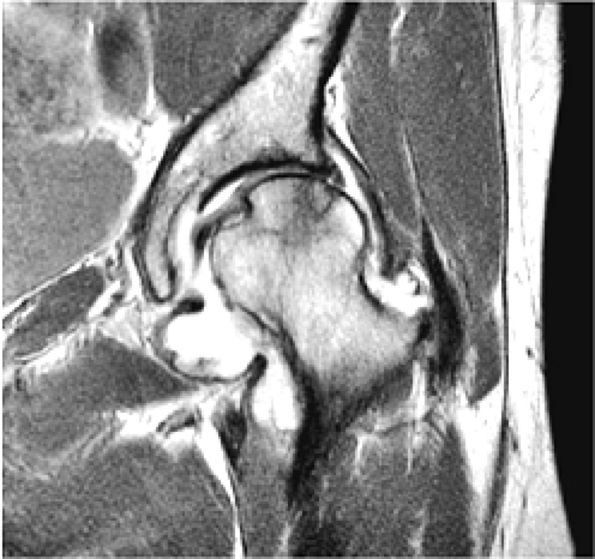 |
|
FIGURE 3.231 ● Superior joint space narrowing in osteoarthritis in a 50-year-old. Coronal T1-weighted MR arthrogram.
|
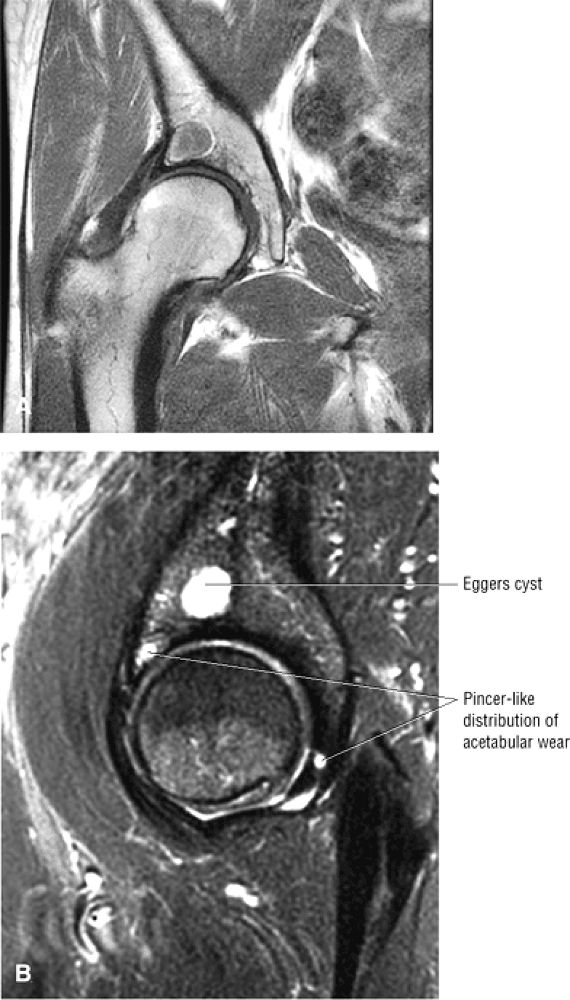 |
|
FIGURE 3.232 ● Eggers cyst of the acetabulum associated with superior joint space narrowing. (A) Coronal T1-weighted image. (B) Sagittal FS PD FSE image.
|
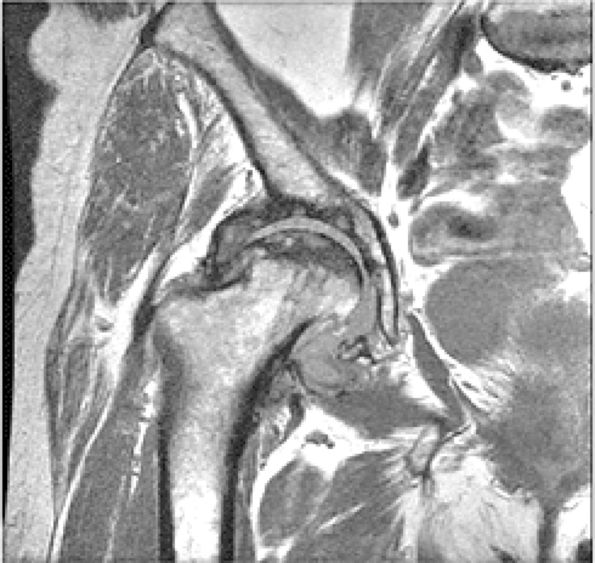 |
|
FIGURE 3.233 ● OA superimposed on osteonecrosis of the femoral head (secondary OA). Coronal T1-weighted image.
|
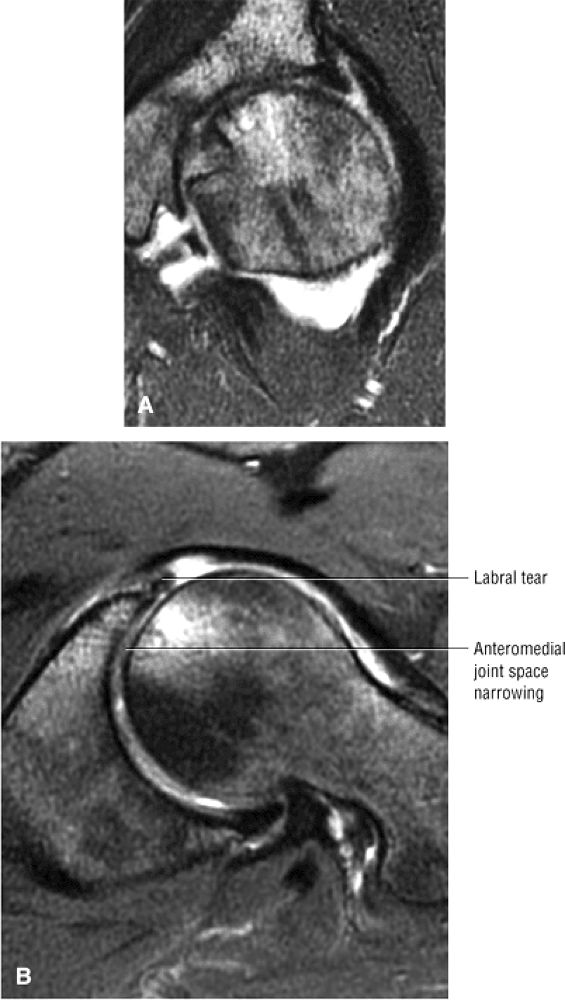 |
|
FIGURE 3.234 ● Medial joint space narrowing in osteoarthritis variant on coronal (A) and axial (B) FS PD FSE images.
|
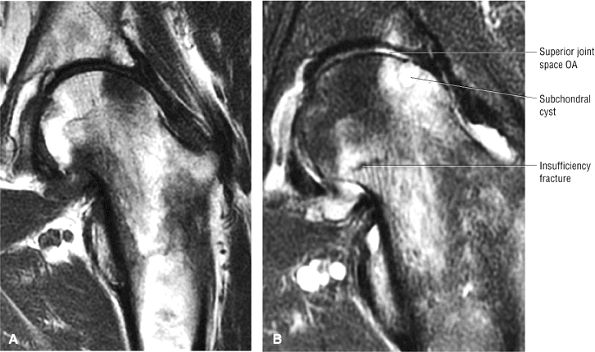 |
|
FIGURE 3.235 ● Coronal T1-weighed (A) and FS PD FSE (B) images of subchondral marrow edema associated with OA affecting both the acetabular and femoral sides of the joint. The femoral head edema is associated with a subchondral cyst.
|
-
Loose bodies may be found in the acetabular fossa and anterior capsule.
-
Loose bodies are associated with trauma, OA, and synovial chondromatosis/osteochondromatosis.
-
Loose bodies usually demonstrate intermediate cartilage signal or sclerotic calcified cartilage that is hypointense on T1 and FS PD FSE images.
They occur more commonly in older adults, due to associated OA, and in males slightly more often than in females. Their development may be related to the inelasticity of the fibrous capsule of the hip, which is reinforced by the iliofemoral, pubofemoral, and ischiofemoral ligaments. In addition, there is no articular cartilage surface for the fovea capitis of the femoral head. Loose bodies may be associated with trauma (commonly secondary to posterior dislocation and acetabular fracture), OA, pigmented villonodular synovitis (PVNS), and synovial chrondromatosis/osteochondromatosis. Crystal-induced arthropathies, such as gout and calcium pyrophosphate dihydrate deposition (CPPD), as well as rheumatoid arthritis, infection or septic arthritis, AVN, and LCP, may all predispose to the formation of loose bodies. OA, however, remains the most common source of chondral debris.
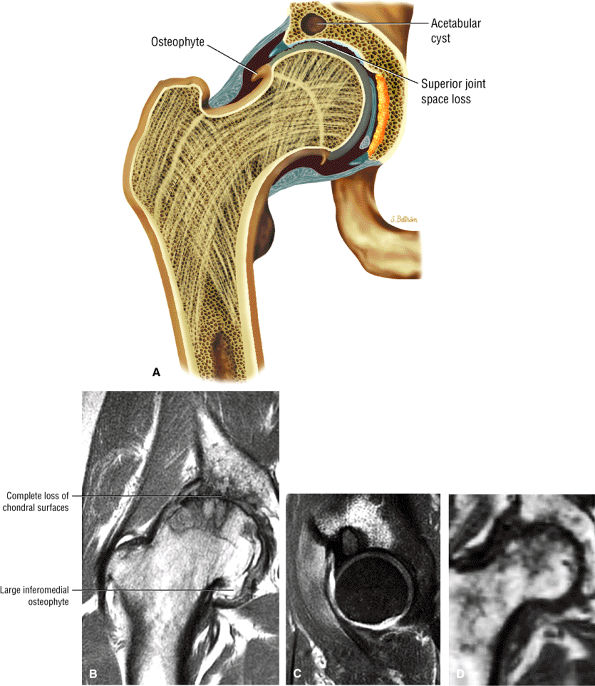 |
|
FIGURE 3.236 ● Advanced OA with osteophytosis, joint space narrowing, and denuded chondral surfaces. (A) Coronal color illustration of OA. (B) Coronal T1-weighted image. (C) Eggers cyst in acetabular roof with enhancing reactive edema and adjacent microacetabular insufficiency fracture. Sagittal enhanced T1-weighted image. (D) Destructive Postel coxarthropathy associated with chondrolysis without osteophytes shown for comparison. Coronal T1-weighted image.
|
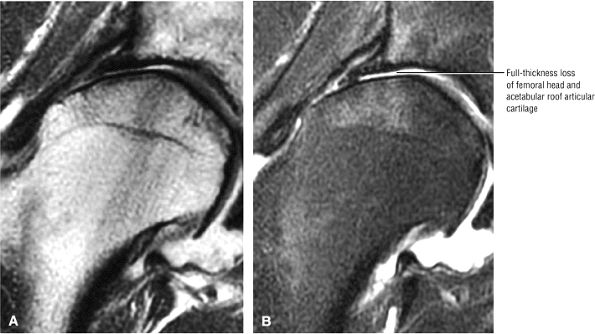 |
|
FIGURE 3.237 ● Coronal T1-weighted (A) and FS PD FSE (B) images of femoral head remodeling in advanced OA with joint space loss.
|
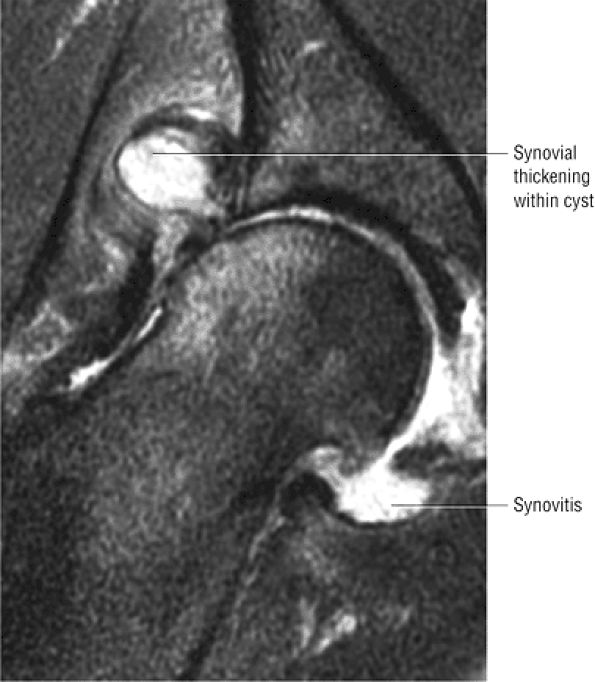 |
|
FIGURE 3.238 ● Paralabral cyst associated with OA. The cyst has intermediate-signal-intensity synovial thickening. Coronal FS PD FSE image.
|
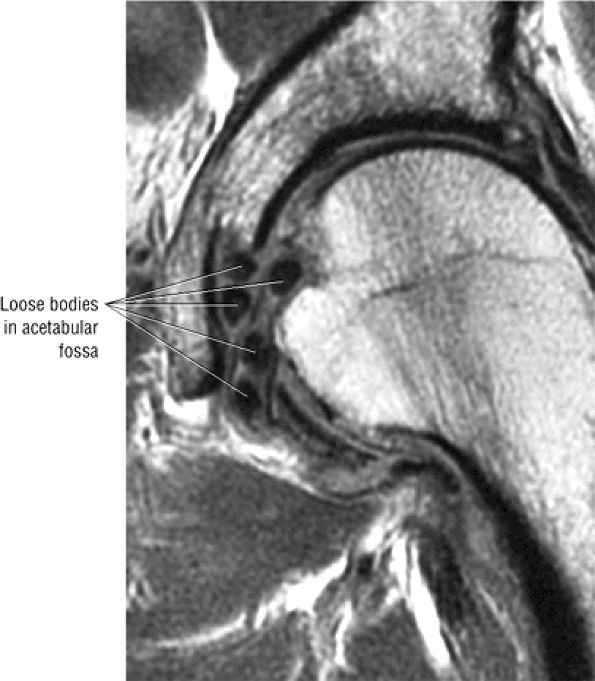 |
|
FIGURE 3.239 ● Acetabular fossa loose bodies related to calcified chondromatosis fragments. Coronal T1-weighted image.
|
-
Associated with concentric loss of hip joint space
-
Characterized by intermediate-signal-intensity synovial hypertrophy and intermediate to hyperintense pannus
-
Marrow edema of subchondral bone is hyperintense.
-
Capsular distention is usually identified.
disease. There appears to be a genetic predisposition to inheritance of the HLA-D antigen. Immune complexes can be found in the articular cartilage in this disease, but these complexes have not been shown to stimulate inflammatory reactions in peripheral blood lymphocytes or monocytes in vitro.224 An infectious etiology has also been postulated, and arthrotropic parvoviruses and lentiviruses have come under suspicion. These viruses are thought to induce T4 helper cells and cytokine-mediated oligoclonal B-cell responses producing IgG and IgM rheumatoid factors.
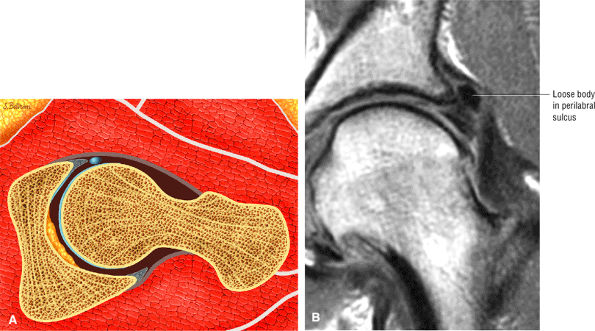 |
|
FIGURE 3.240 ● (A) Color axial section showing anterior capsule loose body. (B) Coronal T1-weighted image depicting perilabral sulcus loose body in a former ballet dancer with FAI.
|
-
Morning stiffness
-
Arthritis affecting three or more joints
-
Involvement of the joints of the hand
-
Symmetric joint involvement
-
Rheumatoid nodules
-
Presence of rheumatoid factor in the serum
-
Radiographic changes
and eventual complete loss of joint space, bony erosion can occur, resulting in bare areas at capsular insertions and protrusio acetabuli (migration of the medial femoral head cortex medial to the ilioischial line) or axial migration of the femoral head. Protrusio acetabuli may also be associated with steroid therapy.
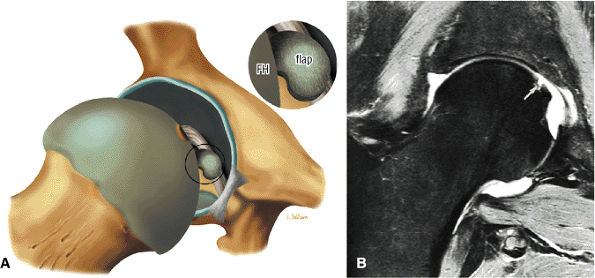 |
|
FIGURE 3.241 ● (A) Chondral flap lesion of the femoral head (FH). (B) A focal chondral lesion (arrow) can be seen superior to the fovea on a coronal FS T2-weighted FSE MR arthrogram.
|
-
Hypointense joint effusions
-
Hypointense subchondral erosions
-
A hypointense mass (fluid in iliopsoas bursa)
-
Hypointense acetabular and femoral head edema
-
Hyperintense joint effusions
-
Joint capsule distention
-
Demineralization (juxta-articular bone loss) with marrow hyperintensity (on FS PD FSE or STIR images)
-
Attenuation or loss of the normally hypointense subchondral plate
-
Intermediate to hyperintense subchondral cysts without a sclerotic reactive interface
-
Femoral and acetabular erosions not confined to any specific quadrant (as would be expected in OA)
-
Hyperintense marrow edema
-
Inhomogeneity of effusions, synovium, and debris relative to hyperintense fluid
are HLA-B27 positive. Unlike rheumatoid arthritis, which predominantly affects small joints, ankylosing spondylitis involves the spine and larger joints. The hip is frequently affected and may be the initial site of involvement. Overall, 17% to 35% of patients with ankylosing spondylitis have hip disease.231 Hip disease is most commonly found in patients with adolescent onset of disease. The role of MR imaging in ankylosing spondylitis has not been defined, and initial assessment with conventional radiography is the standard for diagnostic evaluation.
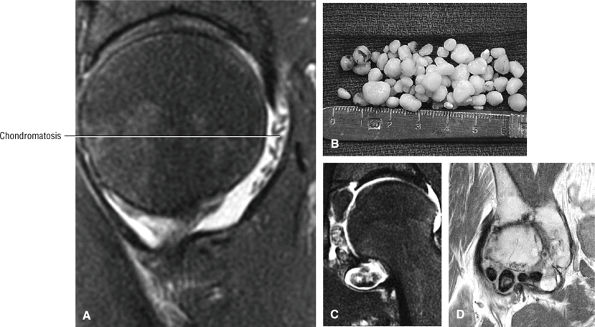 |
|
FIGURE 3.242 ● Spectrum of synovial chondromatosis (osteochondromatosis). (A) Small cartilage-signal-intensity posterior intra-articular bodies on a sagittal FS PD FSE image. (B) Characteristic cartilaginous nodules on gross examination. (C) Large detached cartilaginous bodies in the acetabular fossa and inferior capsule. (D) Sclerotic hypointense calcified cartilaginous bodies in the anterior hip capsule. Coronal PD FSE image.
|
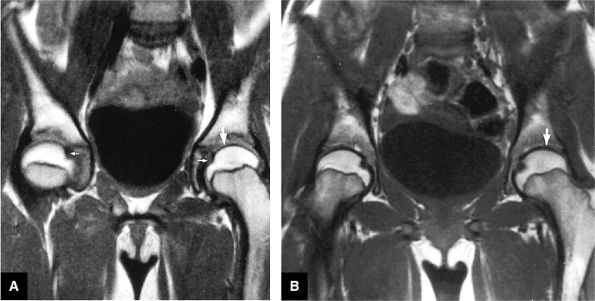 |
|
FIGURE 3.243 ● Early juvenile chronic arthritis. (A) T1-weighted coronal images of normal, age-matched control hips in a 9-year-old child with intact, intermediate-signal-intensity articular cartilage (large arrow). Normal low-signal-intensity fovea are present (small arrows). (B) In the early stages of juvenile chronic arthritis, T1-weighted coronal image shows attenuated articular cartilage (arrow).
|
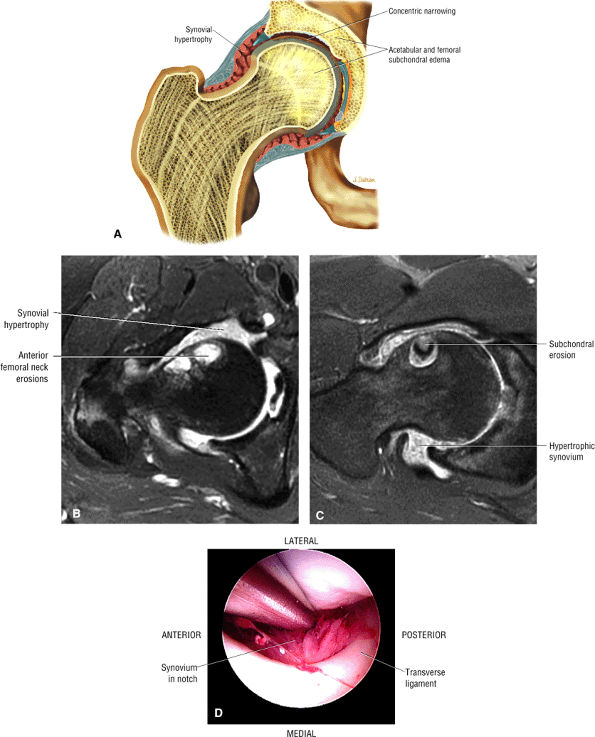 |
|
FIGURE 3.244 ● Rheumatoid arthritis with hypertrophic synovium, concentric joint space narrowing, and reactive subchondral edema. (A) Coronal color illustration of rheumatoid arthritis in adult. (B, C) Hypertrophic inflammatory synovium on axial FS PD FSE images. (D) Arthroscopic view of synovitis.
|
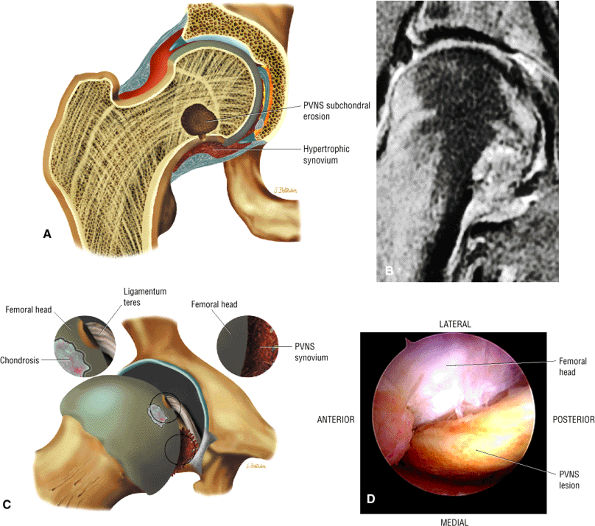 |
|
FIGURE 3.245 ● PVNS with hemosiderin-laden synovium eroding the medial femoral head-neck junction. (A) Coronal color illustration with subchondral erosion adjacent to proliferation of the synovium. (B) Coronal FS PD FSE image. (C) Arthroscopic view illustrated with insets of chondrosis and PVNS tissue. (D) Direct arthroscopic view of PVNS lesion above inferior capsule.
|
in ankylosing spondylitis are often located away from the areas of maximum weight-bearing. Arthrography can be very helpful diagnostically. The arthrogram usually demonstrates a large joint space with many irregularities. On aspiration, blood-stained yellow joint fluid is noted.
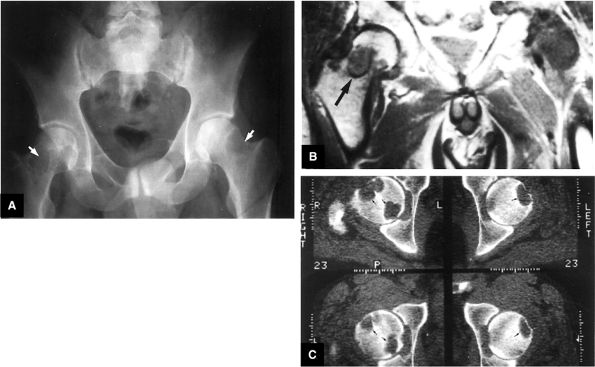 |
|
FIGURE 3.246 ● (A) Large cystic erosions of the femoral neck as seen on an AP radiograph in a patient on chronic renal dialysis (arrows). (B) T1-weighted coronal image shows intermediate-signal-intensity amyloid deposits in the femoral head and neck (arrow). (C) Axial CT shows multiple cystic erosions of the femoral head (arrows).
|
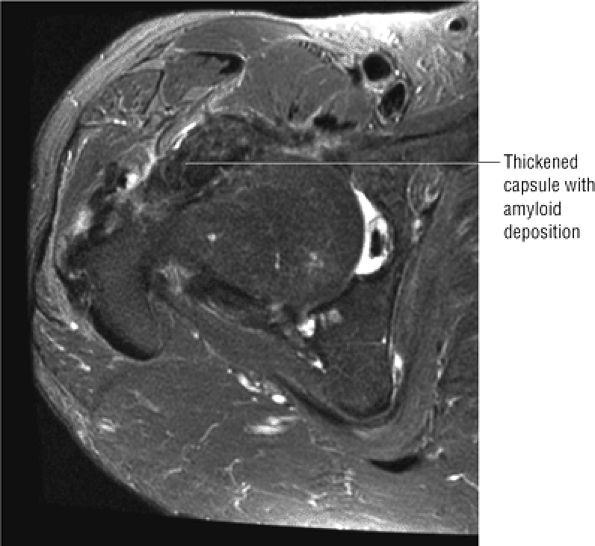 |
|
FIGURE 3.247 ● Amyloid arthropathy with diffuse hypointense amyloid deposits in areas of capsular thickening. Axial FS PD FSE image.
|
There is only a minimal increase in signal intensity on T2-weighted images. MR examination also reveals an associated soft tissue component not evident on plain radiographs. Although amyloid deposits may mimic the imaging characteristics of PVNS, including hypointense deposits (Fig. 3.247), the more diffuse capsular thickening and bilateral involvement indicate amyloid arthropathy, given the history of dialysis.
-
The stellate lesion is located superior to the acetabular fossa and is best visualized superiorly on coronal and sagittal images opposite the femoral head convexity.
-
The stellate lesion represents a normal area of chondral thinning.
-
The stellate lesion is associated with a plica or fibrous cord attached to both the lesion and acetabular fossa.
morphology and is located in the medial aspect of the acetabulum with either anterior or posterior extension relative to the fossa. The physeal scar is not a fracture and should not be confused with the more superior stellate lesion.
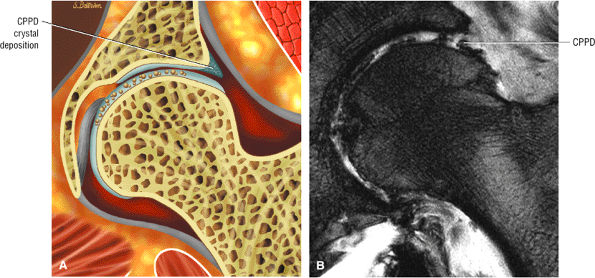 |
|
FIGURE 3.248 ● CPPD crystal deposition disease with hypointense crystal deposits throughout the chondral surfaces. (A) Color coronal section. (B) Coronal T2* gradient-echo image with susceptibility artifact induced by the crystal deposition.
|
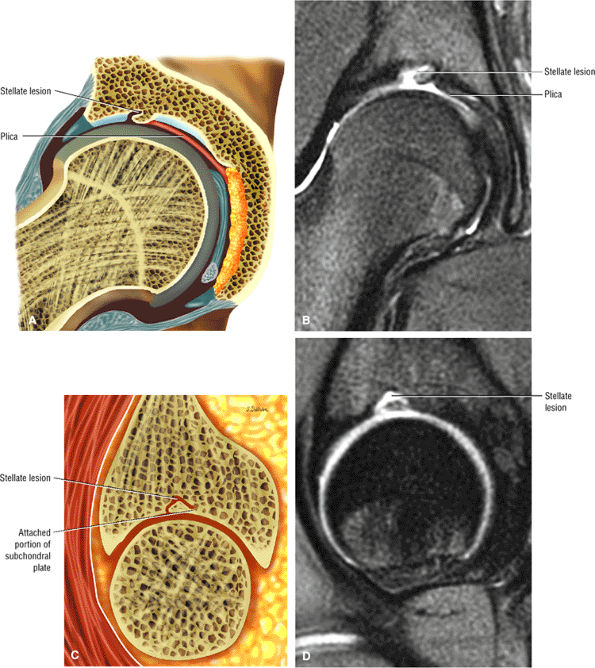 |
|
FIGURE 3.249 ● Stellate lesion in a 15-year-old associated with a thick plica. The plica is attached to the medial aspect of the stellate lesion and courses toward the pulvinar and acetabular fossa. (A) Coronal color section. (B) Coronal FS PD FSE image. (C) Lateral color illustration. (D) Sagittal FS PD FSE image.
|
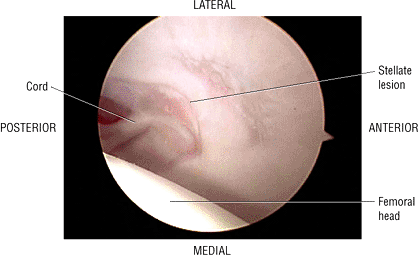 |
|
FIGURE 3.250 ● Arthroscopic view of a stellate lesion with associated attenuated chondral surface and plica.
|
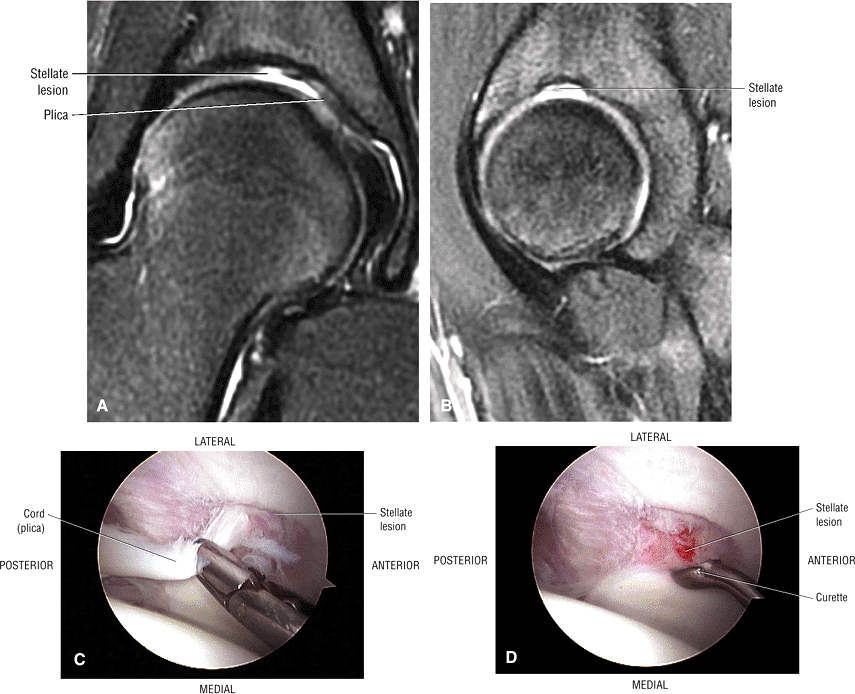 |
|
FIGURE 3.251 ● Stellate lesion in a teenager with superior acetabular irregularity and adherent plica cord adjacent to the medial aspect of the lesion and directed toward the acetabular fossa. (A) Coronal FS PD FSE image. (B) Sagittal FS PD FSE image. (C) Corresponding arthroscopic view demonstrating attached plica. (D) Arthroscopic view after a plical resection.
|
for fractures in closest proximity to the femoral head. The less common capital fracture is an intracapsular fracture of the femoral head. Extracapsular fractures are intertrochanteric or subtrochanteric.
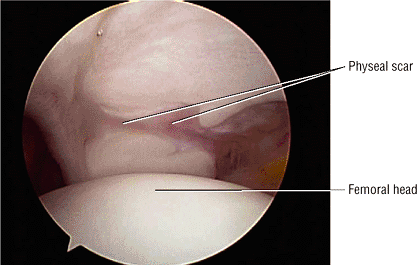 |
|
FIGURE 3.252 ● A physeal scar represents the remnant of the triradiate cartilage. This area is devoid of articular cartilage and may extend either posteriorly or anteriorly from the acetabular fossa.
|
-
Fractures are associated with posterior hip dislocation.
-
There is an increased risk of AVN if hip dislocation is not reduced.
-
The Pipkin classification is based on whether the fracture is below or above the ligamentum teres.
-
Subchondral femoral head stress fractures mimic transient osteoporosis of the hip.
-
Type I: This fracture is located caudad to (below) the central fovea and ligamentum teres. There is disruption of the ligamentum teres but no other associated injuries.
-
Type II: This fracture is located cephalad to (above) the fovea and ligamentum teres. The ligamentum teres remains attached to the fracture fragment and there are no associated injuries.
-
Type III: This is a type I or type II fracture with an associated femoral neck fracture (sometimes caused by overly aggressive closed reduction).
-
Type IV: This is a type I or type II fracture with fracture of the superoposterior acetabular rim.
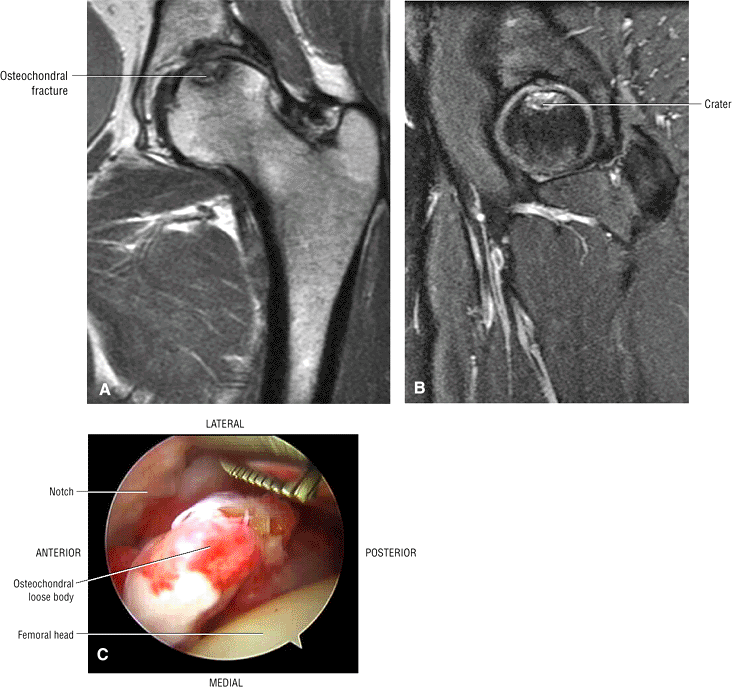 |
|
FIGURE 3.253 ● Osteochondral fracture with mild subchondral plate depression. (A) Coronal T1-weighted image. (B) Sagittal FS PD FSE image. (C) Arthroscopic view of an osteochondral loose body. Donor site is not visible. Osteochondral fracture or osteochondritis dissecans with a crater morphology representing the osteocartilaginous fracture fragment. Osteochondritis dissecans occurs in response to an acute injury with shearing forces and may appear with similar characteristics as AVN.
|
-
A hypointense fracture line (Fig. 3.254)
-
Hypointense femoral head edema, localized or diffuse
-
Hypointense to intermediate-signal-intensity hemorrhagic effusion
-
Hyperintense femoral head edema (Fig. 3.255) and effusions
-
Hyperintense muscle strains and tears
-
Labral tears and hyperintense paralabral cysts
-
Chondral injuries, indicated by interruption of the intermediate-signal chondral surface
-
AVN
-
Failed closed reduction
-
Associated femoral neck fracture
-
Incongruent reduction
-
Intra-articular fragments
-
Fracture repair
older patients. Pipkin type IV fractures are treated with ORIF for displaced or unstable acetabular fractures in younger patients and total arthroplasty in older individuals. Impacted femoral head fractures are treated by surgical elevation and grafting. Postreduction treatment includes traction, minimal weight-bearing, and physical therapy. Common complications include AVN, posttraumatic arthritis, recurrent dislocation, and sciatic nerve injury.
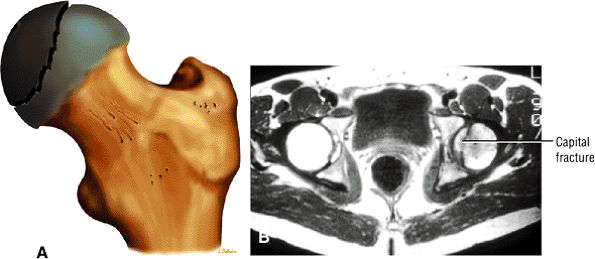 |
|
FIGURE 3.254 ● (A) Capital fracture classified as an intracapsular fracture of the proximal femur. (B) Hypointense fracture line of the medial femoral head. Axial T1-weighted image.
|
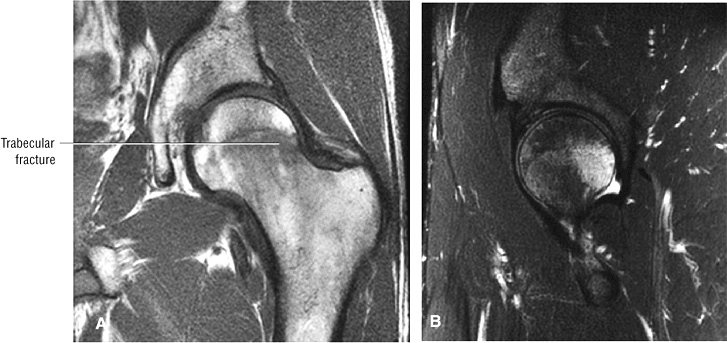 |
|
FIGURE 3.255 ● Posterolateral femoral head trabecular fracture without medial extension. (A) Coronal T1-weighted image. (B) Sagittal FS PD FSE image.
|
-
Subcapital fractures are more common than transcervical and basicervical fractures.
-
Transverse or distraction fractures are insufficiency fractures seen in older patients and are unstable.
-
Compression stress fractures in the inferomedial cortex occur in younger patients and are stable.
-
Extracapsular fractures are either intertrochanteric or subtrochanteric.
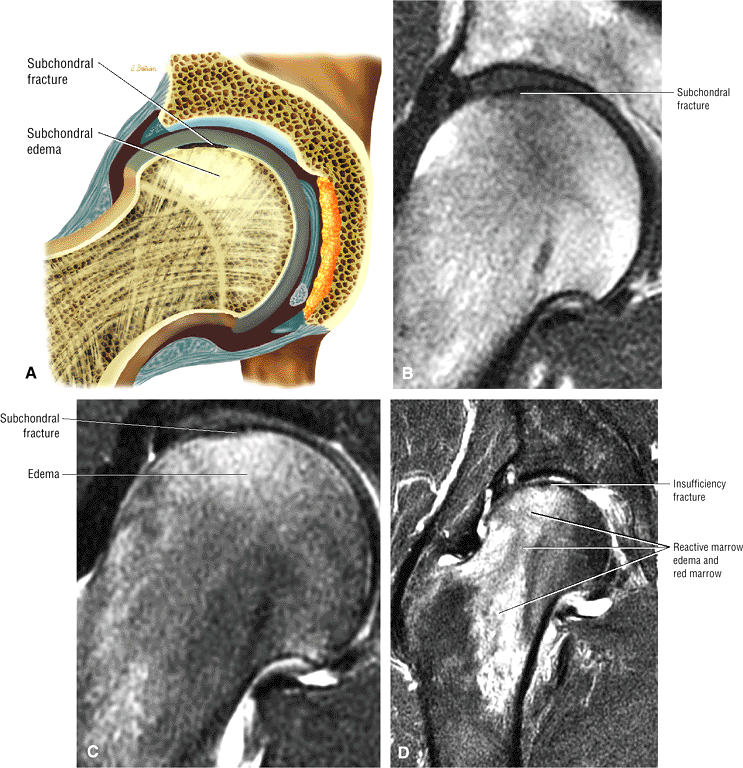 |
|
FIGURE 3.256 ● (A –C) Subchondral stress fracture with subtle subarticular hypointense fracture line and edema that is most hyperintense adjacent to the involved subchondral trabecular microfracture. (A) Color coronal illustration. (B) Coronal T1-weighted image. (C) Coronal FS PD FSE image. (D) Insufficiency fracture in a 70-year-old patient. Imaging findings are the same as in a stress fracture in a younger patient.
|
and insufficiency fractures,161 can be subdivided into three general categories based on location (Fig. 3.259):
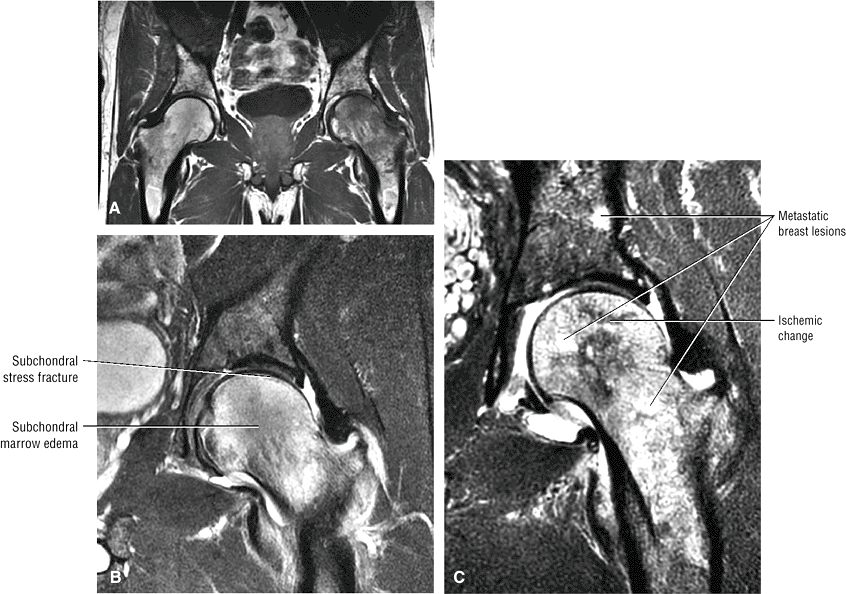 |
|
FIGURE 3.257 ● (A) Diffuse left femoral head and neck marrow edema that mimics transient osteoporosis of the hip on a T1-weighted large-FOV coronal image. (B) The distinct but subtle subchondral fracture is conspicuous on this coronal FS PD FSE image. (C) Metastatic disease may also produce a diffuse pattern of reactive (peritumoral) edema and should not be mistaken for transient osteoporosis. Coronal FS PD FSE image.
|
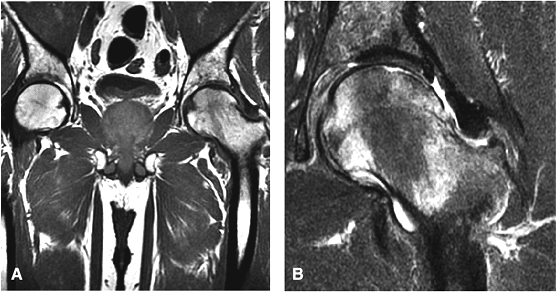 |
|
FIGURE 3.258 ● (A) Coronal T1-weighted images showing a subacute subchondral femoral head stress fracture. (B) Coronal FS PD FSE image of the resolution phase. The fracture line is hyperintense on the FS PD FSE image.
|
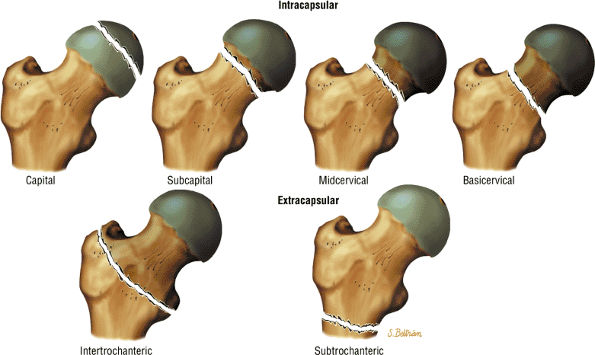 |
|
FIGURE 3.259 ● Fractures of the proximal femur are divided into intracapsular and extracapsular types. Subcapital fractures are common intracapsular fractures; the capital, mid- or transcervical and basicervical are uncommon.
|
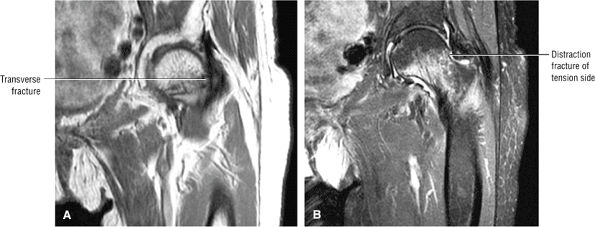 |
|
FIGURE 3.260 ● Distraction-type transverse fracture of the superior femoral neck in a 90-year-old. The distraction fracture involves the tension side of the femoral neck and may become displaced; therefore, internal fixation is recommended. (A) Coronal T1 FSE image. (B) Coronal FS PD FSE image.
|
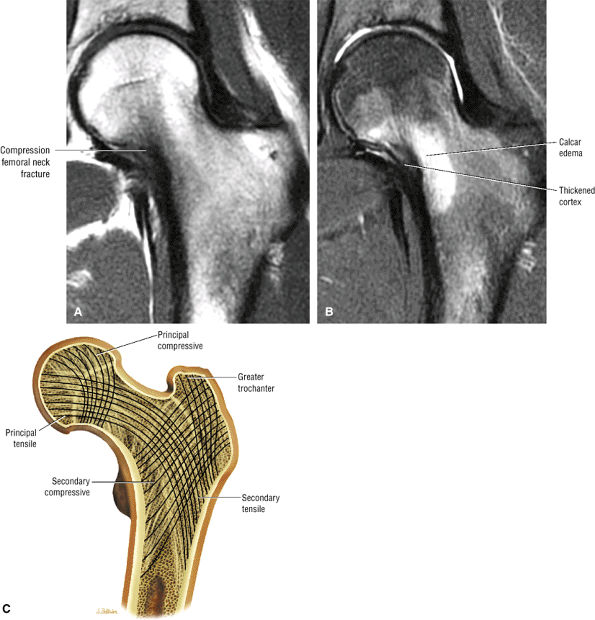 |
|
FIGURE 3.261 ● Compression-type medial fracture in the inferomedial femoral neck. These fractures are more common in the young athlete and rarely become displaced. (A) Coronal T1-weighted image. (B) Coronal FS PD FSE image. (C) Normal bony trabecular architecture of the proximal femur seen on conventional radiographs. A lack of integrity of the trabecular groups is associated with fracture comminution and decreased stability of fixation.
|
-
Subcapital fractures (common)
-
Transcervical fractures (uncommon)
-
Basicervical fractures (uncommon)
of the circumflex arteries) (Fig. 3.264). Overall, 15% of runners develop a stress fracture (Fig. 3.265) at some time, and 5% to 10% of stress fractures involve the femoral neck.
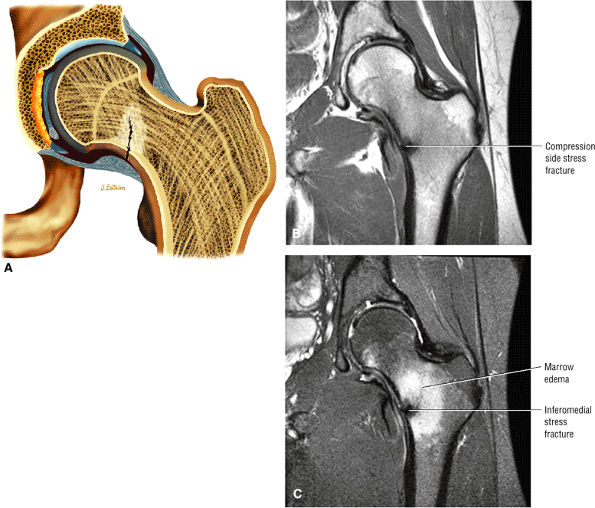 |
|
FIGURE 3.262 ● (A) Medial femoral neck compression-type stress fracture. Fracture is hypointense on T1-weighted (B) and FS PD FSE (C) coronal images. Marrow edema is hyperintense on the FS PD FSE image.
|
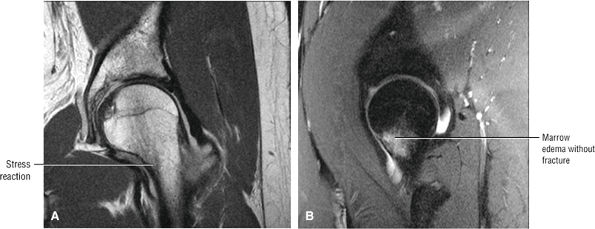 |
|
FIGURE 3.263 ● Medial calcar stress reaction prior to the development of a stress fracture. (A) Coronal T1 FSE image. (B) Sagittal FS PD FSE image.
|
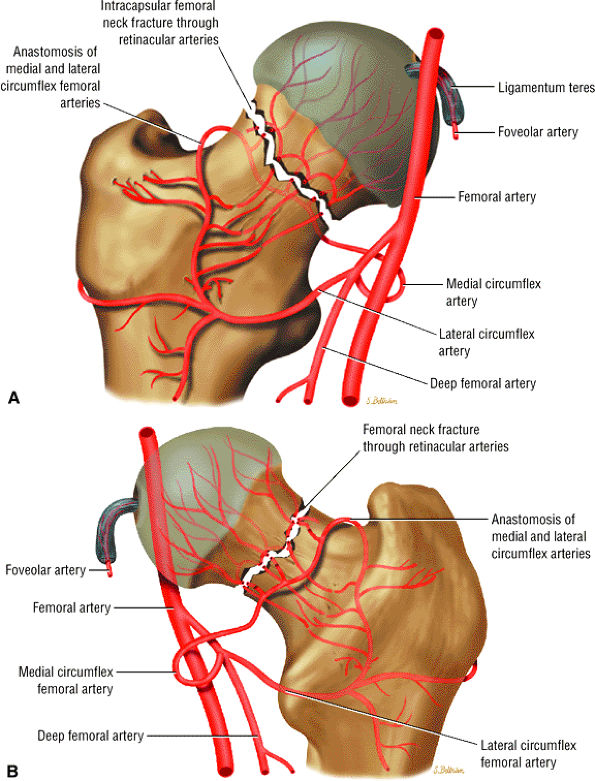 |
|
FIGURE 3.264 ● Vascular supply to the proximal femur with primary contribution from the circumflex femoral arteries. AVN of the femoral head is associated with intracapsular fractures. The tenuous blood supply to the femoral head derives from branches of the medial femoral circumflex artery. (A) Anterior perspective. (B) Posterior perspective.
|
-
Pauwels I: The fracture line is 0° to 30° to horizontal.
-
Pauwels II: The fracture line is 30° to 70° to horizontal.
-
Pauwels III: The fracture line is more than 70° to horizontal.
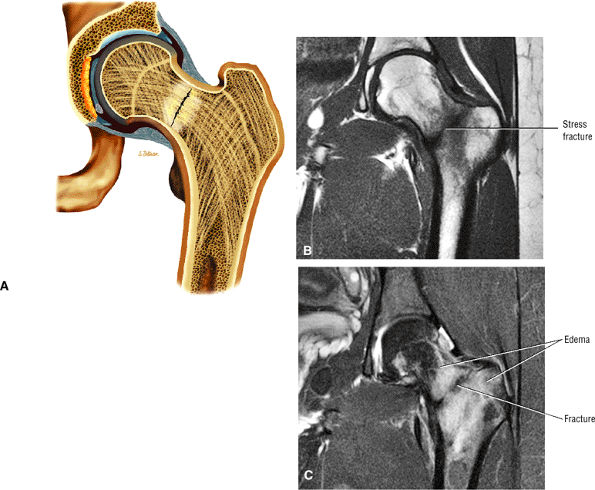 |
|
FIGURE 3.265 ● Complete stress fracture in a 23-year-old runner extending from the medial to the lateral cortex of the femoral neck. (A) Coronal color illustration. (B) Coronal T1-weighted image. (C) Coronal FS PD FSE image.
|
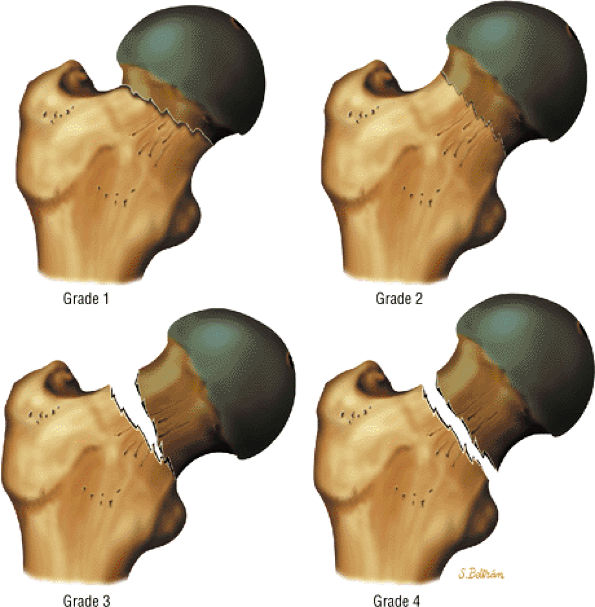 |
|
FIGURE 3.266 ● Garden classification of femoral neck (subcapital) fractures. Stage 1 fractures are incompletely impacted fractures with valgus malalignment, stage 2 fractures are complete fractures without displacement, stage 3 fractures are complete fractures with partial displacement, and stage 4 fractures are displaced fractures with complete fracture segment diastasis. Displacement is based on the position of the medial compressive trabeculae.
|
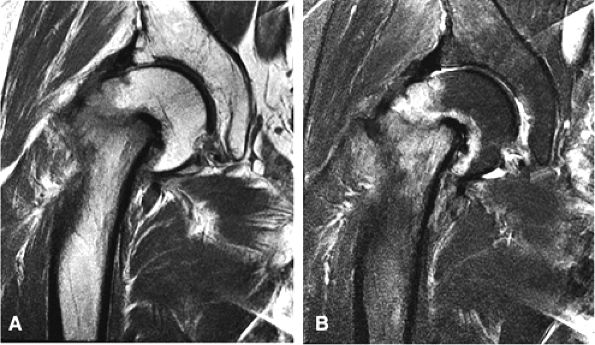 |
|
FIGURE 3.267 ● Stage IV complete subcapital (femoral neck) fracture. In a complete fracture the femoral head is separated from the proximal femur but the medial trabeculae of the femoral head remain aligned with the acetabular trabeculae. (A) PD FSE image. (B) FS PD FSE image.
|
-
Garden 1: the fracture is incomplete or impacted
-
Garden 2: the fracture is complete and nondisplaced
-
Garden 3: the fracture is complete with partial displacement
-
Garden 4: the fracture is complete with total displacement (Fig. 3.267)
-
Type I: endosteal or periosteal callus without a fracture line
-
Type II: fracture line present
-
Type III: fracture is displaced
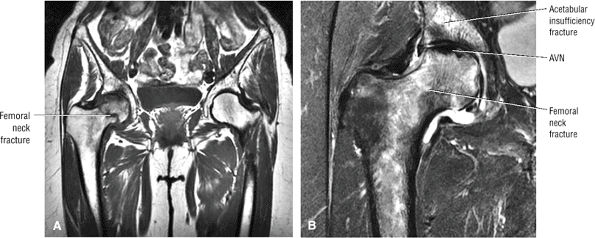 |
|
FIGURE 3.268 ● Femoral neck and acetabular insufficiency fracture in a 67-year-old woman. AVN is seen as a hypointense focus in the superior femoral head. (A) Coronal T1-weighted image. (B) Coronal FS PD FSE image.
|
osteoporotic-related subcapital fracture of the femoral neck from a pathologic fracture. The radiographic appearance of a subcapital fracture may mimic a pathologic fracture secondary to rotation displacement of the fracture fragments.252 3D CT or MR rendering can display varus or valgus deformities and postoperative screw placement. In displaced fractures, complicating osteonecrosis can be excluded on an MR image, and viability of the femoral head can be assessed. Early detection of hypointense sclerosis in AVN (Fig. 3.268) is also possible. T1-weighted images provide the best contrast for the low-signal-intensity fracture segment in contrast to adjacent bright-signal-intensity marrow fat. STIR images have shown greater sensitivity than gradient-echo techniques in displaying associated hemorrhage and edema at the fracture site.
-
Hypointense signal in the medial femoral neck in stress fracture
-
A discrete well-defined hypointense fracture line with or without complete extension across the femoral neck
-
A microtrabecular stress fracture with intact medial and lateral cortices
-
Hypointense joint effusion/hemorrhage and synovitis
-
Hyperintense marrow edema
-
Focal involvement of the medial cortex
-
Definition of fracture plane obliquity from 30° or less to over 70° (from the horizontal)
-
Differentiation of transverse from compression (medial) stress fractures
-
A hypointense fracture line
-
Marrow replacement and trabecular destruction in pathologic fractures
-
Direct visualization of associated chondral lesions in the acetabulum and femoral head
-
Possible association of a hyperintense acetabulum and edema in trabecular microfracture
-
Hyperintense adjacent soft tissue edema and hemorrhage
-
Acetabular fractures are divided into anterior column, posterior column, transverse, and complex fractures.
-
Fracture involves the posterior wall and the anterior wall in isolation or in combination with a column injury.
-
Related to high-energy trauma with the femoral force transferred to the acetabulum
-
Complications include Morel-Lavellée lesion as an internal degloving injury.
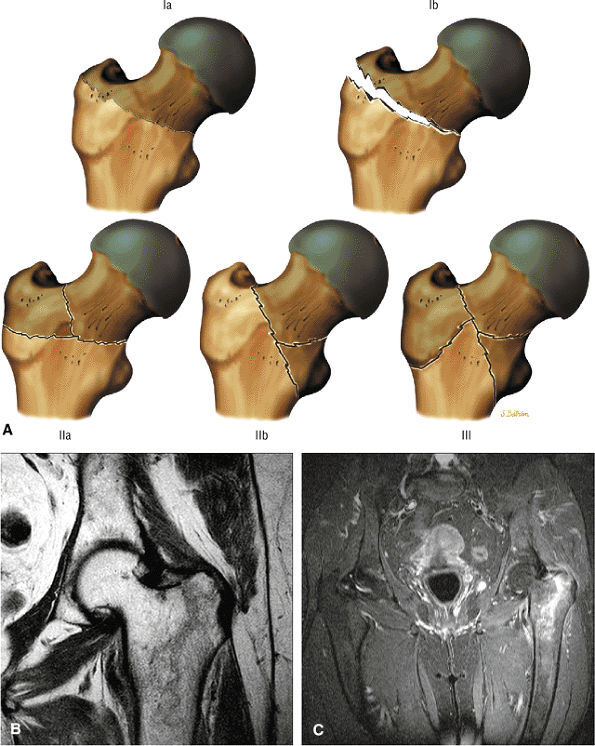 |
|
FIGURE 3.269 ● (A) The modified Evans classification of intratrochanteric fractures divides them into three main types. Type I fractures are two-part fractures, classified as either type Ia (not displaced) or type Ib (displaced). Type II fractures are three-part fractures and are classified as either IIa (involving the greater trochanter) or type IIb (involving the lesser trochanter). Type III fractures involve both the greater and lesser trochanters and are unstable and difficult to reduce. Coronal T1-weighted (B) and FS PD FSE (C) images of a nondisplaced linear intertrochanteric fracture with extension across the superior aspect of the greater trochanter.
|
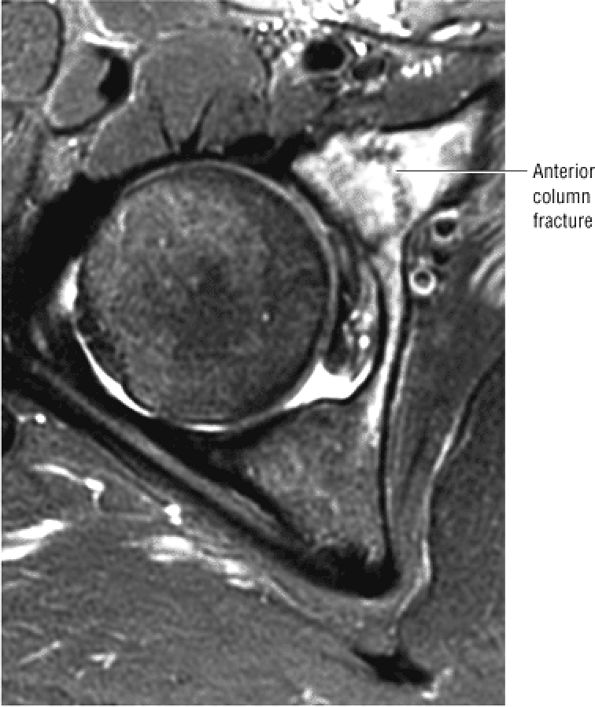 |
|
FIGURE 3.270 ● Axial FS PD FSE image of an isolated anterior (iliopubic) column fracture in a 28-year-old woman sustained in a motor vehicle accident.
|
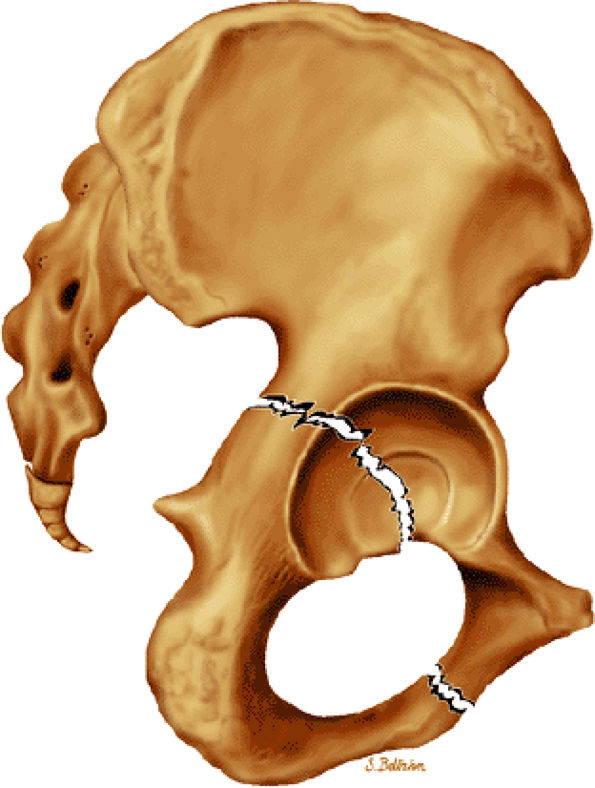 |
|
FIGURE 3.271 ● Posterior (ilioischial) column fracture. An anterior force applied to the femoral head is transmitted to the posterior acetabular wall and column.
|
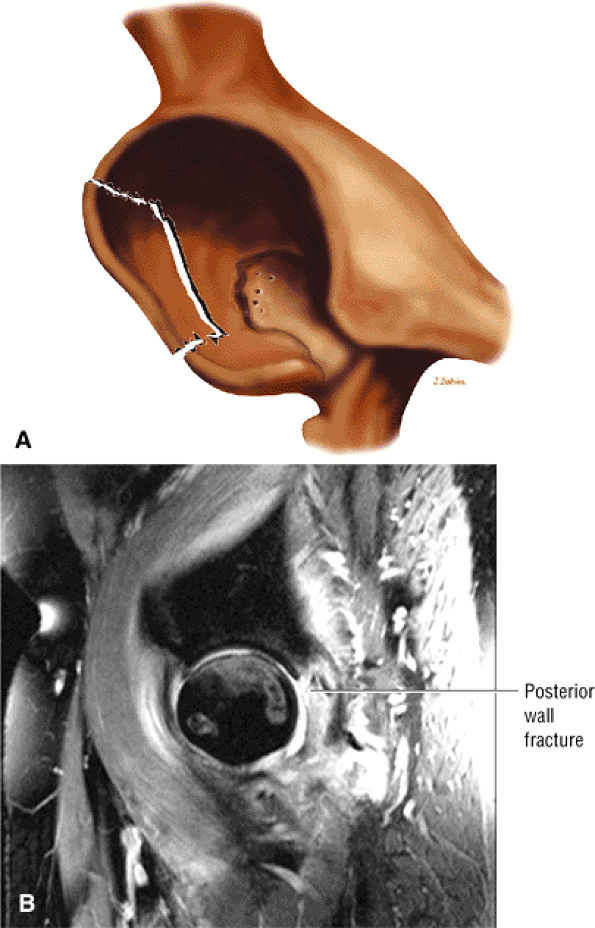 |
|
FIGURE 3.272 ● Posterior acetabular wall fracture after a posterior dislocation. A posterior acetabular wall fracture is more common than a posterior column fracture. With trauma, high-energy forces are transmitted or transferred from the femoral head to the acetabulum. The posterior wall is larger in area than the anterior wall. A posterior wall fracture occurs either in isolation or as part of a posterior column or transverse fracture. (A) Color illustration as viewed from anterolateral to posterior. (B) Sagittal FS PD FSE image.
|
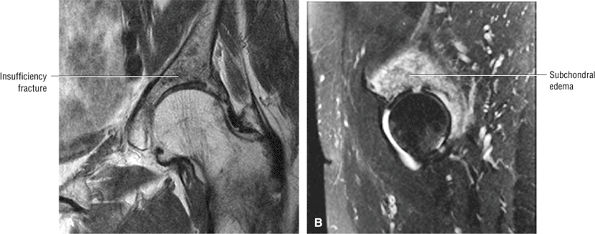 |
|
FIGURE 3.273 ● A 78-year-old with acetabular insufficiency fracture that is hypointense on the coronal T1-weighted image (A) and hyperintense on the sagittal FS PD FSE image (B). CT may be needed to identify the fracture line(s). Postmenopausal and senile osteoporosis, pelvic irradiation, corticosteroid therapy, and rheumatoid arthritis are all risk factors.
|
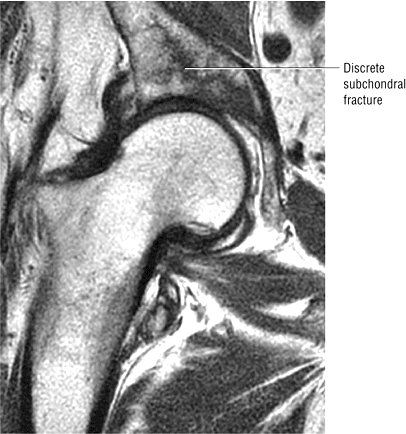 |
|
FIGURE 3.274 ● Coronal T1-weighted image demonstrating an acetabular roof insufficiency fracture with linear fracture morphology in a 90-year-old patient.
|
-
A hypointense fracture line and associated subchondral edema
-
Intra-articular fragments that may either demonstrate marrow fat signal or be sclerotic and appear hypointense
-
Pelvic ring fractures, best seen on coronal and axial images.
-
Hyperintense marrow edema adjacent to the fracture site
-
Associated pelvic ring and femoral head fractures
-
Hypointense free fragments
-
Disruption of the intermediate-signal-intensity chondral surfaces
-
Muscle trauma, including hyperintense edema and hemorrhage
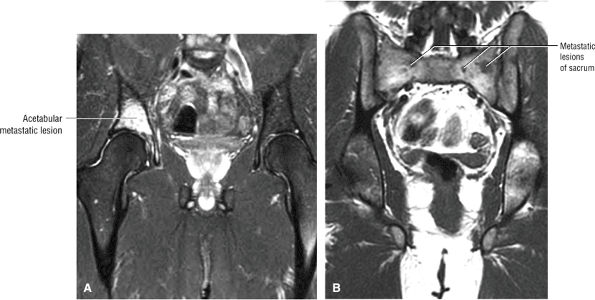 |
|
FIGURE 3.275 ● Metastatic breast carcinoma mimicking the appearance of an acetabular insufficiency in a 34-year-old patient. Other lesions are identified on the large-FOV T1-weighted image. (A) Coronal FS PD FSE image. (B) Coronal T1-weighted image.
|
-
Posterior dislocation is the most common type (90%) and is associated with femoral head fractures.
-
The sciatic nerve is at risk, and rupture of the ligament teres is a potential complication.
-
AVN is a delayed finding, and repeat MR should be performed within 2 months.
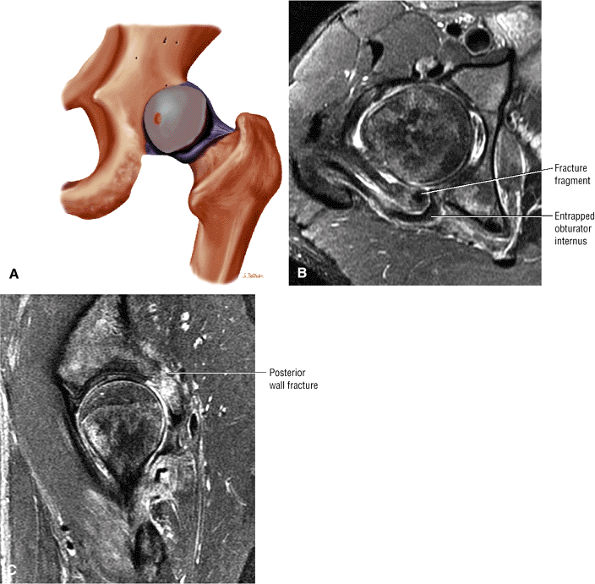 |
|
FIGURE 3.276 ● Posterior dislocation of the hip. (A) Posterior dislocations occur when the knee and hip are flexed and a posterior force is applied at the knee. These injuries are usually the result of a motor vehicle accident or a fall from a height, which may occur in sports such as snowboarding. Axial (B) and sagittal (C) FS PD FSE images showing posterior dislocation with a posterior wall fracture and a trapped and ruptured obturator internus tendon. Associated injury to the sciatic nerve may be caused by compression or laceration from a posterior osseous acetabular fragment.
|
-
Hip and gluteal pain
-
Shortening, adduction, internal rotation, and flexion of the lower extremity
-
A lack of range of motion and inability to bear weight
-
Sciatic nerve injury with loss of sensation in the posterior leg and foot and inability to dorsiflex and plantar flex
-
Hematoma and soft tissue swelling (Fig. 3.277)
-
Associated rupture of the ligamentum teres (Fig. 3.278)
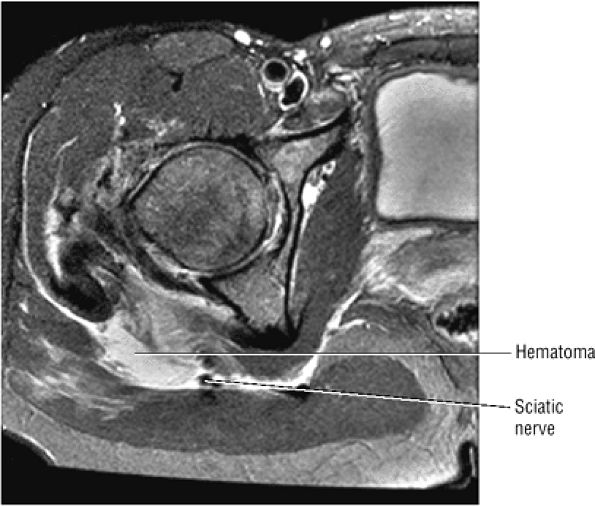 |
|
FIGURE 3.277 ● Hematoma associated with a posterior dislocation is compressing the sciatic nerve. Other associated injuries include tears of the obturator externus and internus and quadratus femoris, gemelli, and gluteus minimus. Axial FS PD FSE image.
|
-
Hip, gluteal, and groin pain
-
External rotation, adduction, and extension of the hip
-
Inability to walk and bear weight
-
Femoral nerve and femoral artery injury with pain, pallor, absence of the pulse, loss of motor function, and absent reflexes
-
Shortening of the affected limb
-
Abduction or adduction and internal or external rotation of the hip
-
Intrapelvic soft tissue injury and hemorrhage
-
Pipkin I: fracture of the femoral head below the central fossa
-
Pipkin II: fracture of the femoral head involving the central fossa
-
Pipkin III: fracture of the femoral head and neck
-
Pipkin IV: fracture of the femoral head and superoposterior acetabular rim
the patient in the supine position. For anterior dislocation, abduction, external rotation, and extension are used.
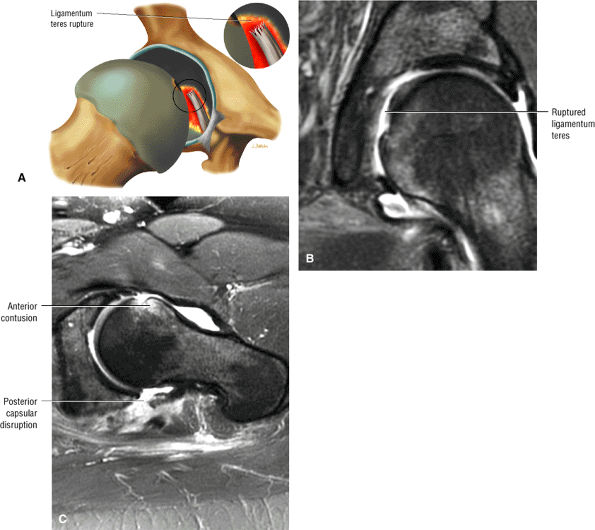 |
|
FIGURE 3.278 ● Ruptured ligamentum teres associated with a posterior dislocation. (A) Coronal illustration of ruptured ligamentum teres at its foveal attachment. The discontinuity of the ligamentum teres is assessed on both coronal (B) and axial (C) FS PD FSE images. An associated femoral head contusion can be seen on the coronal image (B).
|
-
Thigh splints involve the posteromedial adductor insertion.
-
There is hyperintense periosteum, cortex, or a medullary cavity of the proximal to mid-femoral diaphysis.
 |
|
FIGURE 3.279 ● Thigh splint with posteromedial periosteal edema tracking along the adductor insertion. (A) Color axial cross-section through the affected periosteum. (B) Axial FS PD FSE image. (C) Sagittal FS PD FSE image.
|
-
Inferior pubic ramus stress fractures are seen in athletes; superior ramus insufficiency fractures are seen in older patients.
-
Osteitis pubis occurs as a clinical subtype in sports-related endeavors and is characterized by subchondral superior pubic ramus hyperintensity immediately adjacent to the pubic symphysis.
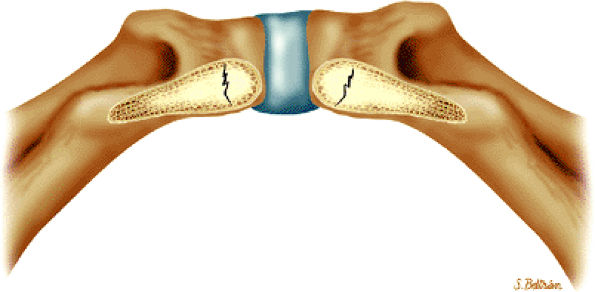 |
|
FIGURE 3.280 ● Color illustration of bilateral inferior pubic rami stress fractures. Inferior perspective.
|
-
Noninfectious
-
Infectious
-
Sports-related
-
Degenerative
contraction is related to insufficient repair time and osteoclastic resorption that outpaces osteoblastic bone formation.
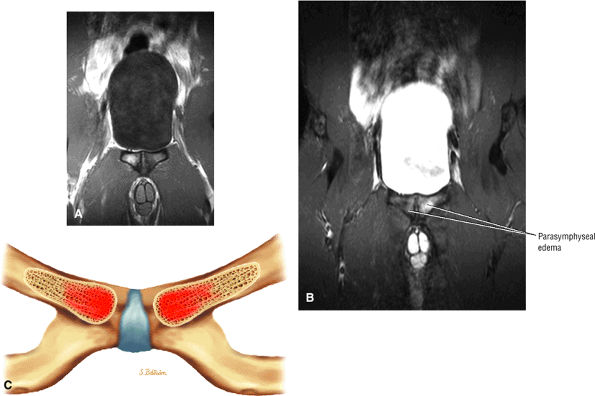 |
|
FIGURE 3.281 ● Osteitis pubis directly adjacent to the pubic symphysis may occur in sports requiring excessive twisting and turning (such as soccer) or from repetitive shear stress with excessive side-to-side motion, as occurs in runners. (A) Coronal PD-weighted image. (B) Coronal FS PD FSE image. (C) Corresponding coronal color illustration illustrates parasymphyseal edema.
|
-
In female runners and military recruits, inferior pubic rami fractures result from the specifics of female versus male pelvic geometry, an increased stride (gait) length-to-height ratio compared with taller male recruits, and decreased muscle bulk, which subjects bones to greater forces.
-
Fractures that occur after hip arthroplasty are probably stress fractures related to increased activity with the new prosthesis.
-
Insufficiency fractures are seen most often in older women with postmenopausal osteoporosis. They may be secondary to sacral insufficiency fractures, which cause increased forces to the pubic arch.
-
Tensile stress, generated by muscle mass originating from the pubic ramus, is another mechanism of injury.
-
Malgaigne fracture (see discussion below)
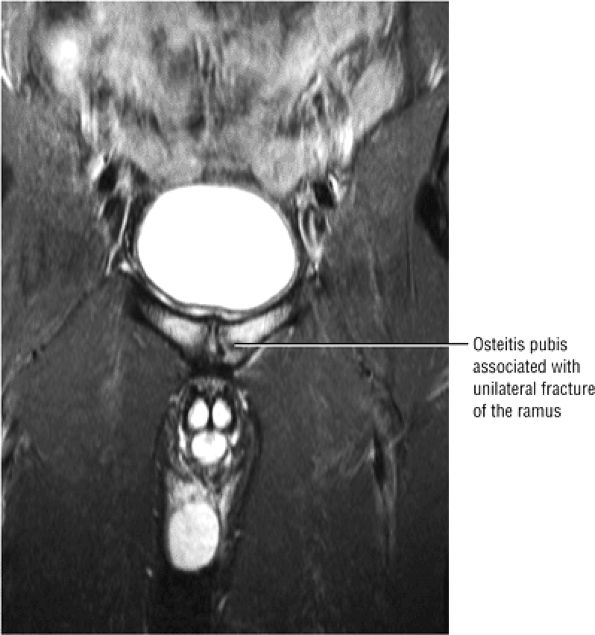 |
|
FIGURE 3.282 ● Osteitis pubis in a football player with a discrete fracture of the left medial superior pubic ramus. Stress fractures in athletes commonly occur in the inferior pubic ramus as a result of the pull of the adductor magnus muscle unrelated to the osteitis pubis. Coronal FS PD FSE image.
|
may also depict a hypointense thickened cortex or hyperintense edema parallel to the superior/inferior border of the pubic ramus.
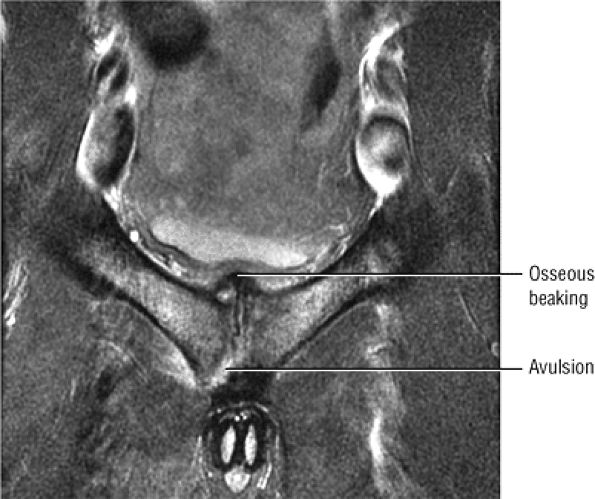 |
|
FIGURE 3.283 ● Osteitis pubis with avulsion of the thick inferior arcuate pubic ligament. Marginal irregularity, symmetric bone resorption, sclerosis, and cortical avulsion may be seen in athletes with osteitis pubis. There is superior osseous beaking of the symphysis with mild impression on the base of the bladder. Coronal FS PD FSE image.
|
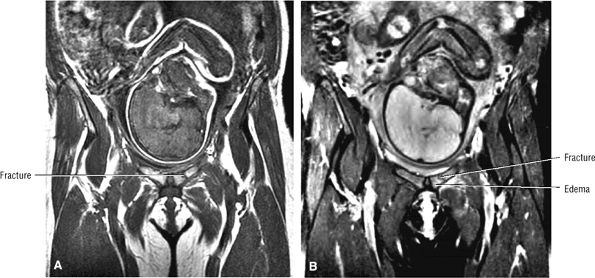 |
|
FIGURE 3.284 ● Left superior pubic ramus fracture that occurred during the third trimester of pregnancy. (A) Coronal T1-weighted image. (B) Coronal FS PD FSE image.
|
-
Unilateral or bilateral vertical sacral alar insufficiency fractures are parallel to the SI joints and appear hyperintense on FS PD FSE images.
-
Most commonly occur in postmenopausal osteoporosis
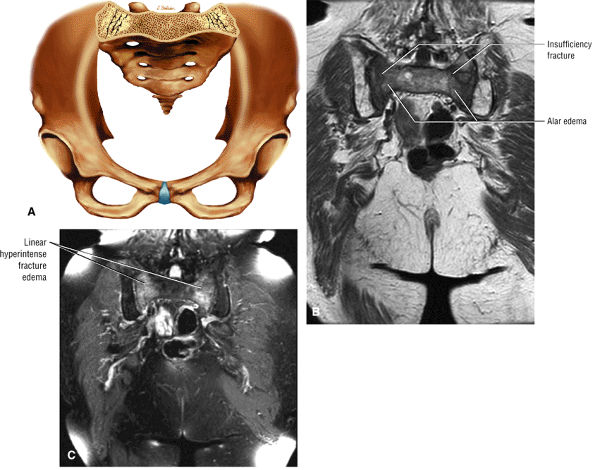 |
|
FIGURE 3.285 ● (A) Bilateral sacral alar insufficiency fractures with associated edema. (B) Coronal T1-weighted image identifying marrow edema and fracture morphology. (C) Coronal FS PD FSE image with characteristic linear regions of hyperintensity parallel to the sacroiliac joints.
|
-
Fracture with disruption of the ipsilateral SI joint
-
Fracture through a sacral wing
-
Fracture through the ilium
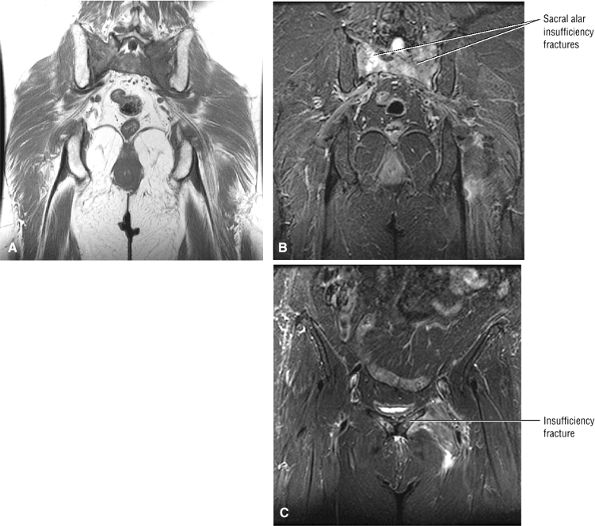 |
|
FIGURE 3.286 ● Superior pubic ramus insufficiency fracture associated with bilateral sacral alar fractures. Superior pubic ramus fractures may develop secondary to increased anterior arch strain resulting from the initial failure of the sacrum or posterior arch. (A) Coronal T1-weighted image. (B) Coronal FS PD FSE image. (C) Coronal FS PD FSE image.
|
-
Sciatic nerve distribution
-
Tibial
-
Peroneal
-
Injury associated with total hip arthroplasty
-
-
Femoral nerve distribution
-
Injury associated with total hip arthroplasty or tumor
-
-
Obturator nerve distribution
-
Pelvic tumors
-
Entrapment neuropathy (fascial or vascular structures as the source of hip and groin pain)
-
-
Obturator canal
-
Interval between the pectineus and obturator externus
-
Interval between the adductor longus and brevis
-
Interval between the obturator externus and adductor magnus
-
Interval between the adductor magnus and the adductor brevis
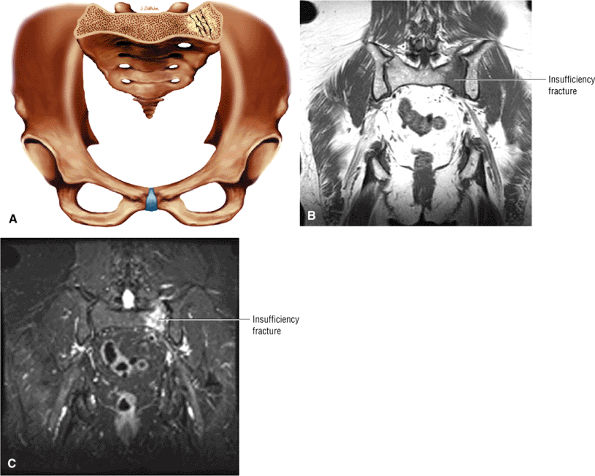 |
|
FIGURE 3.287 ● Unilateral sacral insufficiency fracture of the left sacral alar. The majority of patients affected with pelvic insufficiency fractures are 60 years of age or older, with a female predominance. (A) Anterior perspective color illustration. (B) Coronal T1-weighted image. (C) Coronal FS PD FSE image.
|
-
Acute hematogenous osteomyelitis is seen more often in pediatric patients and posttraumatic osteomyelitis is seen more often in the adult population.
-
Staphylococcus aureus is the most common infecting organism.
-
The sinus tract is hyperintense on FS PD FSE images.
-
The involucrum is a periosteal reaction.
-
The sequestrum is hypointense on T1- and PD-weighted and FS PD FSE images.
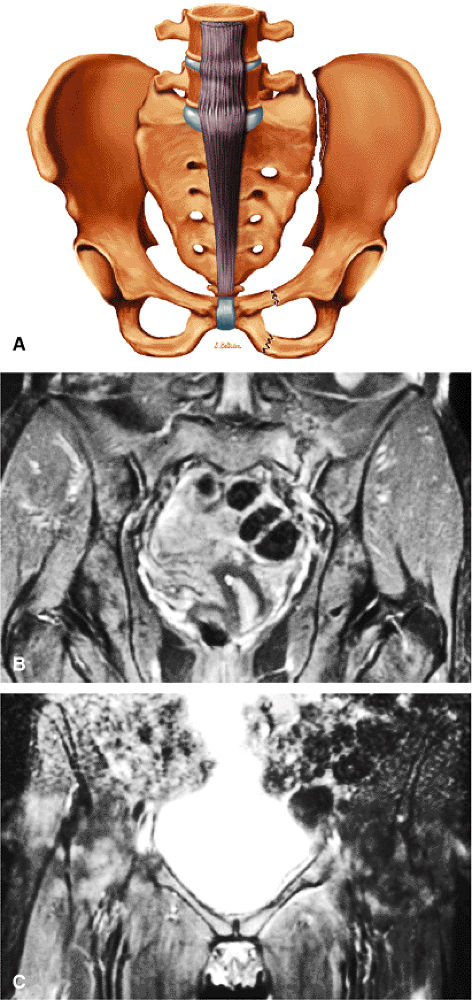 |
|
FIGURE 3.288 ● (A) Malgaigne fracture with fracture of the superior and inferior pubic ramus and ipsilateral sacroiliac joint. (B) Coronal FS PD FSE image with left-sided sacroiliac joint disruption. (C) Corresponding anterior coronal image demonstrating left superior pubic ramus fracture.
|
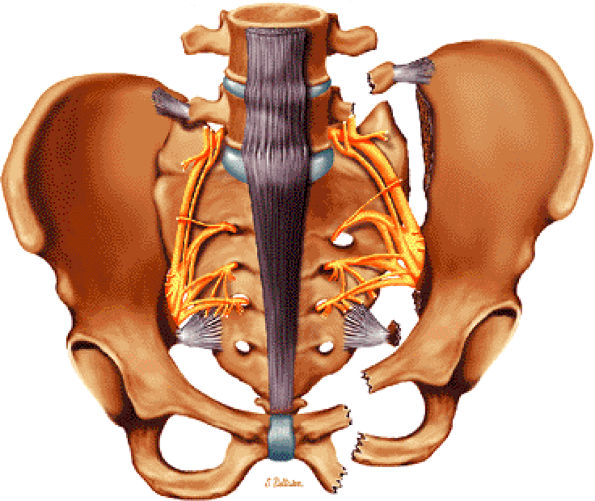 |
|
FIGURE 3.289 ● Malgaigne fracture with superior and posterior dislocation of the sacroiliac joint and fracture of the superior and inferior pubic rami (ipsilateral). The superior shift of the hemipelvis is associated with stretching of the sacral nerves. Associated ischial spine and transverse process fractures are shown.
|
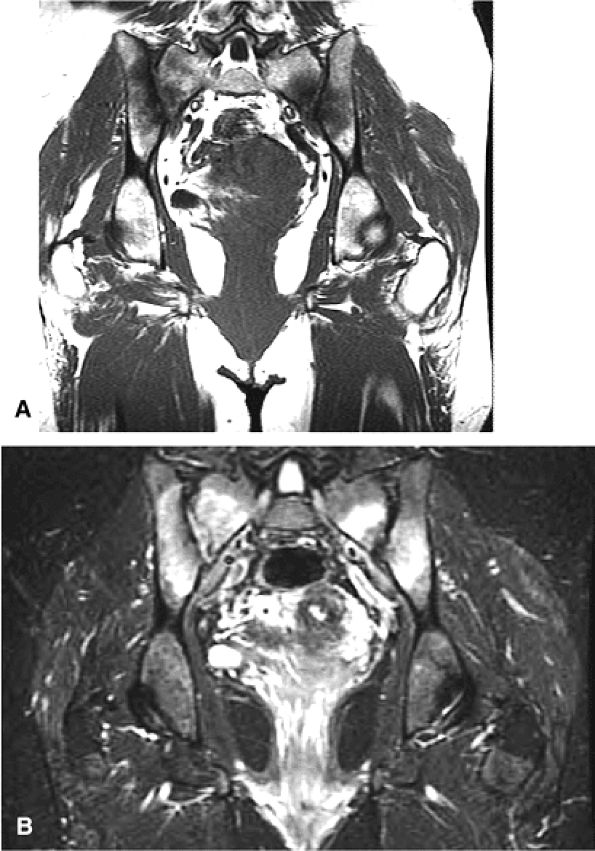 |
|
FIGURE 3.290 ● Bilateral sacroiliitis is hypointense on coronal T1-weighted (A) and hyperintense on coronal FS PD FSE (B) images. In ankylosing spondylitis, Reiter syndrome, and enteropathic sacroiliitis, the pattern of sacroiliac joint involvement is bilateral and symmetric. In psoriatic arthritis, rheumatoid arthritis, and juvenile chronic arthritis, it is bilateral and asymmetric.
|
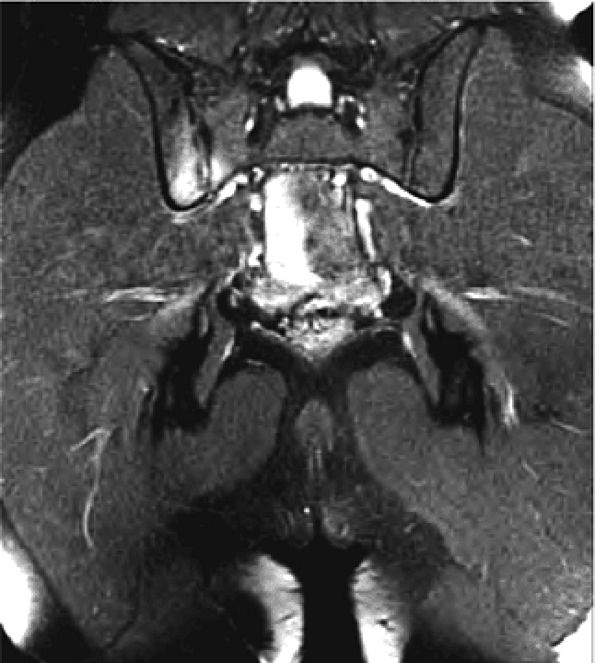 |
|
FIGURE 3.291 ● Unilateral sacroiliitis involving the inferior aspect of the right SI joint. Unilateral involvement is seen in gout, infection, and OA. Coronal FS PD FSE image.
|
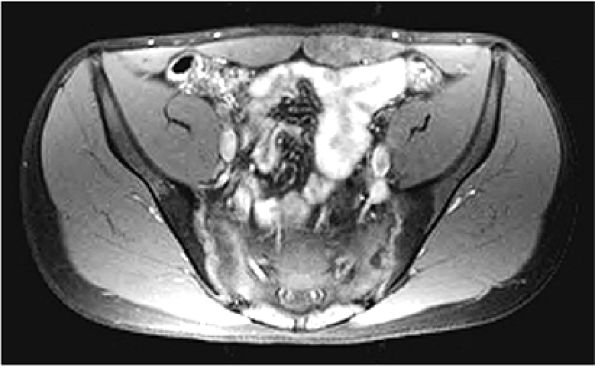 |
|
FIGURE 3.292 ● Ankylosing spondylitis with bilateral sacroiliitis complicated by a right sacral alar insufficiency fracture. Axial FS PD image.
|
-
Hypointense marrow edema and cortical destruction (marrow edema is especially well displayed on T1-weighted images and has a high association with osteomyelitis)269
-
Hypointense reactive joint effusion (up to one third of patients with septic arthritis may lack an associated joint effusion)269
-
Hypointense soft tissue abscess
-
A sinus tract from the skin to the cortex
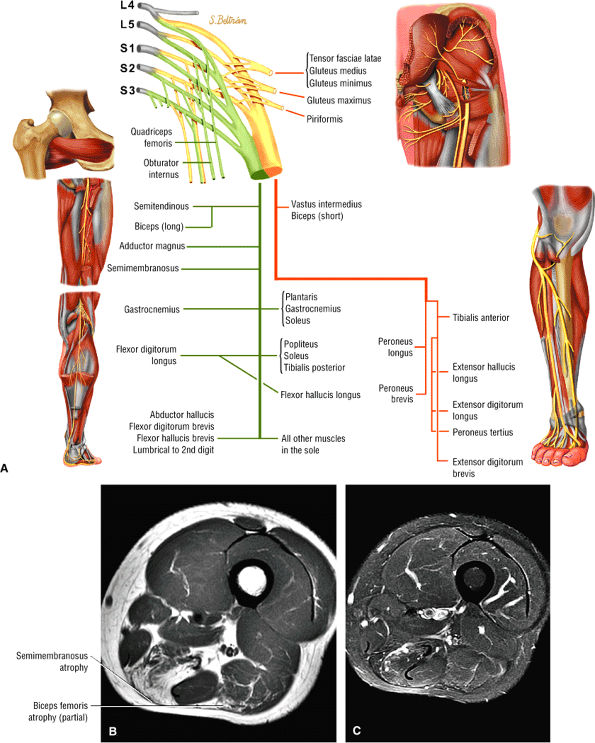 |
|
FIGURE 3.293 ● (A) Sciatic (tibial and peroneal) motor nerve distribution. (B, C) Semimembranosus and partial biceps femoris atrophy in a 45-year-old patient presenting with lower extremity involvement in facioscapulohumeral muscular dystrophy. (B) Axial T1-weighted image. (C) Axial FS PD FSE image.
|
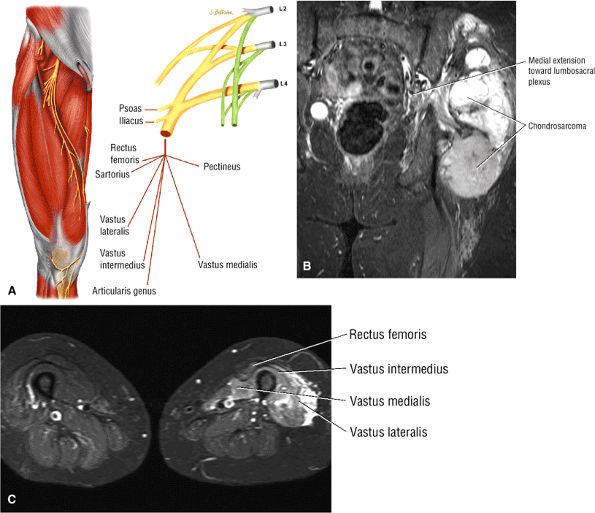 |
|
FIGURE 3.294 ● (A) Femoral nerve distribution. Coronal (B) and axial (C) FS PD FSE images of invasive chondrosarcoma with proximal involvement of the posterior branches of the lumbar nerve roots.
|
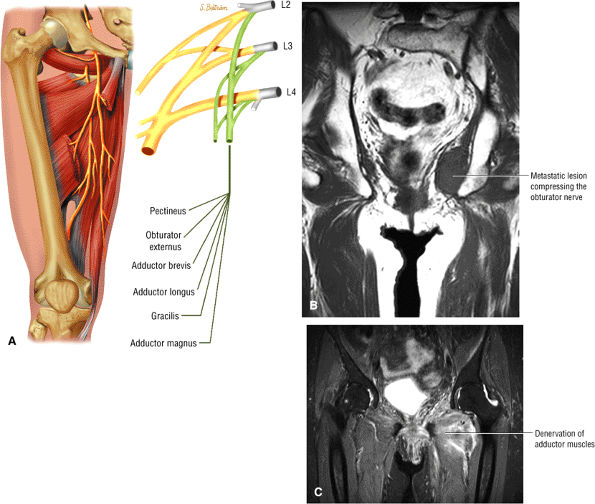 |
|
FIGURE 3.295 ● Obturator nerve denervation associated with metastatic pelvic side wall mass. (A) Obturator nerve motor distribution. (B) Left lateral pelvic metastatic mass. (C) Adductor muscle denervation.
|
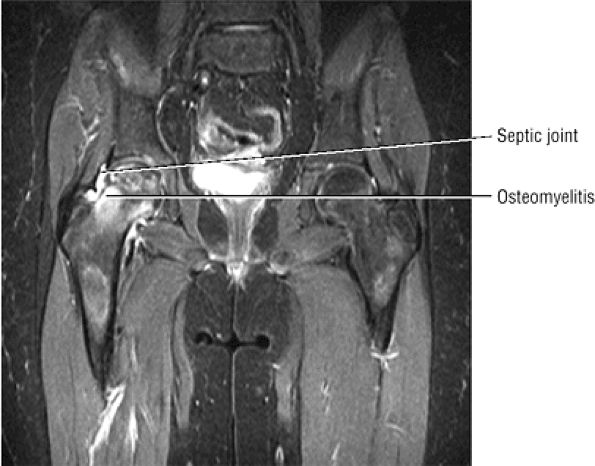 |
|
FIGURE 3.296 ● Septic joint complicated by osteomyelitis. In children there is separation of the blood supply to the metaphysis and epiphysis, resulting in hematogenous spread with the focus of infection in the metaphysis. Coronal FS PD FSE image.
|
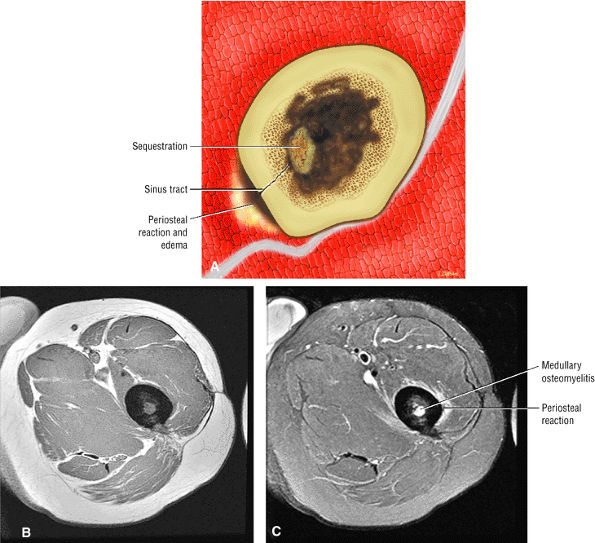 |
|
FIGURE 3.297 ● (A) Osteomyelitis of the femoral diaphysis with sequestrum, sinus tract, and periosteal reaction. Axial T1-weighted (B) and FS PD FSE (C) images showing osteomyelitis with a hyperintense focus within the medullary cavity and hyperintense periosteal reaction in (C).
|
-
Hyperintense marrow involvement
-
Hyperintense intraosseous abscess
-
Intermediate to hyperintense cortical destruction
-
Cloaca (periosteal opening) demonstrating focal hyperintensity in the hypointense periosteum
-
Intermediate to hyperintense sinus tract
-
Brodie—s abscess (a round abscess cavity seen in chronic pyogenic infections) with a hyperintense abscess, a hypointense sclerotic rim, and hyperintense marrow edema
-
Hypointense sequestrum
-
Associated cellulitis demonstrating reticulated subcutaneous hyperintensity
-
Associated myositis with muscle hyperintensity and enlargement
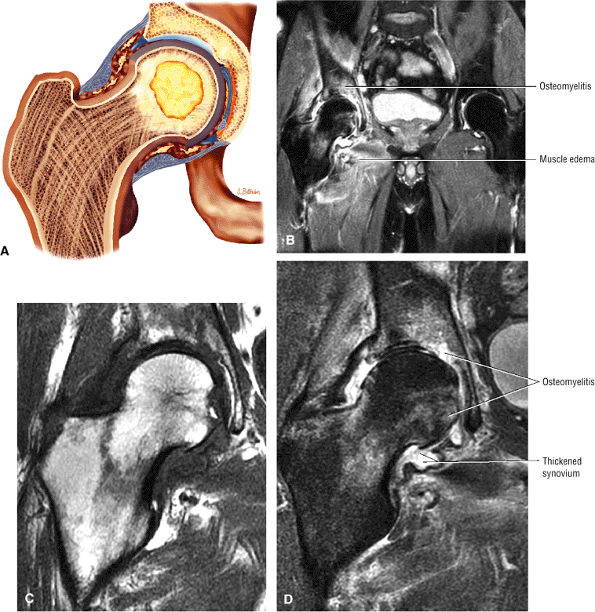 |
|
FIGURE 3.298 ● (A) Synovitis and femoral head nidus of infection that has extended to involve the acetabulum. In the adult, contiguous spread and direct implantation of infection from an adjacent soft tissue infection or wound are more common mechanisms. (B –D) Osteomyelitis with femoral and acetabular erosions in an HIV-infected patient. The infected joint fluid is associated with intermediate-signal-intensity thickened synovium. Soft tissue inflammatory muscle edema is visualized on the large-FOV image. (B) Coronal FS PD FSE image. (C) Coronal T1-weighted image. (D) Coronal FS PD FSE image.
|
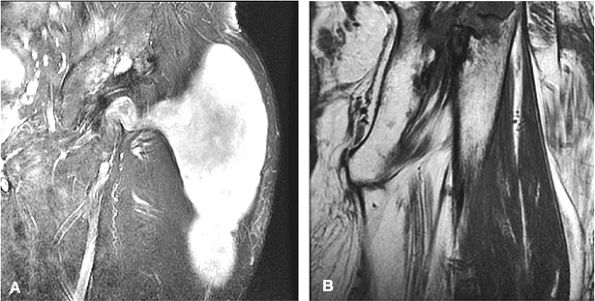 |
|
FIGURE 3.299 ● Tuberculous abscess associated with proximal femoral destruction (osteomyelitis). Monarticular involvement of large joints such as the hip is common. Joint infection is caused by direct extension of osteomyelitis or hematogenous dissemination. (A) Coronal FS PD FSE image. (B) Coronal T1-weighted image.
|
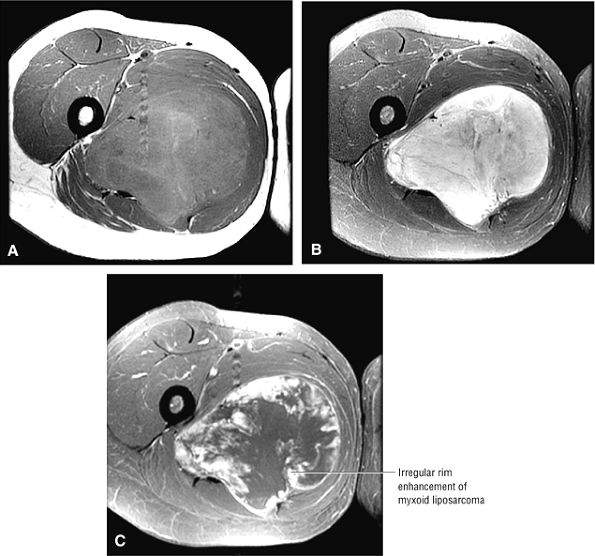 |
|
FIGURE 3.300 ● Myxoid liposarcoma of the medial thigh, which could be mistaken for an abscess. The myxoid type (40% to 50% of liposarcomas) characteristically shows a lack of fat signal on T1-weighted images and may peripherally enhance with contrast administration. The intermediate to hyperintense signal on FS PD FSE images, however, indicates a solid soft tissue sarcoma. (A) Axial T1-weighted image. (B) Axial FS PD FSE image. (C) FS T1-weighted contrast-enhanced image.
|
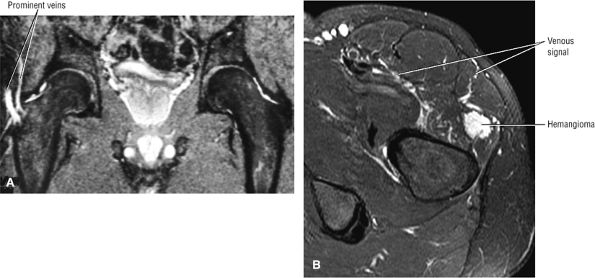 |
|
FIGURE 3.301 ● (A) Prominent veins associated with a cortical osteoid osteoma of the proximal femur. A pair of veins is frequently associated with the focus of osteoid osteoma. Coronal FS PD FSE image. (B) In a separate case, venous signal is associated with a soft tissue hemangioma about the hip. Axial FS PD FSE image.
|
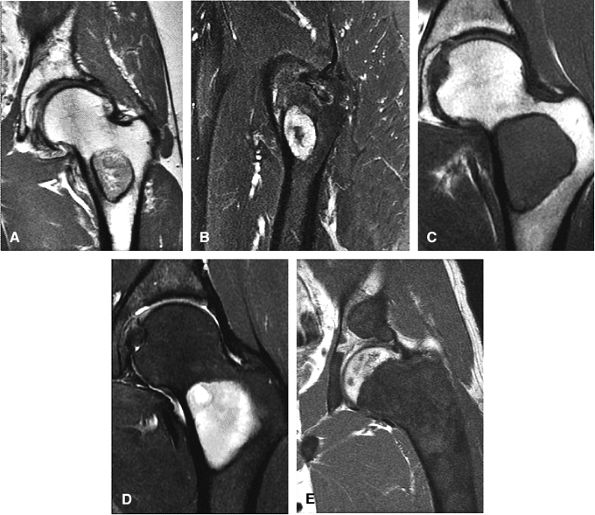 |
|
FIGURE 3.302 ● Liposclerosing myxofibrous tumor of the proximal femur with a sclerotic hypointense border on a coronal T1-weighted image (A) and heterogeneous hyperintense signal on Sagittal FS PD FSE image (B). There is characteristic intertrochanteric involvement. Fibrous dysplasia of the proximal femur is shown with a characteristic thick sclerotic rim and intermediate-signal homogeneous matrix on coronal T1-weighted (C) and FS PD FSE (D) images. (E) Separate case demonstrating polyostotic fibrous displasia affecting both the pelvis and femur. Coronal T-1-weighted image.
|
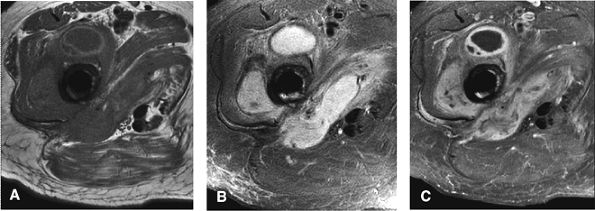 |
|
FIGURE 3.303 ● Soft tissue infection with abscess formation associated with an intramedullary rod. The localized artifact does not preclude visualization of adjacent soft tissue. (A) Axial PD FSE image. (B) Axial FS PD FSE image. (C) Axial FS-enhanced TI-weighted image.
|
-
Bone marrow enhancement (indicating inflammation)
-
Peripheral enhancement within the medullary canal or soft tissue (thick wall) in abscesses
-
Enhancement peripheral to a sequestrum
-
Cortical erosion and destruction may or may not show enhancement.
-
Peripheral enhancement of sinus tracts
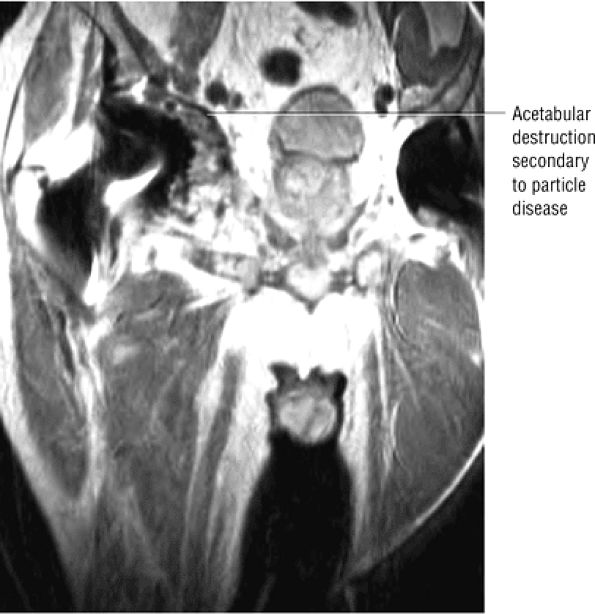 |
|
FIGURE 3.304 ● Aggressive granulomatous reaction in a cementless total hip arthroplasty with destruction of the medial acetabulum. Coronal PD FSE image.
|
in up to 10% of cases, and these lesions should be monitored for changes in morphology, signal intensity, or clinical symptoms such an associated pain.